

2 Samurais Have Fallen. Is a Third Next?
The 10 Year Trend upon us

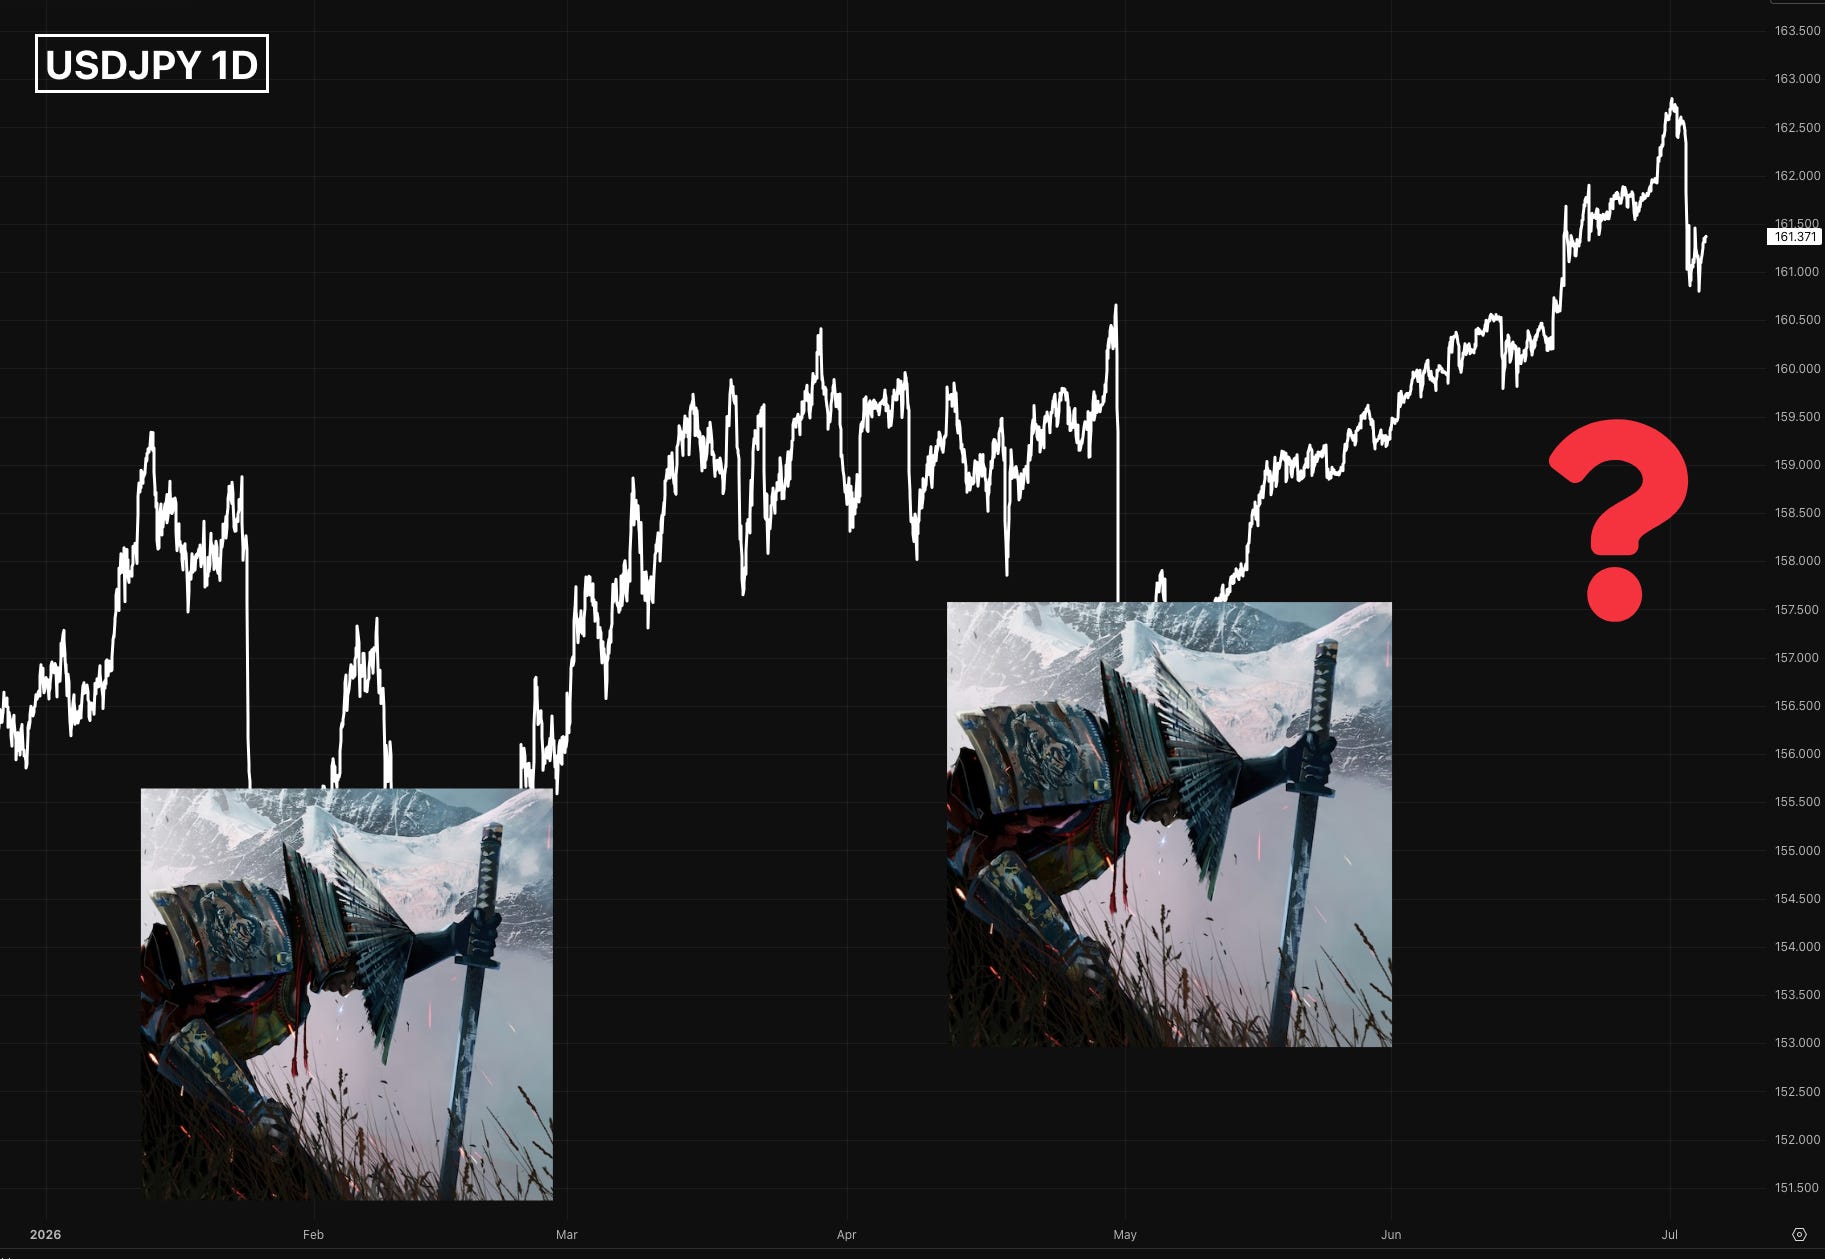
Look at the chart above
Every Samurai is the Bank of Japan stepping in to save the yen.
Every time, the price crept back up. The Samurai Keeps Falling
They just stepped in again(confirmation pending). And everyone is asking the same question:
Will price creep back up this time too?
You don’t need a crystal ball to answer it. You need to follow one thing.
Debt. And how the world rolls it over.
Refinancing works like this; Your old loan comes due. You take a new loan to pay off the old one. That’s it. Countries do it. Banks do it. Investors do it.
The historic Trend is the path that governments, banks and investors take to refinance their debt is now driving yields, currencies, bank profits and stock flows.
This is not a trade of the week. This is a trend for the decade with sharp, violent pockets along the way.
I’m going to hand you the pieces one at a time. Each one is a fact you can check. You’ll build the conclusion yourself.
Piece 1: Japan cannot afford fast rate hikes. Its own budget IS CONSTRAINT
Japan’s Ministry of Finance did the math themselves.
Their projection: debt costs rise about 25% by 2028** to nearly $230 billion a year (Just to pay interest).
Think of a mortgage. When rates go up, your payment goes up. Japan has the biggest mortgage in the world. So every rate hike the Bank of Japan makes, the government pays for.
Now watch what the BOJ actually did.
16 months, 2 hikes. From 0.5% to 1.0%. That’s a crawl.
BOJ board members Tamura, Himino have said publicly where “normal” rates should sit: around 2%
They told us the destination. Then they chose the slowest possible road to get there.
Why? Go back to the mortgage. They can’t afford the fast road.

Piece 2: While the BOJ crawled, the bond market wasted no time
While the BOJ moved 0.5%, the 10-year Japanese government bond yield nearly doubled — to 2.745%. The highest in 29 years.
And the yen?
The yen fell to its weakest level in 40 years. Past 162 per dollar.
(The central bank is hiking and the currency still made a 40-year low)
How? Simple.
When your central bank hikes slower than everyone knows it should, borrowing your currency stays cheap. Traders borrow cheap yen, sell it, and buy things that pay more. That’s the **carry trade**.
Slow hikes don’t kill the carry trade.

Piece 3: Germany flipped the other way and borrowed heavily in short term paper
Japan is trapped by old debt. Germany just built a mountain of new debt.
On March 21, 2025, Germany’s upper house approved it, 53 votes to 16:
Defense spending above 1% of GDP freed from the debt brake. Plus a **€500 billion** off-budget fund over 12 years. (€100 billion of it tagged for climate, to win the Green vote.)
Chancellor Merz used the words “whatever it takes.”The same words Draghi used to save the euro in 2012. Except Draghi meant printing. Merz means borrowing.
Deutsche Bank Research put 2025 net borrowing at €143 billion 3.3% of GDP. Roughly double the year before.
Now here’s the detail that matters most. Look at how they’re borrowing:
12-month bills: €134.5bn in 2025 → €176bn in 2026.
2-year notes: €75bn → €92bn.
5-year notes: €63.5bn → €73bn.
The short end is doing all the work.
Borrowing short means one thing: you come back to the market fast. Again and again and again. Every year, a bigger pile needs new buyers.
That’s a massive liquidity push. Fresh paper, fast turnover, forever asking the market: *who’s buying?*
Piece 4: When yields rise at home, one group gets paid: the Banks
A bank’s business is a gap.
It pays you almost nothing on your deposit. It lends that money out at long term rates. The gap between the two is its profit.
For ten years in Europe and Japan, that gap was crushed flat. Rates were zero or negative. Banks earned almost nothing.
Now long yields are rising from the floor. The gap is opening back up fastest exactly where it was most crushed.
Europe Bank Stocks:
The EURO STOXX Banks index jumped 80.3% in a year. Its best year since the data began in 1987 (FYI my birth year).
Société Générale +139%. Commerzbank +136%. Santander*+110%. Deutsche Bank +92%.
Europe’s Renaissance

Piece 5: The money leaving bonds doesn’t vanish they parks in Stocks
The bond market is roughly 20 times bigger than the stock market.
So when bond holders sell and (they’ve been selling) that money has to go somewhere. Most of it parks in equities.
That gives you a picture of the plumbing that looks crystal:
Government bonds down and stocks melting up. At the same time
In Q2 2026, the S&P 500 added $8.74 trillion in value to a record $67 trillion. Its best quarter since 2020.


At the very same time: the Japanese 10-year at a 29-year high
The US 10year near a 15-month high (Bond yields move opposite to Bond prices)
Cheap borrowed yen helping fund the AI and chip melt-up.
Bonds bleed. Banks collect. Stocks melt. One system.
Piece 6: The cracks are starting to show at the auctions
If this story has a stress gauge, it’s government bond auctions. That’s where a country literally asks the market for money.
July 2, 2026. Japan’s 10-year auction.
The “tail” (the gap between the expected price and the price buyers actually demanded) widened 4x (0.05 → 0.2).
A wide tail means buyers stepped back and said: pay us more premium
The 20-year auction was worst demand since 1987 (see the pattern)
That’s refinancing stress made
These are the volatility pockets I mean: intervention days, hawkish shocks, ugly auctions, sharp and fast (and so far bought back within days) but the bigger flow hasn’t changed.
Piece 7: How far can this run? There’s an old anchor
An old rule of thumb: over time, long term yields settle near 2x inflation. Lenders want to beat inflation with cash to spare.
Fair value at today’s core inflation (based on thesis):
for the Japanese 10-year: about 5.8%. It sits at 2.745%.
for the German 10-year: about 4.8%. It sits near 2.95%.
I don’t need those exact numbers to be right. I need the *direction*. Both markets sit far below the fair value (a balancing feedback loop in systems thinking). This repricing is roughly halfway there.
And that’s how you know it’s a decade trend, not a headline.

Now you have all the pieces put together.
Will price creep back up after this intervention?
Walk it through:
Japan can’t hike fast (its own budget says so)
Slow hikes keep yen borrowing cheap
Cheap yen feeds the carry trade
The carry trade sells yen
An intervention changes the price for a day. It doesn’t change the math.
The math only changes when yields finally reach fair value when bonds pay enough for the risk of the country selling them. On that day, money rotates back from stocks into bonds. And because bonds are 20x the size, that rotation won’t be gentle. Something gets sold hard to fund it (usually stocks)
Until that day: the samurai falls, the banks collect the gap, the melt-up runs, and every dip is just an opportunity to load up.
One more thing because I’d rather be checkable than comfortable:
This thesis is falsifiable. If yields reach 2x inflation and equities are still melting up, the anchor is broken and I’m wrong about the endgame.
That’s the difference between a thesis and a story.
*Not financial advice. Every number above is checkable against primary sources: Japan MOF projections, BOJ statements, Bundesrat records, the German Finanzagentur issuance calendar, and exchange prints. Check them.* YOU MAY LOSE ALL YOUR MONEY AND SANITY IF YOU ACT ON THE INFORMATION ABOVE.
TRADE STRONG
MIAD