



I think of the market as a system: a hierarchy of interconnected behaviours and forces that change over time. Reinforcing loops matter enormously for price discovery. To read the market is to understand how far a loop can exert influence before it becomes restricted, either by itself or by a balancing loop. This is the backbone of my analysis, both on the chart and in the internal somatic work I do.
Stripping back the jargon, the market is a stock of money. It has an inflow tap and an outflow tap. Within the stock sit competing pools that either grow the money (reinforcing loops) or drain it (balancing feedback loops).
(To go deeper here, study Thinking in Systems by Donella Meadows.)

The stock of money can grow in two ways:
Inflows run faster and larger than outflows.
Outflows run slower and smaller than inflows.
There are laws to this. A stock cannot grow infinitely before it rebalances.
The real complexity in financial markets is not the inflows or the outflows effecting the level of the stock. It is reading the behaviour of the interconnected loops acting on the stock. That takes experience, truth-seeking, time, honesty, unrelenting agility, and a mechanism for making decisions in an inherently unpredictable environment. This is what your subscription is paying for, alongside community access.
As of late, the inflows to the stock of money have been very
loose. USD has been abundant. You can see it in the Fed balance sheet, which has injected over $200bn this year, and in the TGA, which has drained from roughly $900bn to $700bn, among other metrics we track.
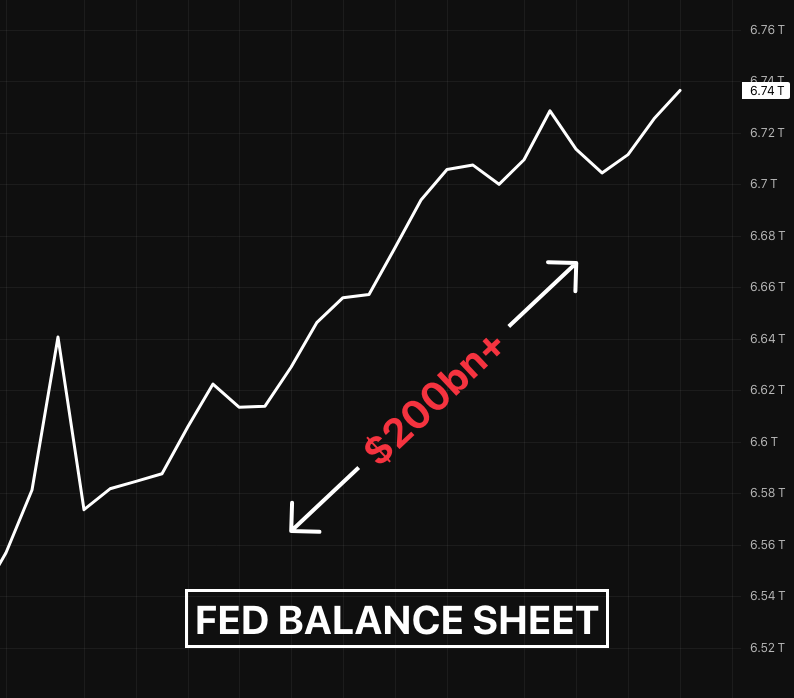
That is your reinforcing loop. A great deal of it carries a delayed reaction function, meaning there is a lag between a change in the loop and a change in the level of the stock. That lag runs from weeks to months to years (think oscillation).
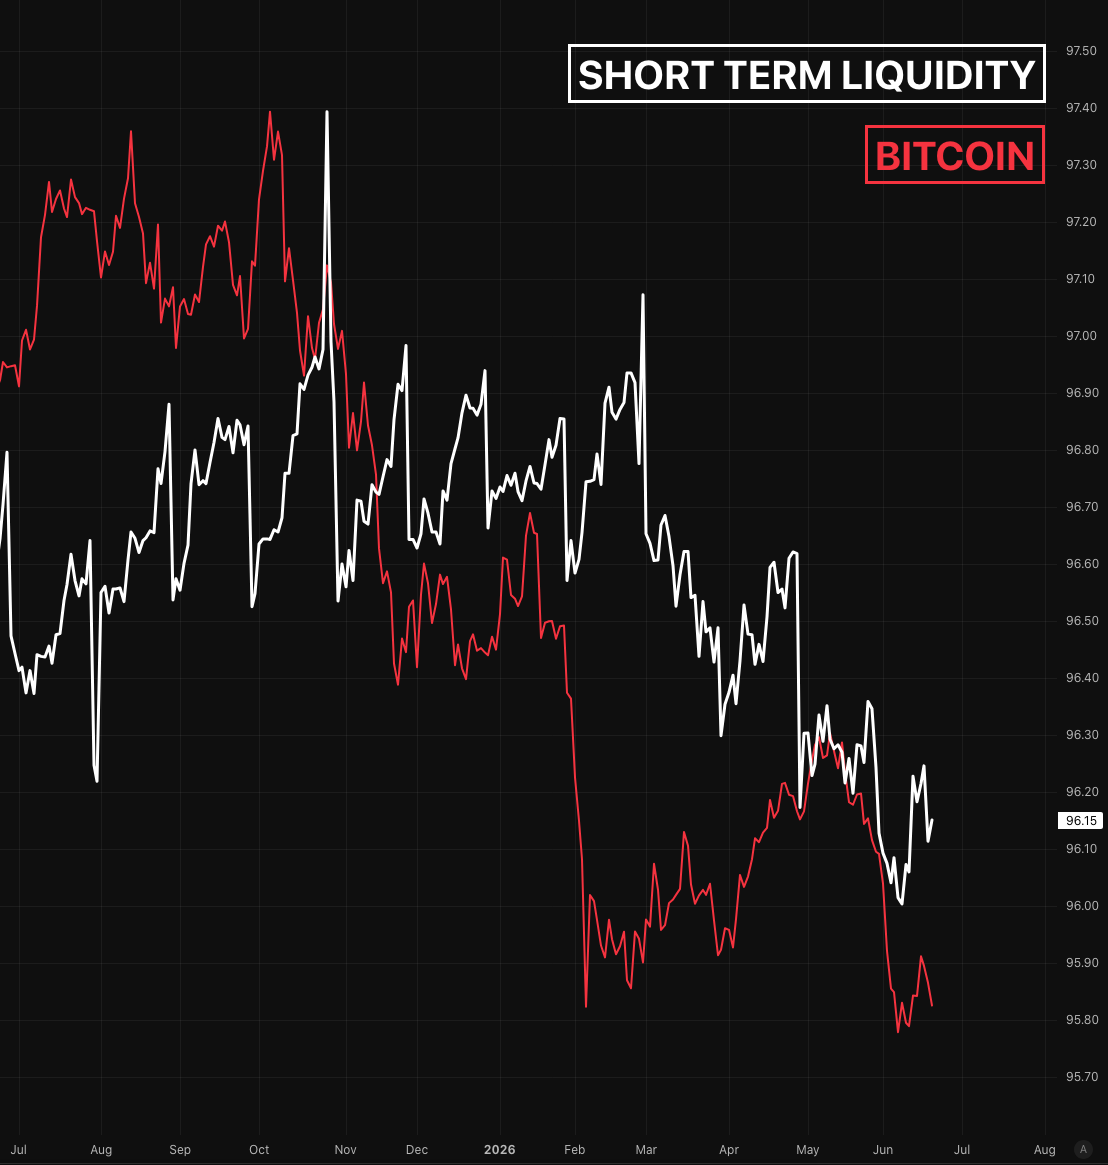
So when liquidity loosens, assets like bitcoin react fast, because they are highly sensitive to liquidity and carry the shortest reaction time from feedback loop to actual stock change. Other assets move slower. A shock to the market, like a recession, war, or catastrophe, collapses the entire delaying timeline. This is why correlation charts of leading and lagging assets occasionally break down or reset after an event, though that is outside the scope of this write-up.

We also have competing loops, where one dominates another. This is where the entire news, macro, analysis, trading, speculating, and hobbyist community anchors itself. The whole focus is to nail down which loop, reinforcing or balancing, is the most dominant. Sometimes price leaves the clue; sometimes unfolding events do. But the forensic work of market research boils down to one question: which feedback loop is dominating, and for how long.
When the behaviour of those loops changes, I pay close attention, because that is the first clue to a massive change in price. The first such clue came from Kevin Warsh (KW). He is slowing the inflow tap by sharply decreasing balance sheet injections, and he is also stripping away speculative positioning by refraining from forward guidance. Much can be said about the benefits and drawbacks of forward guidance, but the change in behaviour is clear.
Now, remember that the market is a hierarchy. The Fed sits right at the top, and its purpose is to serve those below it in reaching their goals, which in turn helps the Fed reach its own.
Officially, the Federal Reserve has two goals: price stability (inflation around 2%) and maximum employment (the lowest stable unemployment rate possible).
A change in behaviour from KW will ripple through the whole system, and the rest of it will change in turn. I will not speculate on how that plays out, because it will take several quarters to see how the structure evolves (there are historical patterns here, also outside the scope of this write-up).
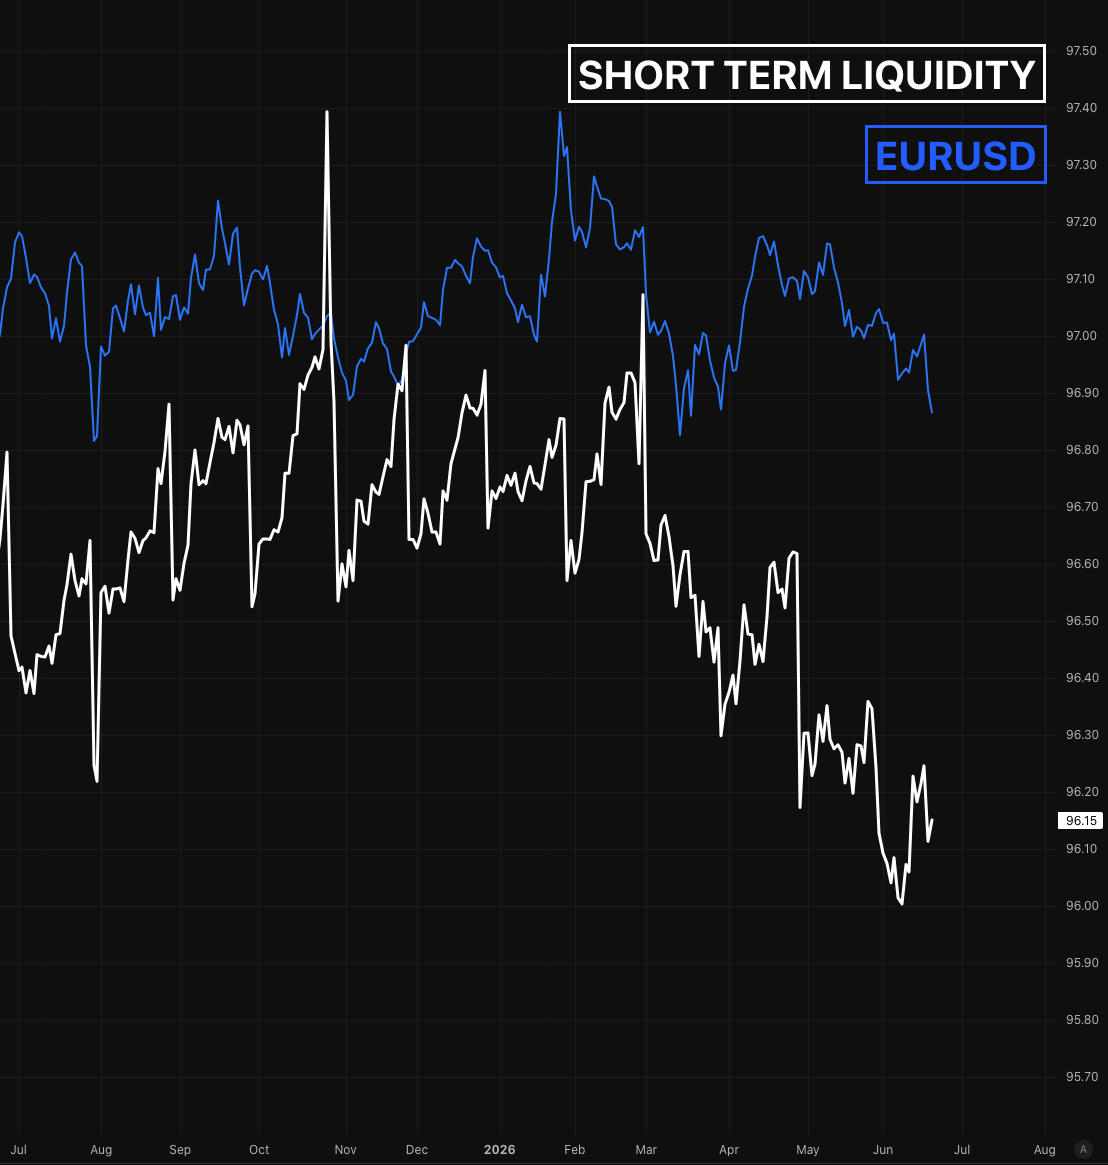
But here is what we know, and have been right about. USD liquidity is tightening (lower EURUSD), and money is moving from the edges of the risk curve towards the middle: less risky assets are preferred, and crypto is shunned.
Nothing stays the same. Liquidity will expand again as the system reorganises itself and new loops take over to drive prices. And that is the beauty of the market.
Among many liquidity metrics and ratios we track. When banks and dealers face higher costs or limits holding Treasuries due to rules and tight balance sheets, the spread goes down. See chart below compared to Bitcoin (sensitive to liquidity and fastest reaction to rebalancing loops).
Other assets such as EURUSD have started to react to the change of dominating loops.
Tighter liquidity will eventually hit stocks too but with a longer fuse, often 6 months or more. That doesn’t mean other reinforcing loops won’t try to take control. But if they lose, the dominant balancing loop will reset the stock.
Events and headlines are simply the system revealing its structure. When something sudden or “unexpected” happens and then happens again it’s usually not a surprise at all. It’s a well practised behaviour embedded in the system.
Shifts in behaviour reshape the reinforcing loops, and when those loops dominate, they move the level of the stock. But loops don’t translate into stock levels instantly. There’s a time delay and that gap is where speculative positions get built.
Right now, competing loops are fading and a rebalancing force is taking over: the retreat of abundant US dollars. Bigger structural shifts are still underway, setting up larger trends for the months and years ahead and they’ll make themselves known the way they always do: through an event.
Trade Strong
Miad
Stronger Article guys, reads authentic with some AI polish (rather than the extended prose on some of your other copy) and charts useful. More of the same! Nice one!