

Crypto Market Insights: Ethereum Surge, Altcoin Rotations, and US Tech Earnings

Executive Summary
The cryptocurrency and equity markets are experiencing significant momentum in July 2025, driven by technical breakouts, regulatory developments, and macroeconomic catalysts. Ethereum has emerged as a focal point, exhibiting a robust upward trajectory with potential to reach new all-time highs, fueled by a multi-year consolidation breakout and favorable legislative changes in the U.S. This report synthesizes technical analysis, regulatory insights, and market strategies, providing a comprehensive outlook for market participants looking for a keen edge in a dynamically evolving financial landscape both for Crypto investments and US equity investments. Key areas include Ethereum’s price action, altcoin opportunities, U.S. equity indices, and the impact of the AI revolution on tech revenues.
1. Ethereum Market Overview
1.1 Recent Price Performance and Historical Context
Ethereum has undergone a significant rally, surpassing key resistance levels and demonstrating strong bullish momentum. Since November 2024, Ethereum’s price has risen sharply, reminiscent of its May 2021 run-up. This performance is attributed to capital rotation from Bitcoin to altcoins during periods of Bitcoin’s sideways movement, a common dynamic in bull markets. The current rally has broken through all identified weekly resistance zones, establishing them as future support levels, with no immediate resistance until approximately $4,100.
1.2 Capital Rotation Dynamics
The analysis highlights a strategic rotation of capital from Bitcoin to altcoins, particularly Ethereum, when Bitcoin’s price action stalls. This rotation is driven by Bitcoin’s correlation with U.S. stock indices, which appeared overstretched on the two-week candle in early July 2025. As Bitcoin traded sideways, capital flowed into Ethereum, catalyzing its explosive price action. This pattern underscores the importance of monitoring Bitcoin’s market behavior to anticipate altcoin opportunities.
2. Ethereum Technical Analysis
2.1 Rainbow Pattern and Support Levels
Ethereum’s price action follows a “rainbow pattern,” a technical formation characterized by a daily bullish order block holding as support, followed by an explosive breakout. This pattern, identified at lower price levels, has propelled Ethereum past resistance zones, with the yearly open at $3,330 now serving as a critical support level. This level, coinciding with the January 1, 2025, opening price, is a significant reference point for the year’s price action and is expected to hold during pullbacks.
2.2 Resistance Zones and Price Projections
With resistance zones at $3,300 and $3,500 breached, Ethereum faces minimal resistance until $4,100, with potential to reach all-time highs near $4,867. The quarterly chart reveals a multi-year ascending triangle forming since 2021, with the $4,000 level tested multiple times. This consolidation suggests a breakout above $4,000 could drive Ethereum to $10,000, supported by strong technical momentum and institutional interest.
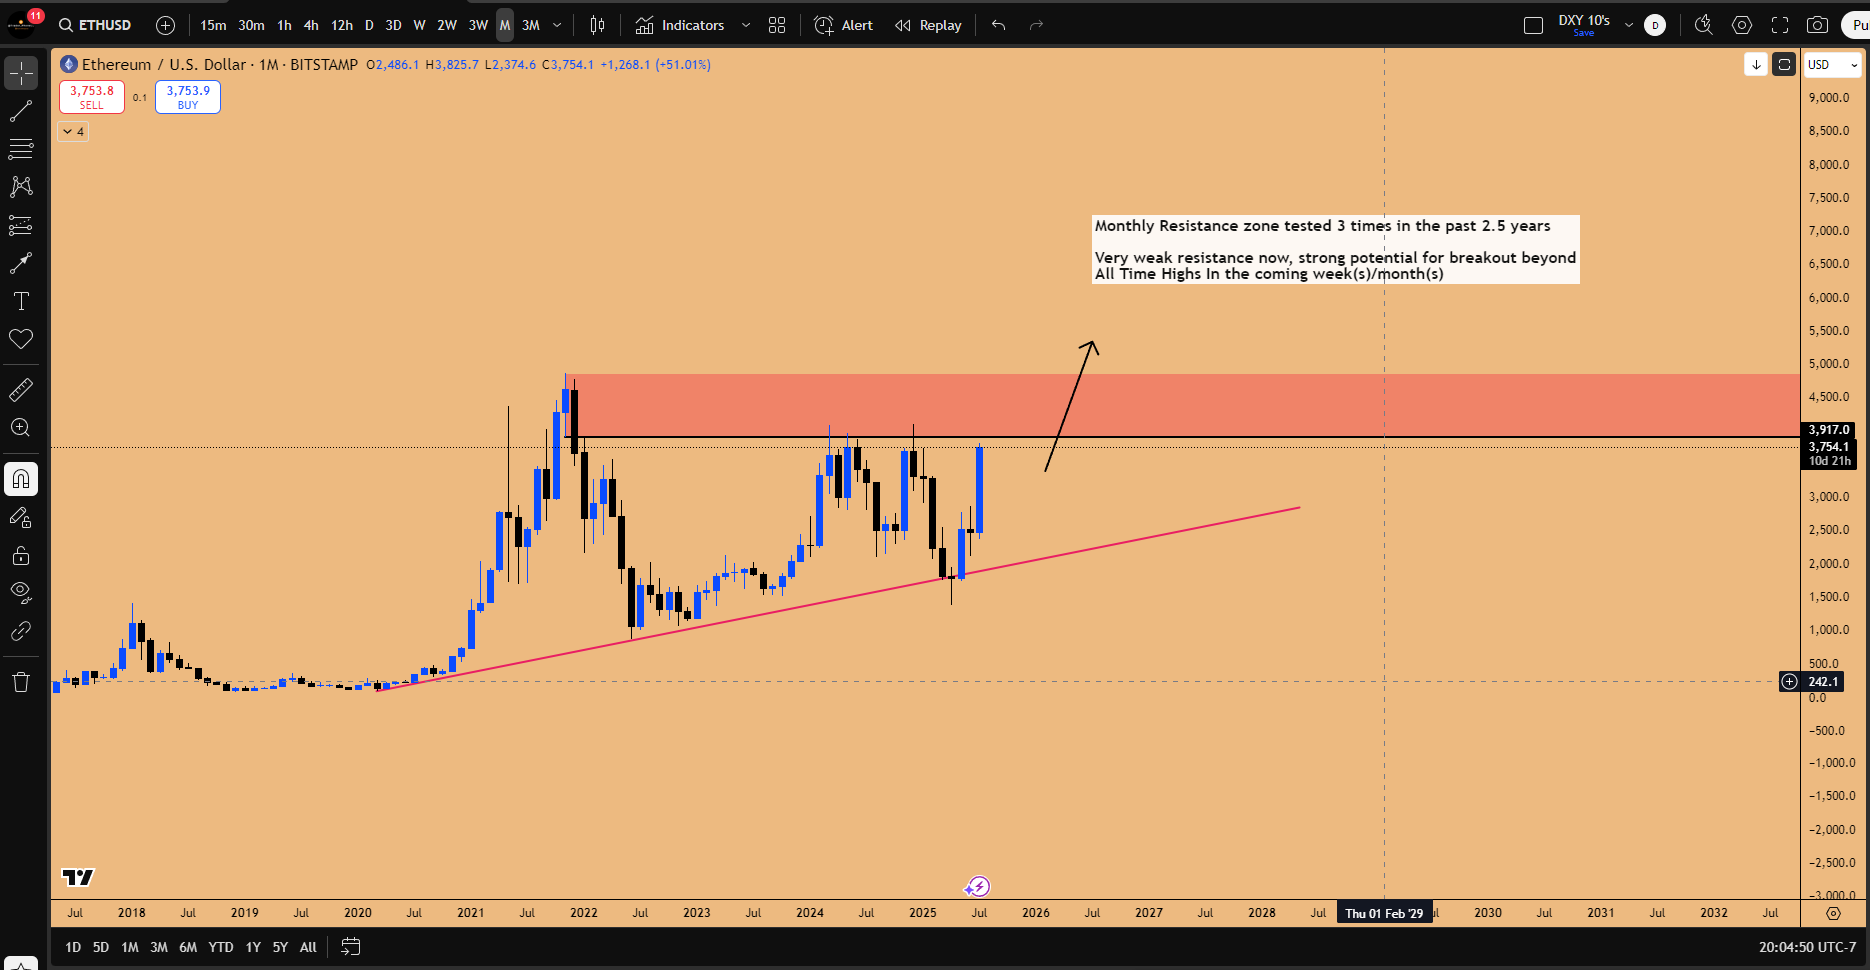
Figure 1. ETHUSD Macro time frame Ascending Triangle in formation. Ceiling at 4000-4100 getting tested for the 3rd time in the past 2.5 years.
2.3 Trading Strategy and Risk Management
The recommended trading approach emphasizes risk management:
Profit-Taking: Long positions initiated at $2,500 were advised to be closed at $3,300–$3,500, in order to reduce exposure just in case market rejected the main. resistance zone
Re-Entry Points: Pullbacks to yearly open level of $3,330 offer opportunities to re-enter long positions, leveraging the yearly open as support.
Risk Management: Opening New long positions at current levels ($3,735) is very risky, as it carries a low risk-reward ratio, suggesting caution for new entries. Spot positions, however, can be held for long-term upside to $10,000 .
2.4 Higher Time Frame Analysis
Higher time frame charts (weekly, three-week, monthly, quarterly) indicate Ethereum’s current rally is overstretched but sustainable. The three-week candle shows significant extension, suggesting a potential pause or consolidation in the next two weeks. However, the breakout above weekly resistance zones supports further upside in August 2025, targeting liquidity at $4,100. The quarterly chart’s ascending triangle reinforces a bullish outlook, with a breakout above $4,000 signaling a move to $10,000.
Main Takeaway:
Ethereum's quarterly chart since 2021 shows a massive ascending triangle consolidation, with resistance at the $4,000 level tested three times, now going for the fourth test and higher lows forming, building significant energy for a breakout.
Once above $4,100, the rally which will get unleashed in the month’s to come is expected to reach $10,000, supported by technical setups and catalysts like the the passage of the GENIUS Act, CLARITY Act and CBDC Anti-Surveillance State Act in the U.S.
This will spark institutional order flow into Ethereum and altcoins for the next one to two years as the regulatory framework should allow crypto firms to come back onshore to operate their Businesses in USA, rather than being forced to operate offshore, with no access to capital from US based institutional investment (More on this later).
Actionable Insights:
Watch for a breakout above the $4,000 ceiling on the quarterly chart (noted as weak after multiple tests); enter long positions on any pullback after a confirmation is provided for macro breakout to be in progress. Confirmations can come in the form of a quarterly candle close above this level (4000$), as it signals the "mother of all breakouts" similar to Bitcoin's 2018 pattern macro consolidation breakout which was triggered on September, 2020, leading to Bitcoin rallying from 15,000$ → 69000$ (330% ROI).
Use any pullback opportunity to position for a spot long entry opportunities, anticipating higher lows to hold. Macro invalidation for long bias is now at 2100$ higher low
Target initial upside to $10,000 post-breakout, with potential for a 300% gain to around $16,000 based on the Bitcoin analogy (from 2018 consolidation breakout yielding 330% to $69,000), given Ethereum's smaller market and available slush capital.
Factor in regulatory tailwinds from the GENIUS and CLARITY Acts passing through the US House and into law, enabling institutional flows to boost the breakout's steam.
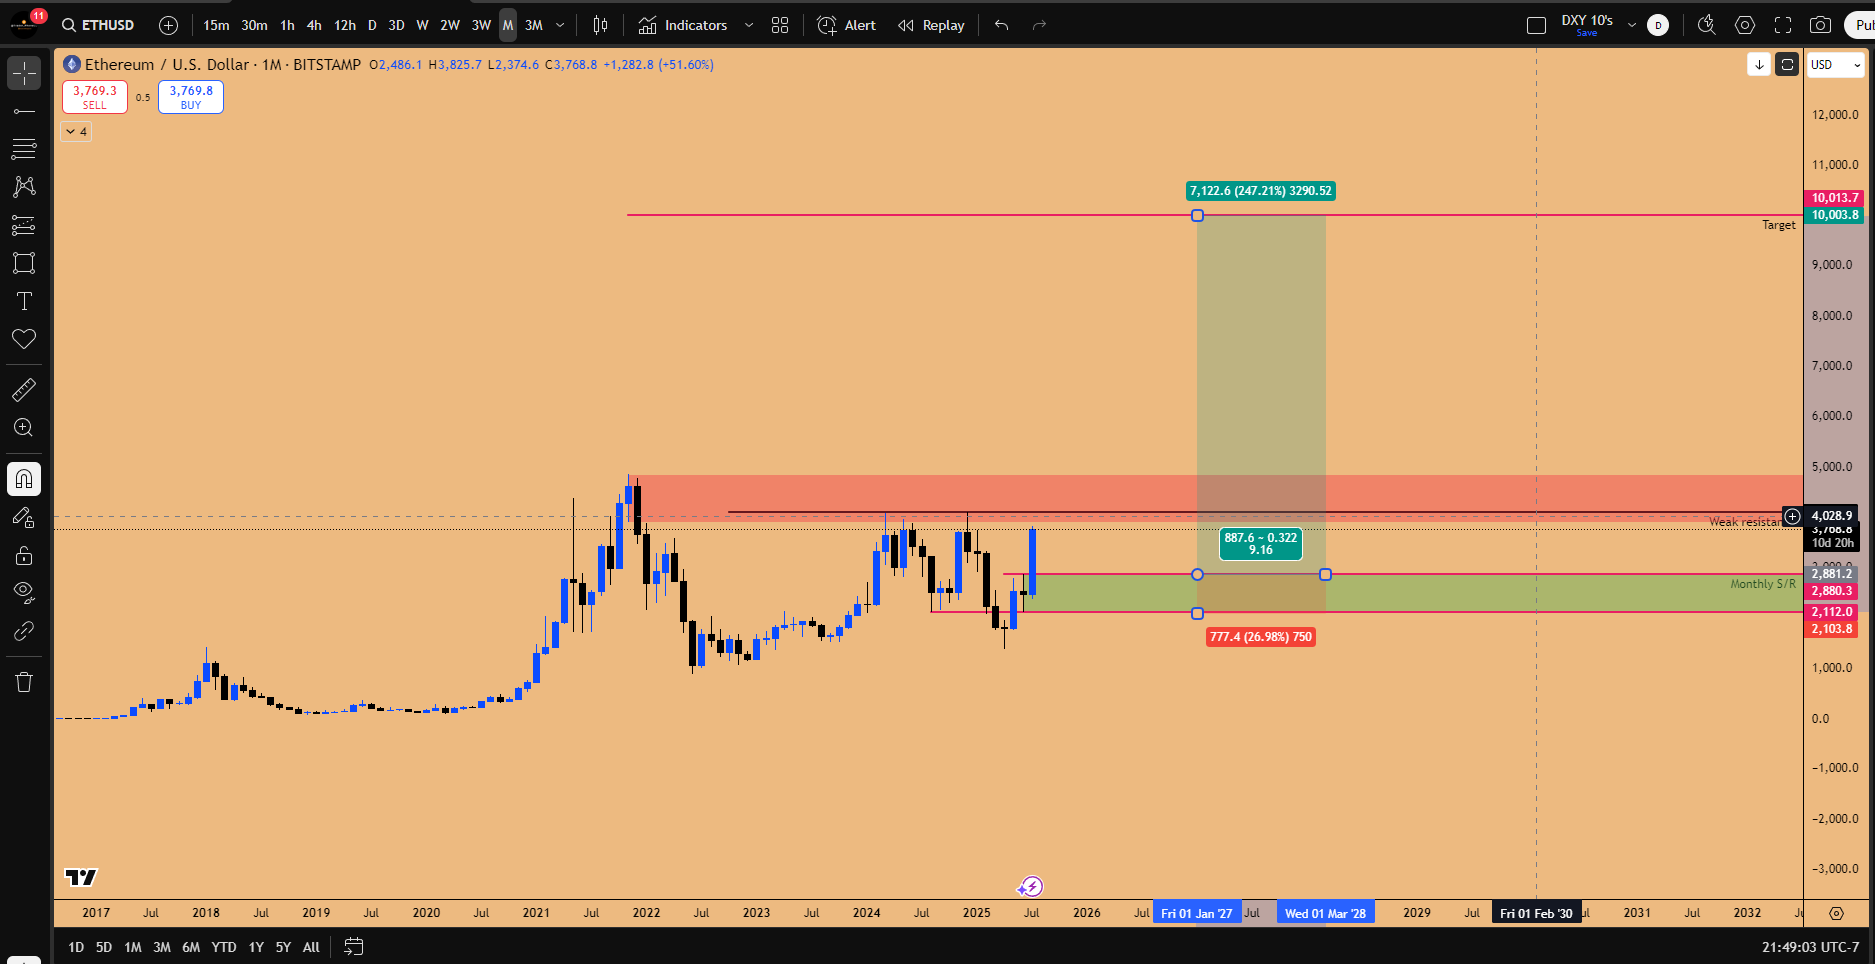
Figure 2: Potential Spot Long play in ETHUSD, going into 2026
3. Regulatory and Fundamental Catalysts
3.1 Legislative Developments
The passage of the GENIUS Act, CLARITY Act and CBDC Anti-Surveillance State Act in the U.S. House is poised to enhance institutional capital flows into cryptocurrencies. These bills provide regulatory clarity, reducing barriers for crypto firms to operate in the U.S. The GENIUS Act specifically supports stablecoin adoption, while the CLARITY Act establishes a framework for crypto projects, mitigating SEC enforcement risks. These developments are expected to drive capital into altcoins, including Ethereum, over the next one to two years.
3.2 Impact on the Crypto Ecosystem
The regulatory shift reverses constraints imposed by previous SEC actions under Gary Gensler, which limited U.S. capital access for altcoin markets post-FTX collapse. With firms like Binance and Bybit potentially returning to the U.S., fresh capital is anticipated to flow into altcoins, boosting liquidity and price momentum. Ethereum’s rally is partly attributed to these legislative tailwinds, enhancing its position as the leading altcoin.
3.3 Institutional Adoption and Stable-coins
Institutional adoption is primarily focused on Stable-coins, not Ethereum directly. However, Ethereum’s blockchain utility supports its price growth, as it facilitates transactions for Stable-coins and other decentralized applications. The distinction clarifies that while Ethereum benefits indirectly, Stable-coins are the primary focus of regulatory adoption.
3.4 The Deep Dive: What you need to know
Main Takeaway
The passage of the GENIUS Act (now signed into law as of July 18, 2025) and the CLARITY Act (passed by the House on July 17, 2025, with bipartisan support and advancing toward full enactment) marks a pivotal shift in U.S. crypto regulation, ending the era of aggressive SEC enforcement under Gary Gensler and establishing a clear framework for crypto innovation, stable-coins, and market access. This fosters institutional order flows into Ethereum and altcoins for the next 1-2 years, reviving the altcoin market by allowing offshore firms to onshore in the U.S., access fresh capital, and operate without constant SEC scrutiny. For an institutional investor, this reduces regulatory risks, enhances liquidity, and signals a green light for strategic positioning in altcoins, particularly those tied to U.S. entities or Trump's World Liberty Financial holdings, as Ethereum leads the pack in any upside.
Actionable Insights for an Institutional Investor Seeking Regulatory Clarity
Monitor Bill Implementation and Onshoring Trends (E.g. Tether): With the GENIUS Act now law, focus on stablecoin issuers like Tether or USDC complying with new reserve and transparency requirements; use this as a proxy for broader market stability. Track crypto firms (e.g., Tether or Binance) announcing U.S. re-entry or partnerships post-CLARITY Act passage—significantly reducing the barriers for crypto firms to onshore their operations to US capital markets, receiving access to fresh new liquidity inflows into crypto projects.
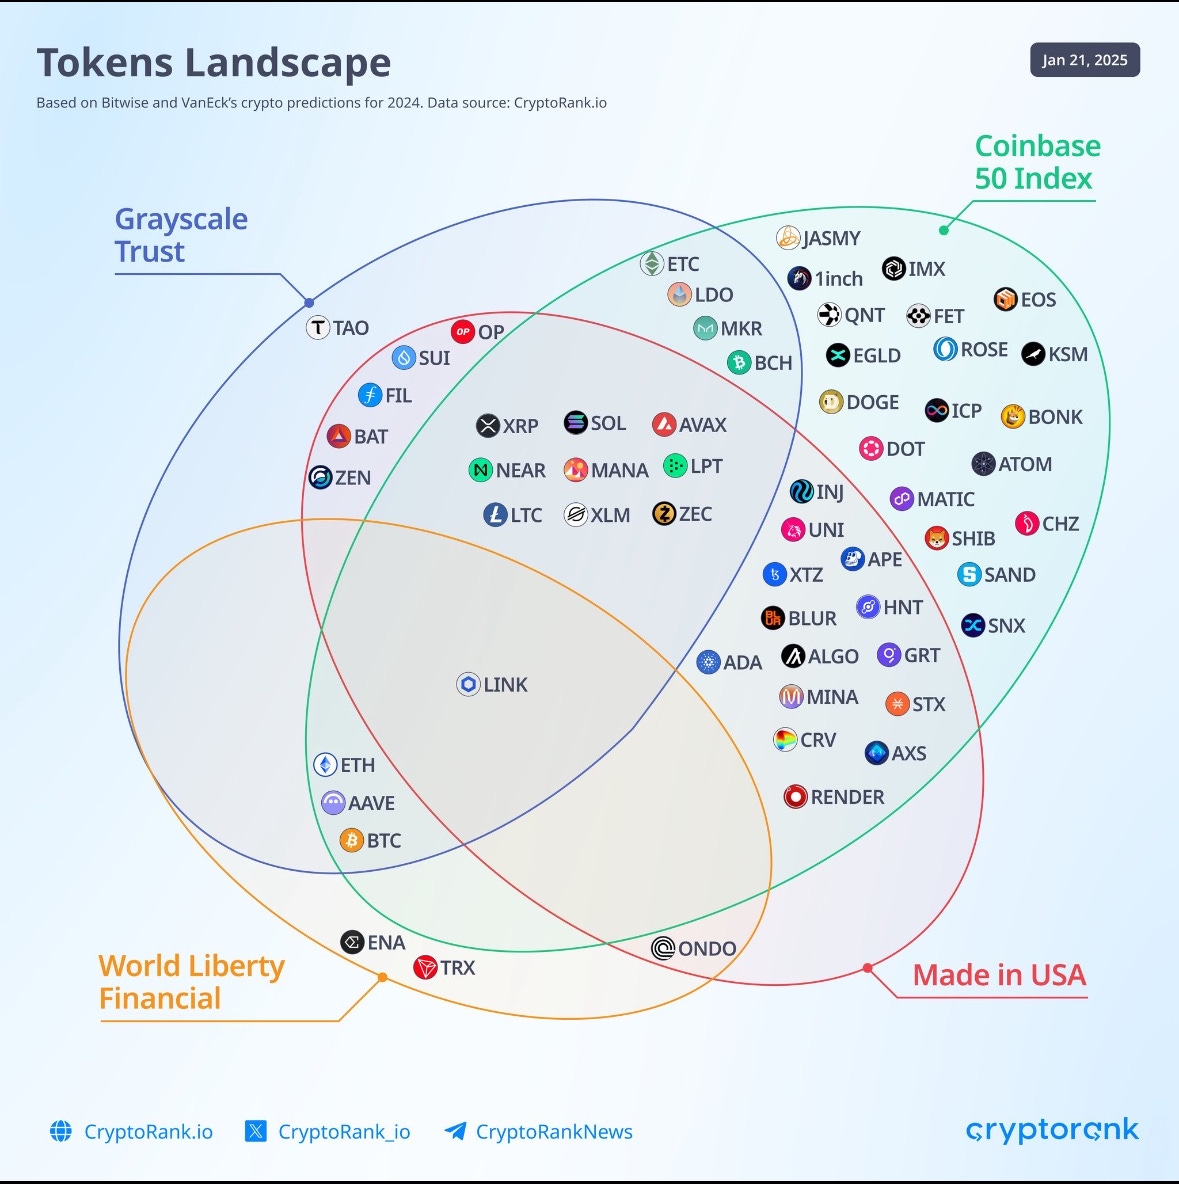
Allocate to U.S.-Based or Beneficiary Altcoins: Prioritize coins with U.S. ties, such as XRP (Ripple, headquartered in San Francisco) and XLM (Stellar, also San Francisco, U.S.-based), which are poised to benefit most from regulatory clarity removing barriers to U.S. capital. Additionally, the positions which were built by Trump family’s World Liberty Financial firm stand to benefit the most (e.g., LINK, XLM, SUI, AAVE, ONDO, BNB, Solana, SEI) as these are flagged as targets for capital flows under the new regime—aim for adding exposure to your portfolio, entering on shallow pullbacks to support zones discussed during the weekly livestream Episode 8.

Figure 3: Crypto Tokens landscape
Leverage Ethereum as the Altcoin Proxy: Since Ethereum is described as the "major altcoin" leading the pack, use ETH/BTC pair breakouts (targeting 0.05) as a signal to increase altcoin exposure. Avoid direct "adoption" bets on Ethereum itself, as the bills primarily adopt stablecoins; instead, view ETH as a utility blockchain gaining from institutional flows.
All In Podcast and Bill Details: Listen to the All-In Podcast episode GENIUS Act becomes law (from the 38-minute mark, featuring Crypto Czar David Sacks and Senator Bill Hagerty) for nuanced insights on bill implications—use it to assess SEC pathway compliance. Anticipate support retests, such as Ethereum's $3,300 yearly open, and look to open a portfolio positioning in ETHUSD to catch the mega breakout down the road, based on the spot long setup discussed earlier.
Timing Entry Post-Passage: With GENIUS Act signed, along with CLARITY Act and CBDC Anti-Surveillance State Act advancing, urgency is higher to actively look to position ahead of Q4 2025, which could see a meaningful "Melt Up" to kickstart.
Potential for pullback, a gift: Upcoming earnigns season and FOMC meeting on 31st July, could provide a much needed pullback post-earnings. Major crypto companies are also set to report their earnings in the coming week(s) (e.g., Coinbase reporting July 31, 2025), which provides a robust time window to look for, if a pullback could begin.
How These Bills Provide Assistance to an Institutional Investor Positioning in Crypto
The GENIUS Act (focused on stablecoins) and CLARITY Act (broader crypto clarity) directly address the regulatory voids that previously deterred institutional involvement by forcing firms offshore after the FTX collapse and former SEC chair Gary Gensler's illicit legal enforcement actions.
By providing a "proper framework to follow" for innovation—ensuring crypto projects (including stablecoins) can build financial products without SEC lawsuits—these laws enable firms to onshore, reopening access to U.S. capital markets that were "killed" for 2-3 years.
This revives liquidity in altcoins via futures platforms, allowing institutional flows to engage using crypto firm’s derivative exchanges once again, as U.S. investors regain access previously denied under Gensler-era restrictions.
For positioning, this reduces legal risks (e.g., no more arbitrary SEC targeting like Coinbase faced), boosts transparency (e.g., stablecoin reserves), and attracts "new fresh capital" from U.S. sources, amplifying upside in Ethereum-led rallies.
Ultimately, it creates a safer, more liquid environment for long-term holds in U.S.-centric altcoins, with Ethereum benefiting indirectly as the alt market leader amid 1-2 years of sustained institutional inflows.
4. Altcoin Analysis and Opportunities
4.1 Ethereum’s Market Leadership
Ethereum’s dominance in the altcoin market drives correlated price movements. A 10% decline in Ethereum typically results in 20–30% drops in other altcoins, underscoring its role as the market leader. Traders should monitor Ethereum’s price action to gauge altcoin performance.
4.2 Specific Altcoin Recommendations
World Liberty Financial Holdings, associated with Donald Trump, highlighted several altcoins in early 2025, including LINK, XLM, SUI, AAVE, ONDO, SEI, TRX, and others. These coins are recommended for portfolio inclusion due to their institutional backing. Notable setups include:
LINK: Exhibits a bullish structure with higher lows and an inside quarterly candle failure, targeting $31.
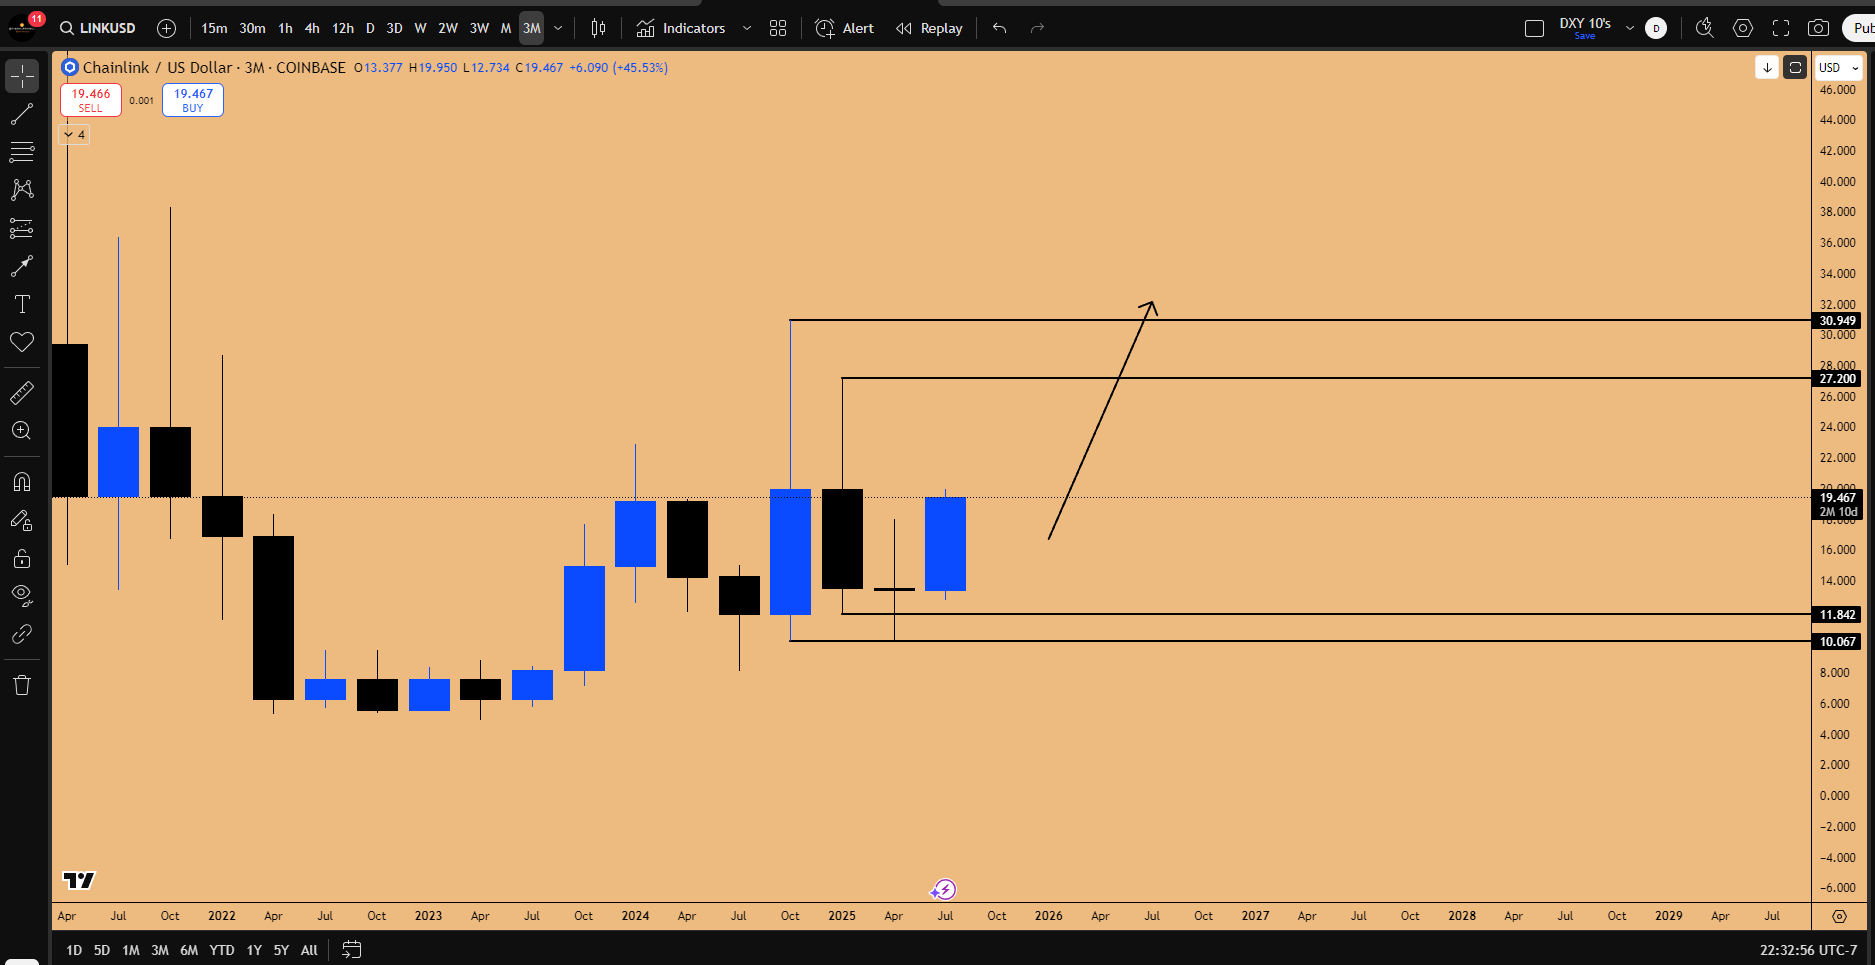
Figure 4: LINKUSD Setup in play
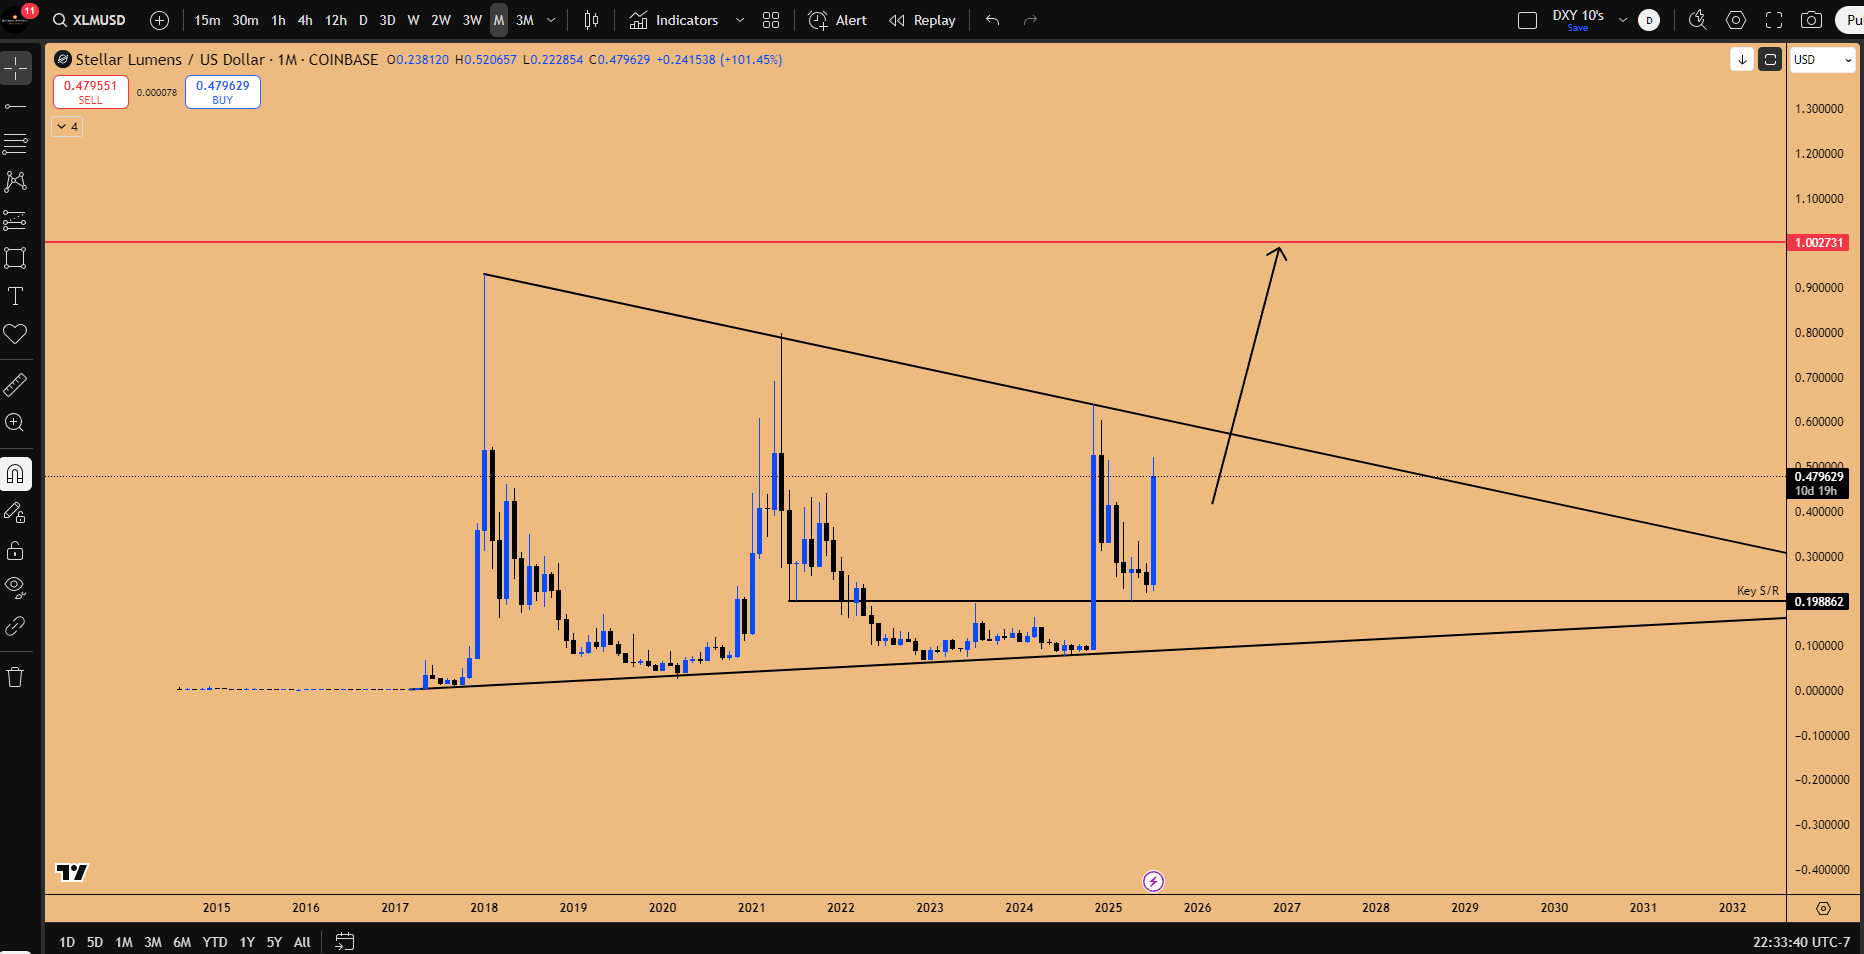
XLM: A multi-year consolidation breakout above $0.63 could drive prices to $1–$2, supported by its U.S.-based operations.
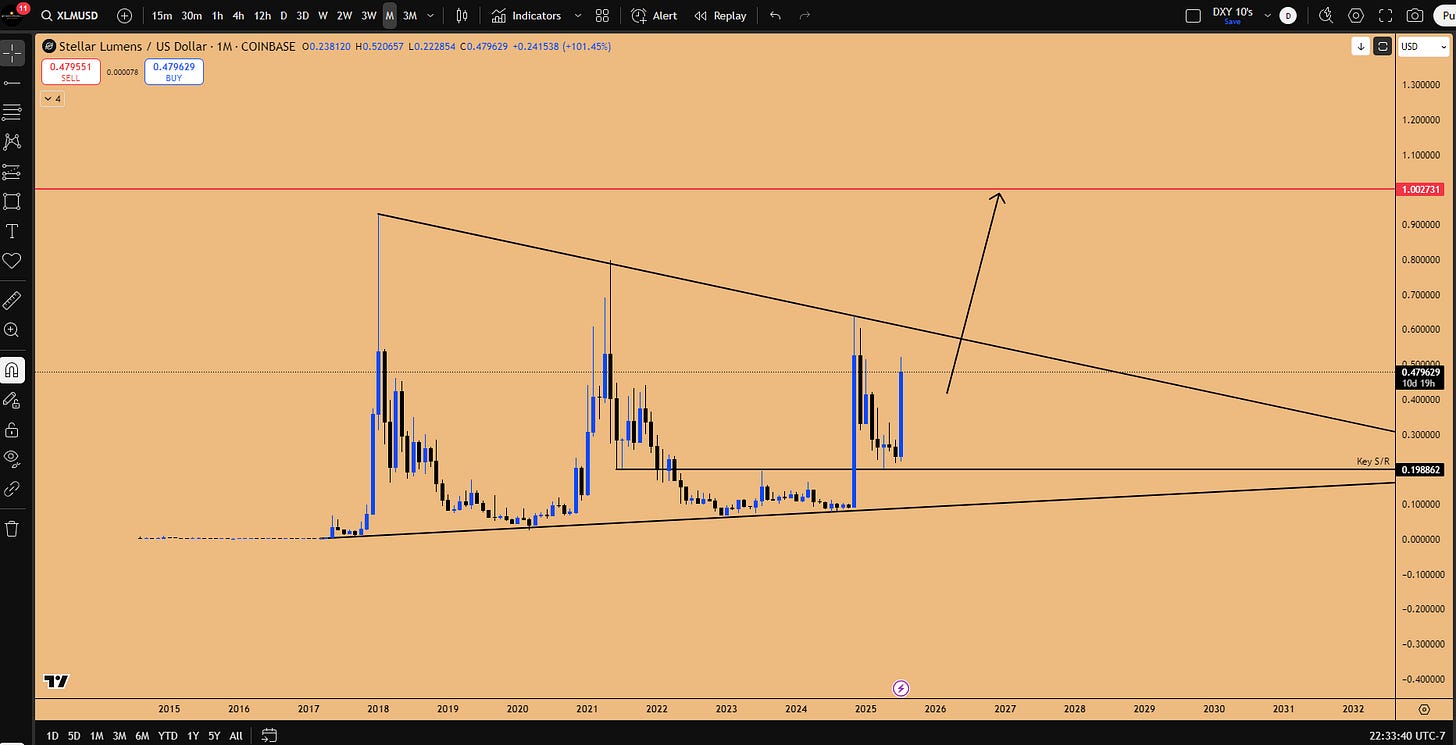
Figure 5: XLMUSD Macro consolidation threatening a breakout
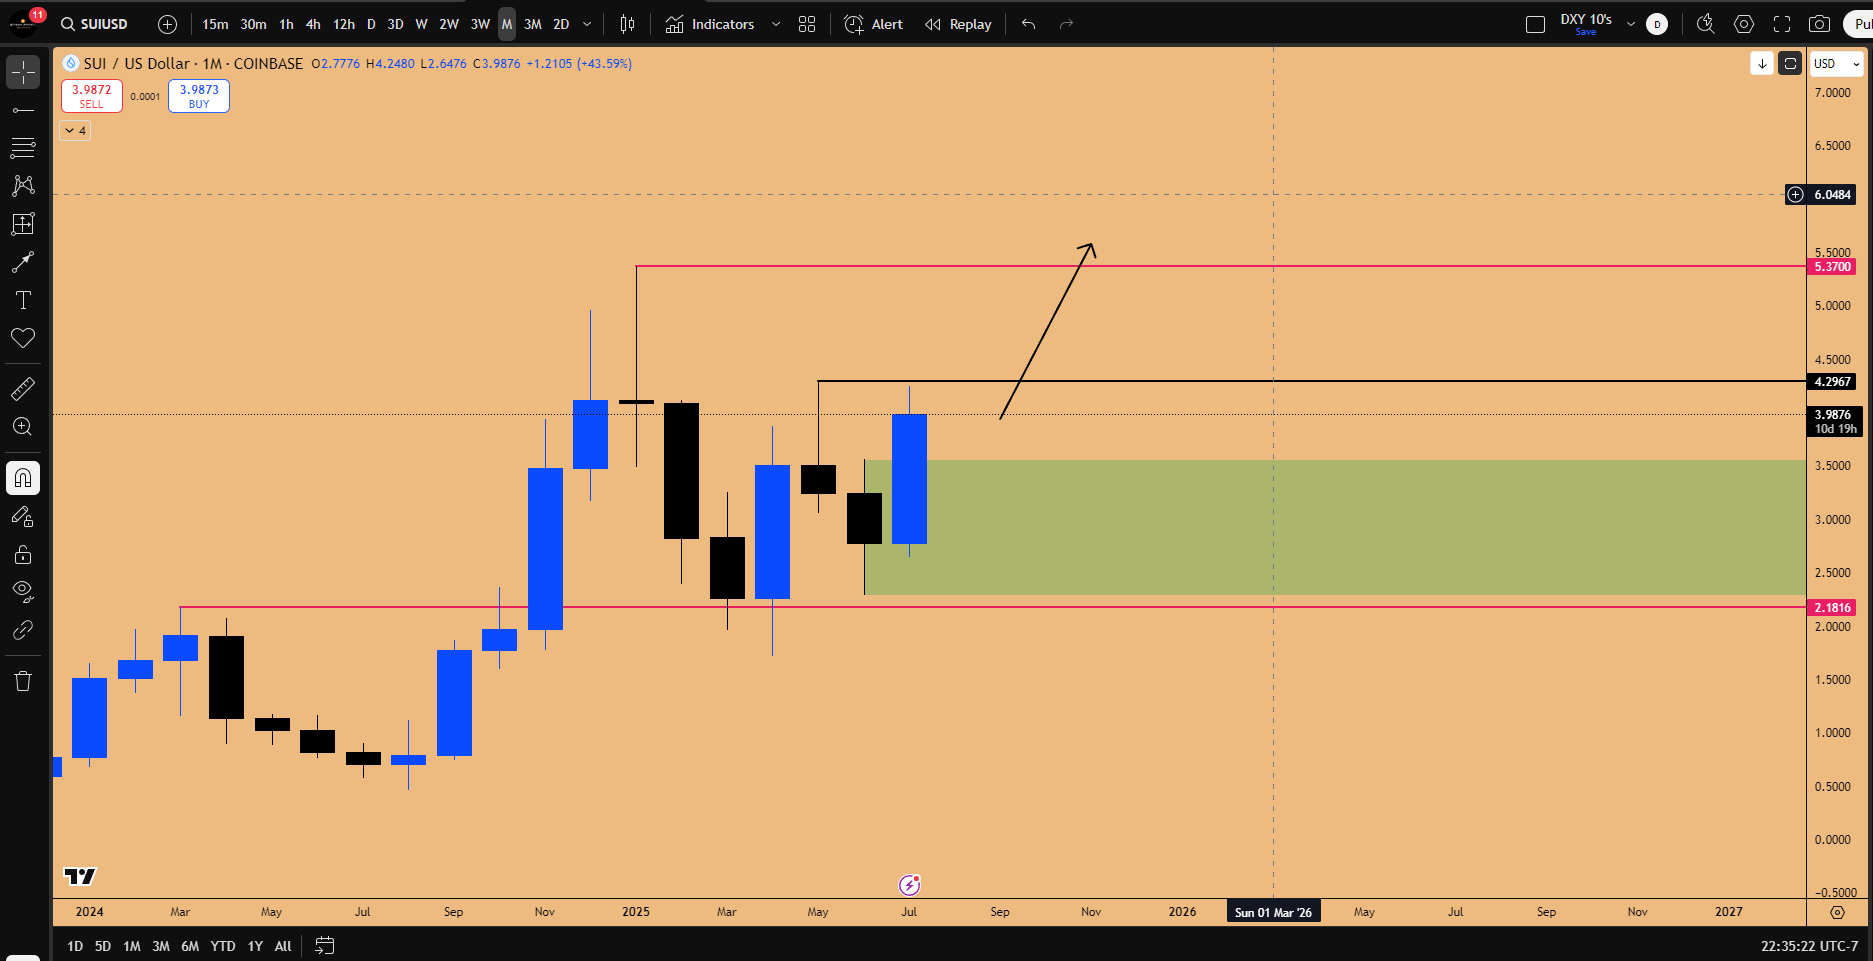
SUI: Poised to reach all-time highs above $4.3, with a bullish order block forming.

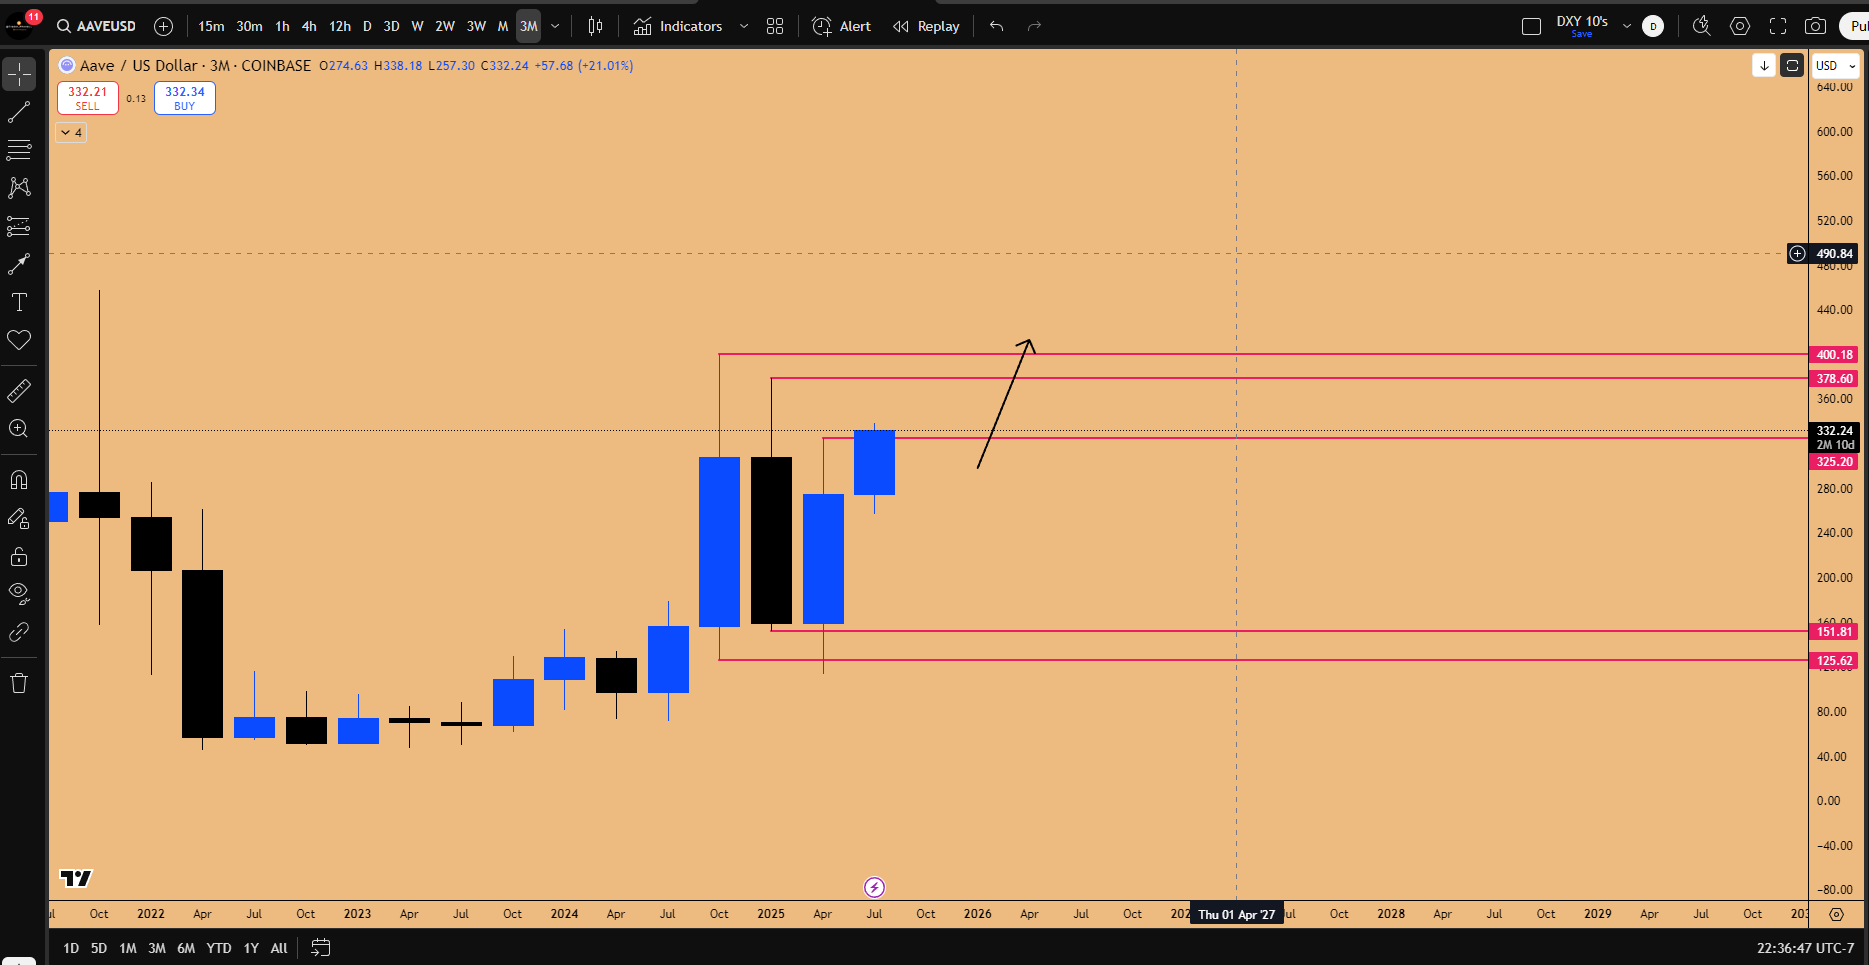
Figure 6: SUIUSD Monthly support zone’s maintaining bullish market structureAAVE: Targeting $400 following a breakout above $325, driven by an inside quarterly candle failure.

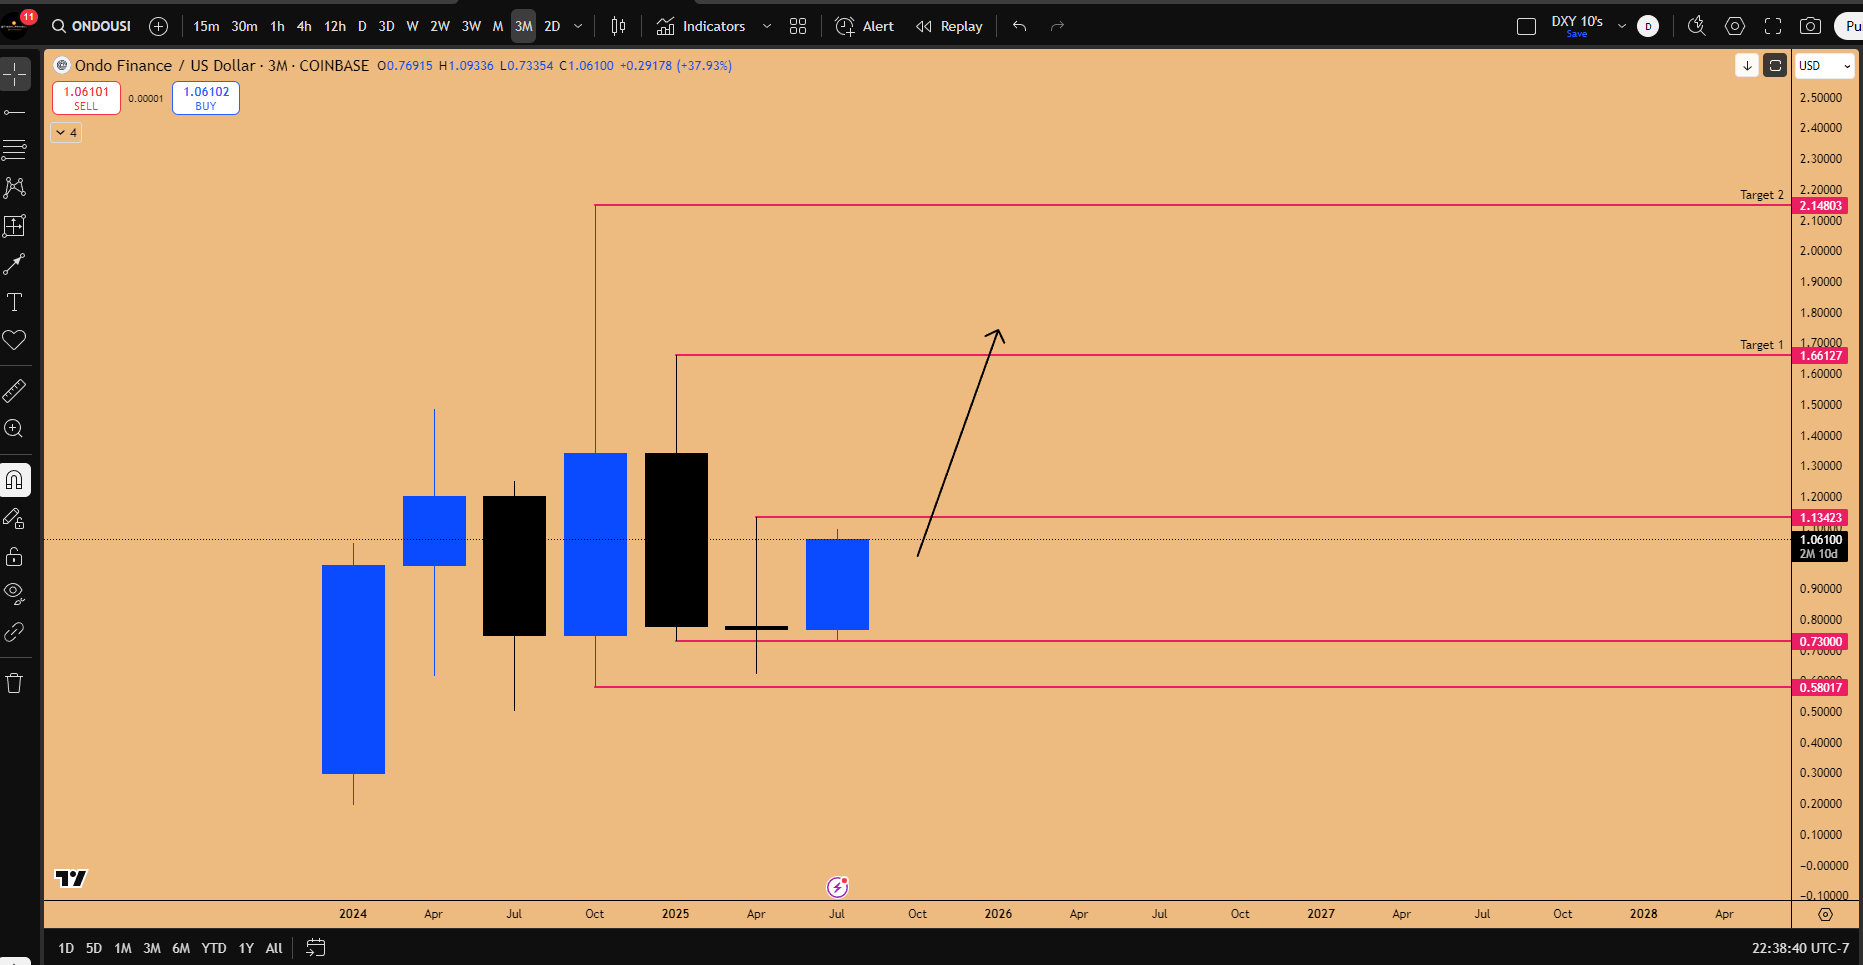
Figure 6: AAVE Inside 3-month candle failure pattern in playONDO: Faces supply inflation risks, reducing its attractiveness despite U.S. operations.

Figure 7: ONDO Inside 3-month candle failure pattern in play
5. Bitcoin Technical Outlook
5.1 Price Action and Support Zones
Bitcoin is currently in a sideways phase, encountering resistance at recent highs. Key support levels include $112,590–$116,090, driven by open futures gaps and inside candle failures on daily and three-day charts. A pullback to $112,590 offers a high-probability long entry with a stop loss below $107,680, targeting higher liquidity pools.
5.2 Strategic Considerations
Bitcoin’s lack of follow-through after breaking market structure suggests a healthy pullback within an uptrend. Long positions at support zones, particularly $111,220–$112,590, are recommended, leveraging bullish order blocks on the two-week chart.
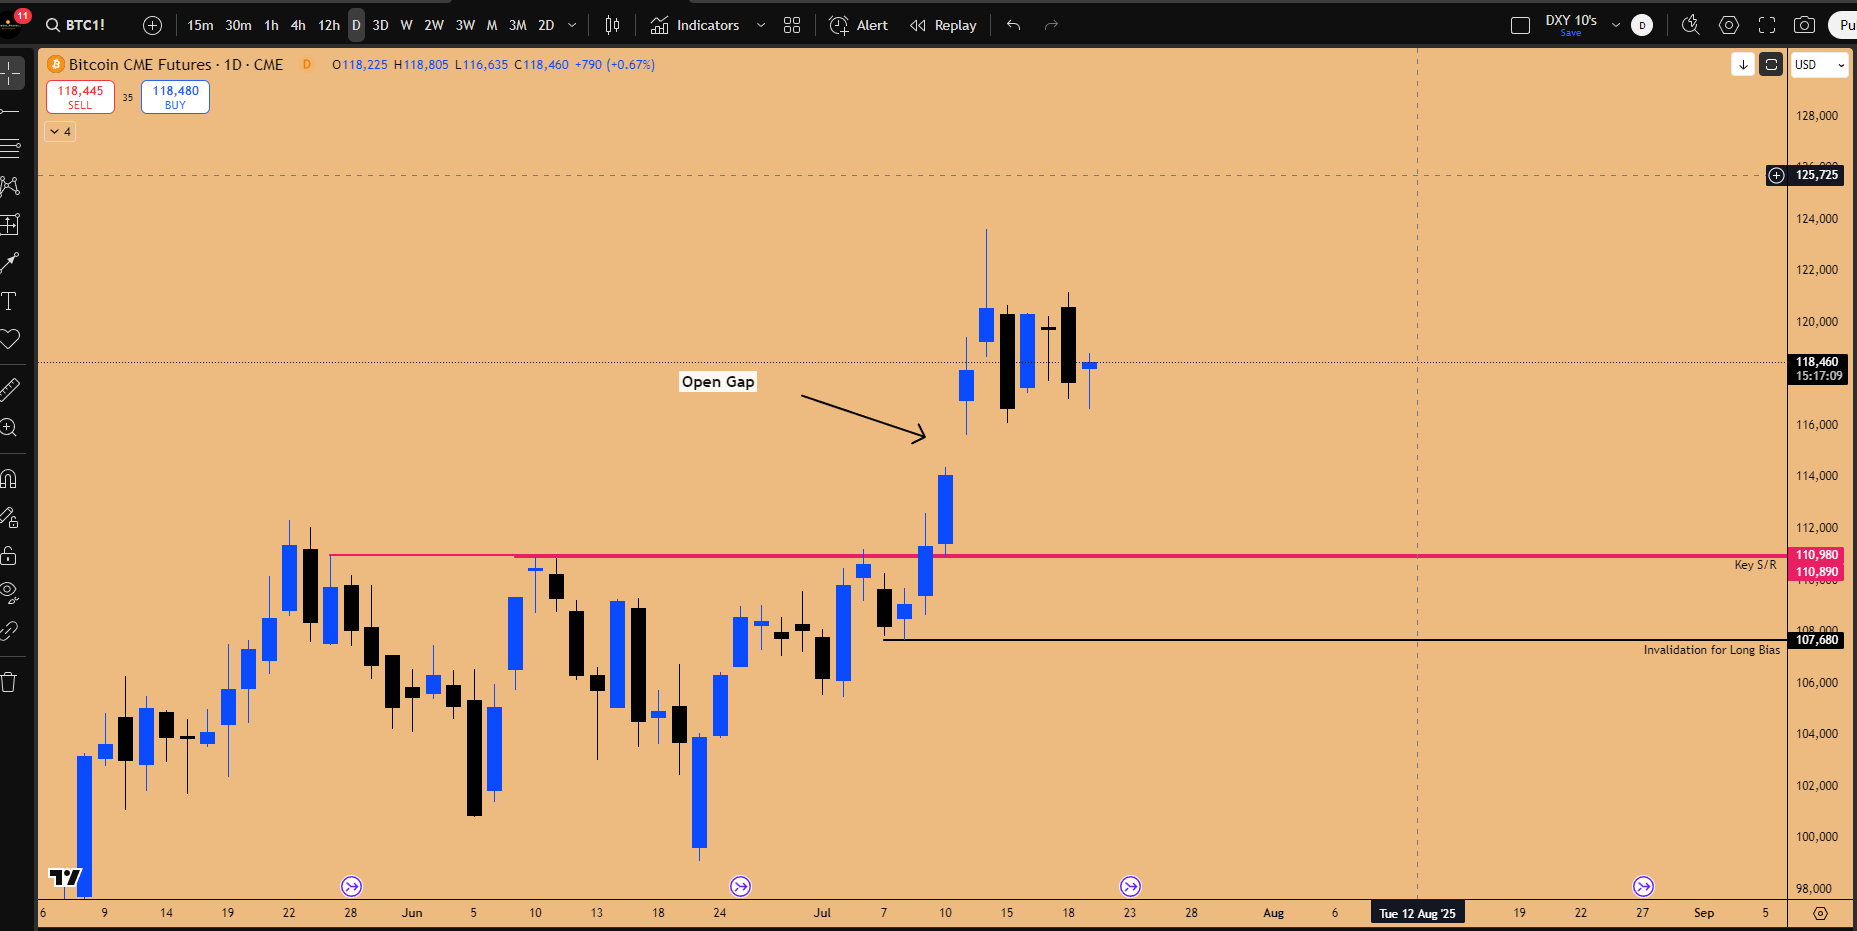
Figure 8: BTCUSD support zones in play
6. U.S. Equity Indices Analysis
6.1 NASDAQ and Dow Jones Technical Setups
NASDAQ: Exhibits a rainbow pattern and inside daily candle failure, supporting a breakout to $23,378 (1.3% upside). The weekly chart shows a bullish order block, with support at $20,758 for future pullbacks.
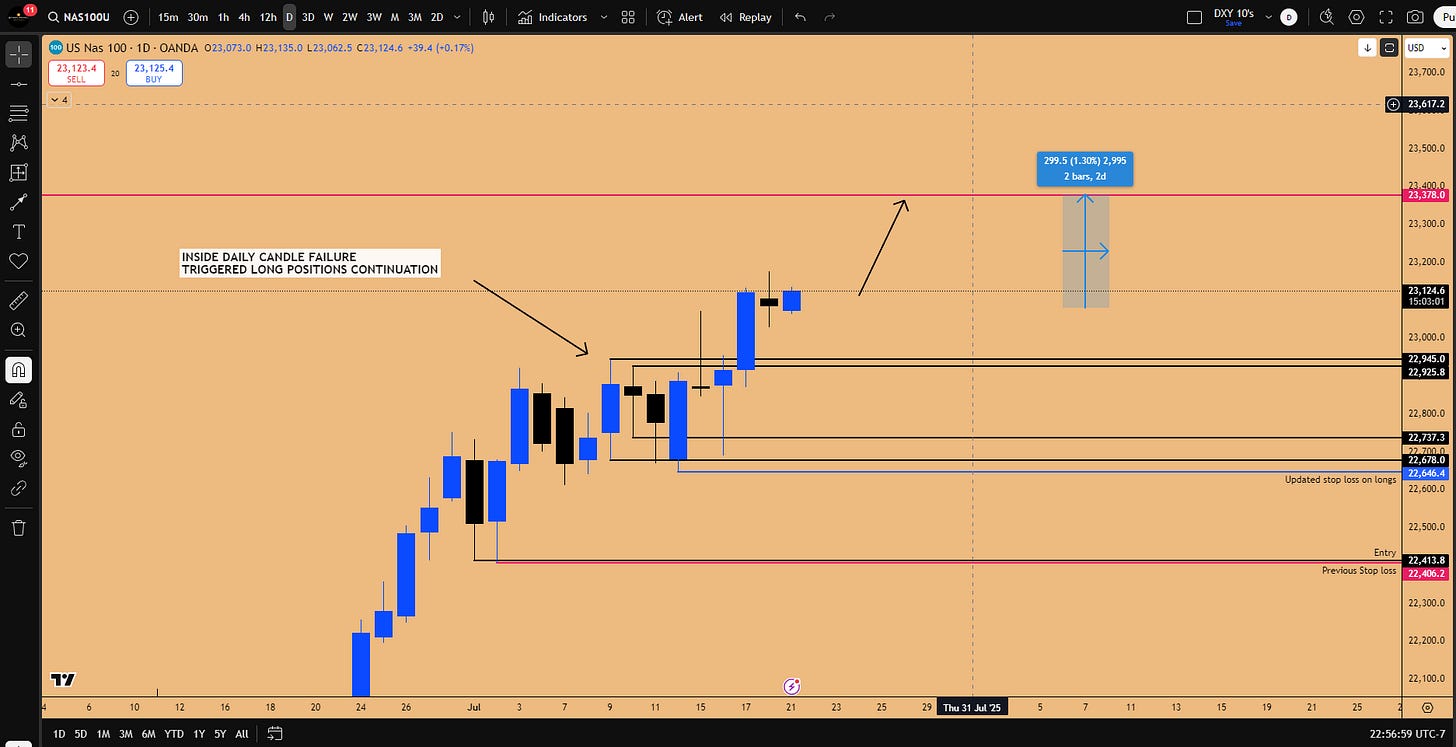
Figure 9: Upside target for this week on NAS100
Dow Jones (US30): An inside weekly candle failure and gap fill at $43,747 signal upside potential to $45,000 . The two-month chart reinforces this with a bullish order block.
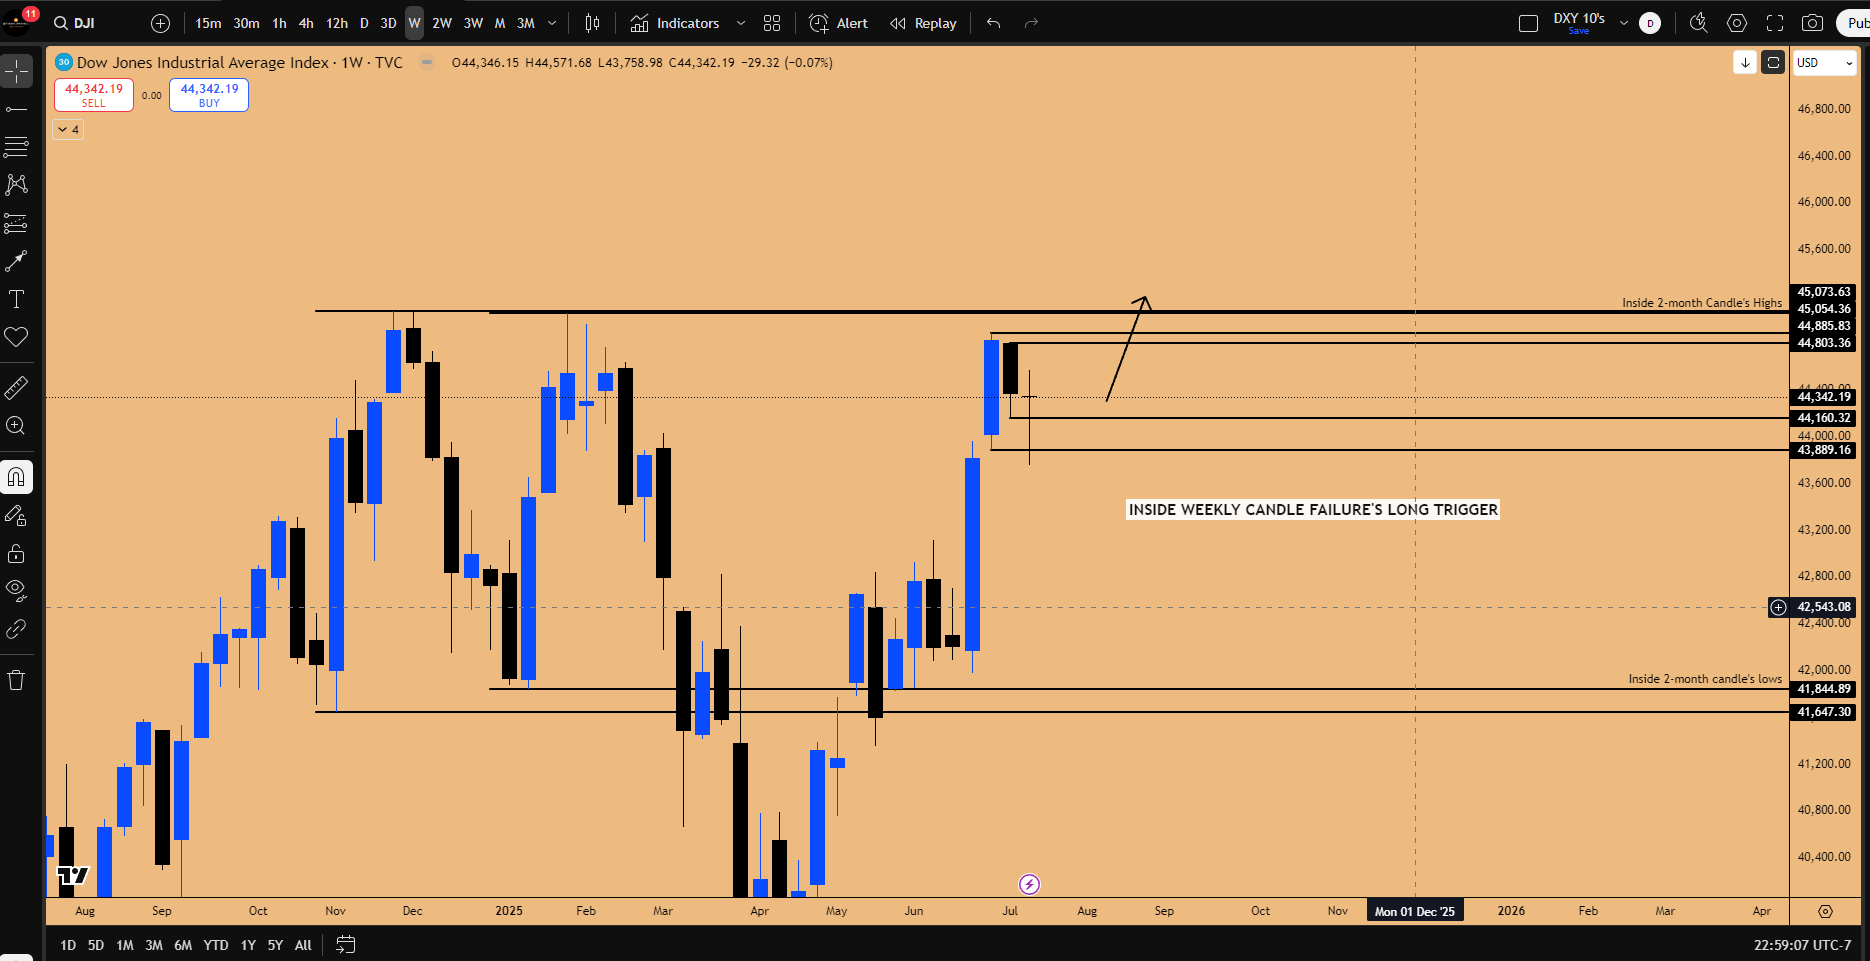
Figure 10: Long setup for DJI/US30 Index
6.2 Earnings Catalysts
Earnings reports from Tesla (July 23), Google (July 23), Microsoft (July 30), Apple (July 31), Amazon (July 31), and Coinbase (July 31) are expected to drive market momentum. Microsoft’s consecutive bullish six-day candles and Coinbase’s alignment with crypto regulatory tailwinds suggest strong performance.
6.3 How Indices and the Market Are Set to Unfold Around Earnings Season
The US indices (particularly NASDAQ, S&P 500, and Dow Jones) are positioned for continued upside expansion during the current earnings season, driven by the anticipated beats from major tech companies amid the AI revenue surge and no immediate downside catalysts.
Main Emphasis is laid out towards money flow skewed to the upside due to technical patterns ( e.g. Inside Weekly Candle Failure in US30) and rainbow patterns (e.g., in NASDAQ) triggering long positions. This strongly indicates capital flows to gravitate upwards without significant pullbacks until the earnings season concludes around July 30-31, 2025.
This is framed as extending the "melt-up phase," where strong earnings prevent slowdowns, with NASDAQ outperforming (e.g., targeting 23,800) due to its tech-heavy composition and higher returns (e.g., 41% vs. US30's 22% from recent bottoms). Capital is expected to flow into indices as earnings confirm accelerating revenues (e.g., from AI investments like xAI's GPU orders boosting NVDA revenue), maintaining risk-on sentiment and preventing idle capital from sitting, similar to Bitcoin's sideways action rotating flows to altcoins.
Important Note : Post-earnings, the market could shift to profit-taking or consolidation, especially after July 31, 2025, coinciding with the FOMC meeting and Trump's August 1, 2025 tariffs going live, potentially prompting traders to buy protection in their portfolios as Indices are set to enter a "seasonally weak period" in August-September.
Research also highlights historical parallels: In 2020, markets pulled back 10-15% in September after summer melt up snapped, leading to consolidation before November upside commenced; in 2021, two-month pullbacks in August-September preceded strong year-end gains; and in 2018, a 7-10% correction set up a 20% run into early 2019.
In our current situation in 2025, we have a very similar setup where seasonally weak period could suggest 7-10% healthy pullbacks in a macro uptrend (e.g., NASDAQ to support at 21,758 or S&P 500 to 6,000). This could serve as a lucrative buying opportunity, with capital reloading for Q4 "melt up" (November-December as strongest months after July), potentially capturing 20-26% gains into February 2026, driven by sustained AI growth rather than monetary policy.
7. AI Revolution and Tech Sector Drivers
7.1 Revenue Growth and NVIDIA’s Role
The AI revolution is a primary driver of tech sector performance, with NVIDIA projecting $150 billion in 2025 revenue, up from $116 billion in 2024. Orders from companies like xAI, scaling to 1 million GPUs, underscore NVIDIA’s dominance. This revenue growth supports NASDAQ’s outperformance, with a 41% return compared to US30’s 22% over the same period.
7.2 xAI’s Competitive Edge
xAI’s Grok 4 model, launched in 2023, rivals OpenAI’s ChatGPT in reasoning and coding capabilities, achieved through significant investment in NVIDIA GPU clusters . This competition drives demand for AI infrastructure, benefiting NVIDIA and tech indices. Read full in-depth report in our publication titled: Navigating Indices, Big-Tech Earnings, AI-Driven Growth and Crypto
8. Other Indices: DAX Outlook
8.1 Technical Setup
The DAX index is poised to fill a flat open gap, with support at $23,760. An inside weekly candle failure suggests a pullback to this level, offering a long entry opportunity with upside potential to new highs, driven by alignment with U.S. index strength.
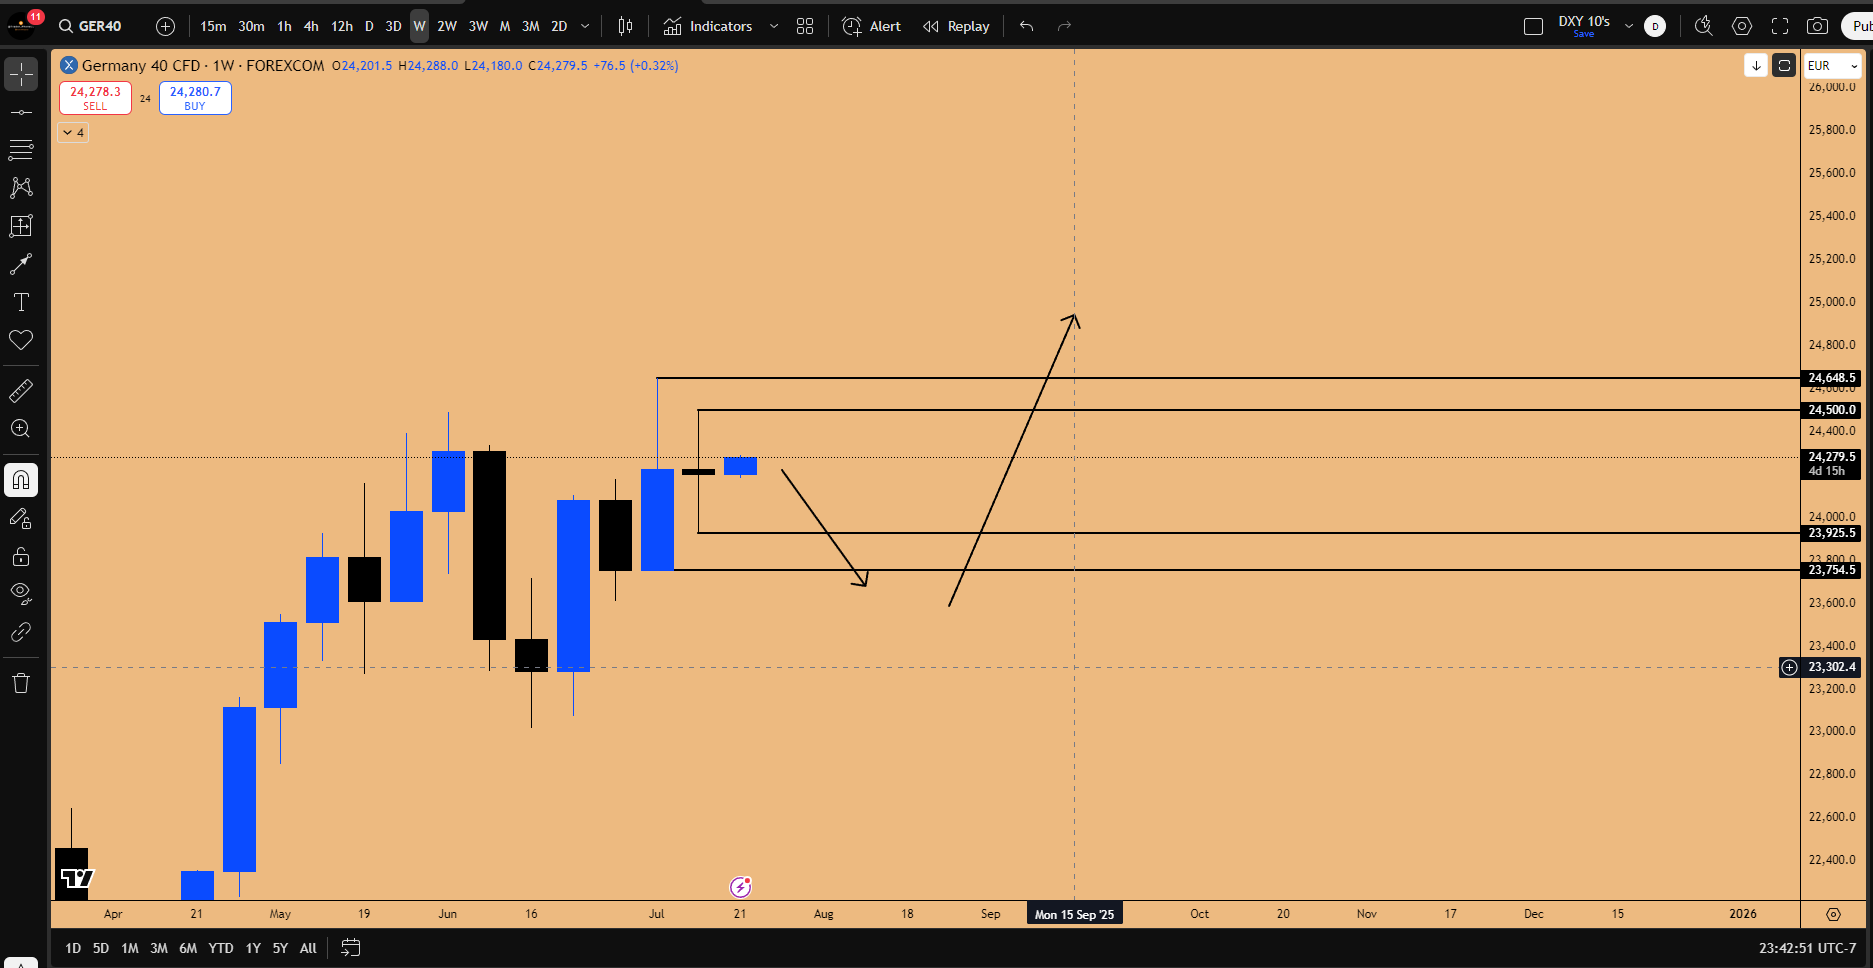
Figure 11: Inside weekly candle pattern on DAX
9. Strategic Recommendations
Ethereum: Hold spot positions for long-term upside to $10,000; re-enter longs at $2620 - $2873pullbacks.
Altcoins: Focus on U.S.-based coins (XLM, XRP, LINK) and World Liberty Financial holdings (SUI, AAVE) for institutional exposure.
Bitcoin: Enter longs at $112,590 with a stop loss below $107,680, targeting further upside
Equities: Hold NASDAQ and US30 longs through July earnings; buy pullbacks in August–September for a Q4 rally.
Conclusion
Ethereum’s breakout, supported by technical patterns and regulatory catalysts, positions it as a leader in the altcoin market, with potential to reach $10,000, once macro breakout is confirmed on Quarterly time frame. Altcoins like LINK, XLM, and SUI offer high-upside opportunities, while Bitcoin remains a tactical play at support levels. U.S. equity indices, particularly NASDAQ, are poised for further gains driven by AI-driven tech revenues and earnings catalysts. Investors should leverage range-based strategies and seasonal patterns to optimize entries and exits, maintaining disciplined risk management to navigate potential volatility.
Note: All price targets and revenue projections require verification through real-time market data and corporate disclosures. For regulatory insights, refer to the All-In Podcast and official U.S. legislative updates. For World Liberty Financial holdings, consult primary sources.