

Financial Markets in July 2025: Navigating Indices, Big-Tech Earnings, AI-Driven Growth and Crypto

Key Insights from a Comprehensive Market Discussion
Publication Date: July 16, 2025
This detailed analysis, based on a recent market discussion, offers market participants an educational exploration of current financial dynamics, positioning strategies, and emerging trends. The report centers on major indices like the S&P 500 and NASDAQ, extending to earnings previews, cryptocurrencies, forex and the transformative role of AI in growth. It highlights technical adjustments, cross-asset implications, and fundamental drivers such as revenue surges in tech, while incorporating demonstrations of AI tools. By weaving in real-time observations and strategic updates, this report provides foundational insights for understanding market interconnections, risk management, and long-term investment themes in a consolidating yet potentially expansive environment.
🔍 Introduction to Market Context
July 2025 presents a pivotal moment in financial markets, with indices reacting to policy announcements and awaiting key earnings catalysts from Big Tech companies, with NFLX set to report earnings post New York market close on July 17th, 2025.
This report draws from an in-depth discussion on active positioning in the S&P 500 and NASDAQ, where unusual White House developments influence volatility, however, the money flow and structure underneath the surface remains Risk-On for major asset classes.
Role of AI in fueling Growth (A case study covered in this report): The launch of the Grok 4 model, created by xAI, is driving major advances in large language models and sending a strong signal to the technology industry: the need for powerful GPU clusters—specialized computer hardware for AI—is greater than ever before. In simple terms, more advanced computing power allows for the creation of better AI systems that can handle more complicated tasks for everyday people and companies. This progress helps eliminate boring and repetitive jobs, which means businesses can cut back on staff numbers, improve their processes, and increase productivity by using AI in all parts of their operations to get better results overall.
Key question: Where do AI companies go to purchase these “Powerful GPU clusters”? Let’s dive into this report to find out how this simple question is driving the entire growth narrative in the Tech sector.
🧠 Educational Segment: Index Positioning and Earnings Strategies
Understanding Positioning Adjustments in Volatile Markets
Positioning in indices requires adaptive strategies to navigate liquidity risks and support zones. For the S&P 500, a long position at 6245 faced near-stop outs before snapping back, prompting a stop-loss move from 6199 to 6185—below a key support zone—for added comfort amid potential attacks on liquidity pools. This illustrates how traders adjust stops to avoid false breakdowns while maintaining exposure.
Key Mechanics:
Liquidity Pools: Areas where stops cluster, often targeted by institutions/market makers for sweeps before reversals.
Support Zones: Price levels where buying pressure emerges, ideal for stop placement to buffer volatility.
Risk Management: Moving stops lower provides breathing room but increases potential loss size, balancing comfort with precision.
This approach fosters curiosity: How do institutional behaviors exploit liquidity, and what metrics determine optimal stop adjustments in real-time?
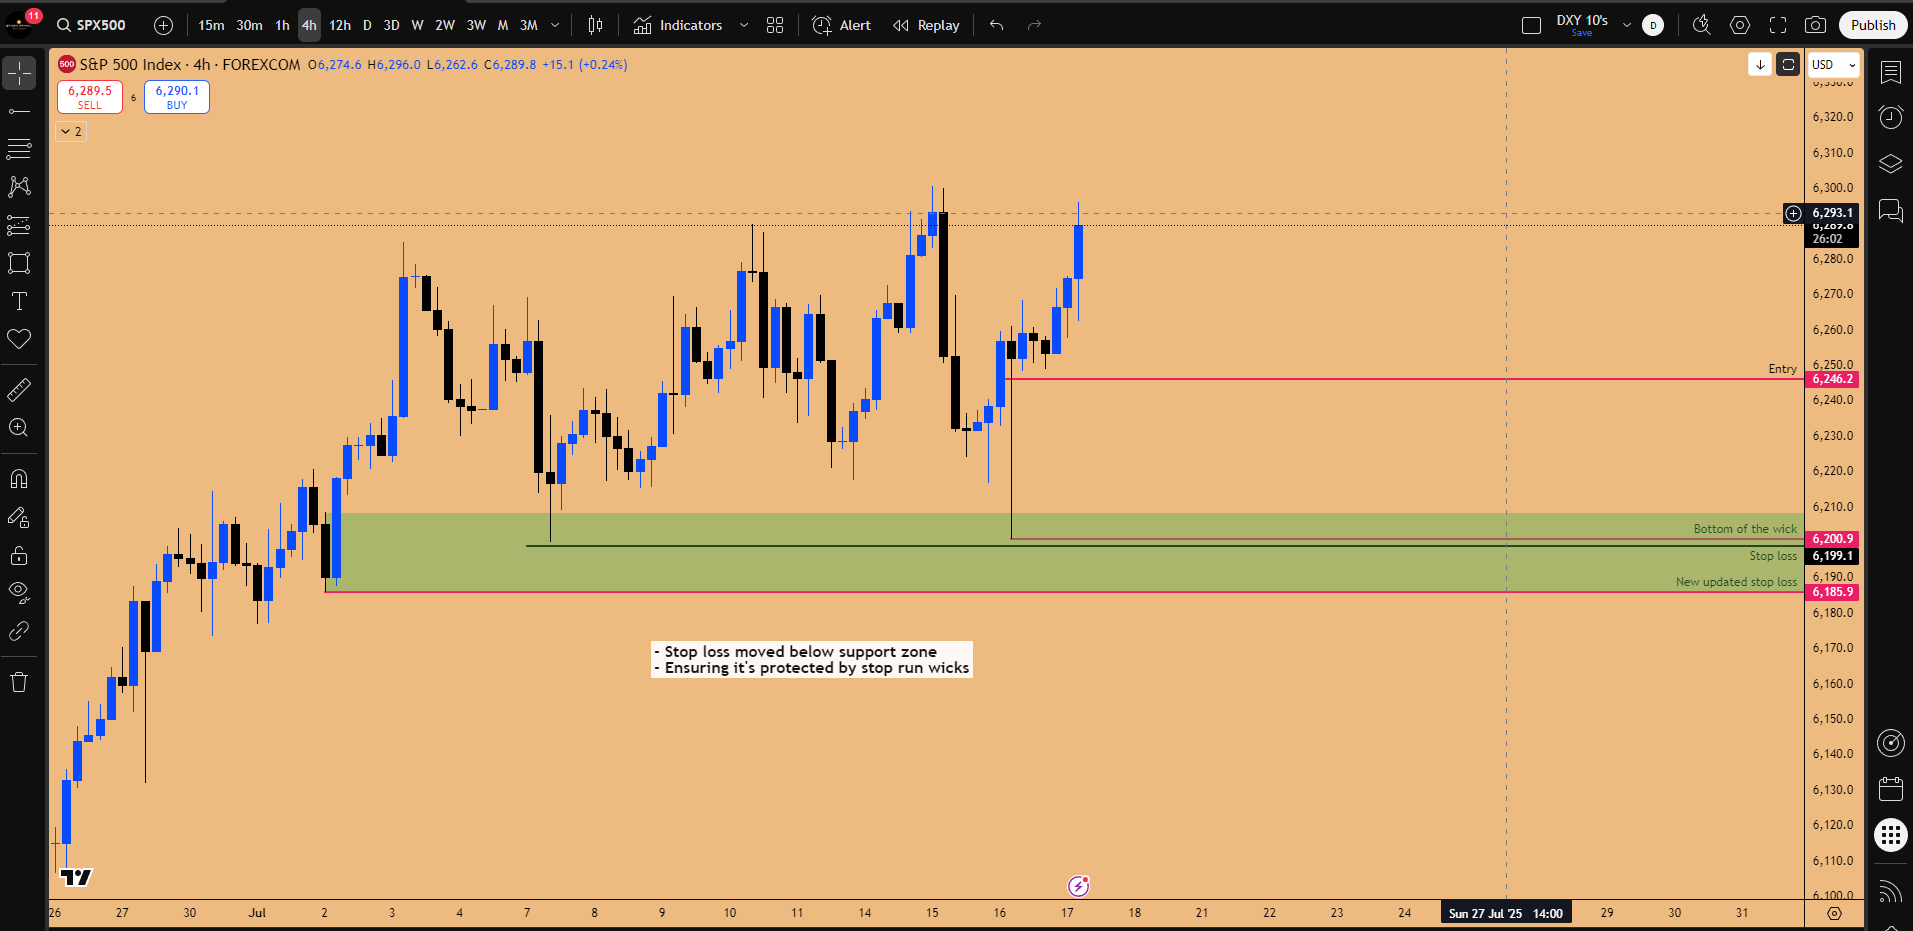
Figure 1: SPX500 long setup. almost suffered a stop out. Stop adjusted to be below support zone
➡️ Applying Strategies to NASDAQ and Earnings Preview
Current NASDAQ Setup:
NASDAQ mirrors the S&P500 with a ceiling at the July 3rd candle high, showing pinning action—consolidation without closes above or below. This sideways behavior builds energy, awaiting expansion from earnings starting tomorrow with Netflix.

Figure 2: NAS100 being pinned down at 22,868 ahead of key earnings catalyst
Netflix as Earnings Bellwether:
Netflix’s pullback into support following a strong quarterly candle close, sets up a bullish pre-earnings tone. Drawdowns from monthly opens often form quarterly lows, with earnings fueling gaps of 5-7% or more (e.g., NFLX has provided 15% and 11% moves during Earnings announcement in the past). As a medium-weighted NASDAQ component, a 15% surge could lift the index by 1-1.5%.
Contextual Detail: Earnings set seasonal tones, with Netflix’s sideways wait at daily support zone highlights the obvious, the market is waiting for earnings event to transpire before expansion could be kickstarted. If Netflix Beats earnings, that will signal a broader bullish momentum signal going into major tech companies reporting earnings next week.

Figure 3: NFLX setup in play
🚀 Growth Drivers: AI Revolution and Surging Tech Revenue
NASDAQ growth stems from Microsoft, Nvidia, Meta—outpacing staples. Nvidia’s parabolic revenue from AI chips (CUDA) fuels data centers for platforms like Grok.
Contextual Detail: Monetary policy takes a back seat when Growth is fueling the economy; geopolitical risks don’t halt surge in revenue coming from AI revolution.
Thoughts to consider: How does AI fueled growth, decouple the major stock indices from monetary policy, and what are the risks in development from this increasing concentration?
⚖️ AI Capabilities and Market Integration
Impact of Grok and xAI on NVDA's Earnings:
xAI raised $5B in debt (secured notes and term loans) and $5B in equity, totaling $10B, led by Morgan Stanley around July 1, 2025, shortly after Grok4 model was launched.
Funds support purchasing NVDA GPU clusters for Grok 5 training and Memphis supercomputer expansion (from 200k+ to 1M Nvidia GPUs).
750k Nvidia Blackwell GPUs for xAI expansion would cost ~$26.25 billion at $35k average per unit.
xAI aims to expand their Memphis Facility GPU cluster to 1 million units by December, 2025. This translates to xAI contributing $26.5 Billion in Revenue for NVDA's earnings by year end, 2025.
Impact of AI Demand on US Tech Sector's Growth:
All the major tech companies which are looking to compete in the rapidly evolving AI sector are heavy buyers of NVDA's GPU clusters.
These companies, namely: AMZN, META, MSFT, GOOGL, ORACLE, PLTR, xAI, Open AI, Core Weave, TSLA and IBM drive billions of dollars worth of demand for GPU clusters by placing massive orders to purchase NVDA's Blackwell GPU architecture.
The high demand for NVDA's Blackwell GPU architecture is the main reason for NVDA's revenue to grow up till 150-200 billion$ annually by 2026. One might argue that this catalyst for surging demand is xAI company showcasing the superiority of Grok 4 AI model, which was developed using 200,000 NVDA Blackwell GPUs. Every AI company which is looking to outcompete xAI will be rushing to level up their AI data centers, in order to receive super compute power to train better and stronger AI models to compete with xAI. This sets up the stage for a classic "Melt Up", which has been in progress since April, 2025.
Why is there a "Melt up"? - NVDA's supremacy in Nasdaq Tech Index is depicted by holding a weightage of 14% in the entire Index. If NVDA's revenue is set to increase by approximately 50% YoY, then the stock is going to continue rallying euphorically into 2026, which will carry the entire Nasdaq Index along with it, given the high weightage for the company in the Index.

Figure 4: Comparing Nasdaq100 Index with NVDA
📈 Broader AI and Market Narratives
Tesla and xAI Integration:
xAI-Tesla potential merger on the horizon
IF this merger happens, pending a shareholder vote, this will turn TSLA into a juggernaut and make it rally to $1000
Grok4 AI Model is already being implemented as a voice assistant in TSLA cars, which is an AI powered edge TSLA’s competitors don’t possess.
Contextual Detail: Double inside quarterly failure pattern prevalent in TSLA; If earnings causes a dip to $270. That would be a lucrative spot buying opportunity for longer term positioning to ride the AI wave.
🌈 Cryptocurrency Analysis: Patterns in Ethereum and Bitcoin
Introducing Resistance and Pullback Dynamics for ETHUSD
Cryptocurrencies exhibit higher-timeframe bullishness but require caution near resistances. Ethereum approaches an “untested” resistance zone between 3300-3500$, which could impede this parabolic ascent from 1382$ lows.
If the market undergoes a pullback from this resistance zone, then lucrative spot buying opportunities can be presented at $2600-$2800, later setting the stage to make a breakout attempt for all-time highs at $5000 going into 2026.
Key Characteristics:
Untested Zones: High caution areas post-drawdowns, avoiding longs into them.
Support Zones: Broken resistances or inside candles (e.g., 12-hour) offer strong entries with tight stops.
Verticality: Straight-line ups followed by pullbacks to form progressive highs/lows.
✨ Current Setups in Ethereum and Bitcoin (July 2025)
Ethereum
Bullish structure from $1300 to $3200 sets rallies to all-time highs, with August pullbacks as buys at $2800/$2600.
Current vertical rally from 2480$ **Rainbow Pattern* trigger could have further leg up till 3500$ test. This is not a market to be “shorted”.
Book profits if you have a position running, this is the area to be locking in gains if you took the long position at 2300-2480$ from two weeks ago.

Figure 5: ETHUSD outlook
Bitcoin
Entering resistance post-10% weekly gain, near-term tops suggest pullbacks to support zone near 112k. If 112k get’s tested, that warrants a long position to be undertaken with stop loss orders below 110K.
Strategic Implications: Any pullback down to 112k is considered healthy market development, longs are heavily favored on support retests, anticipating new higher highs to develop as the melt up continues.
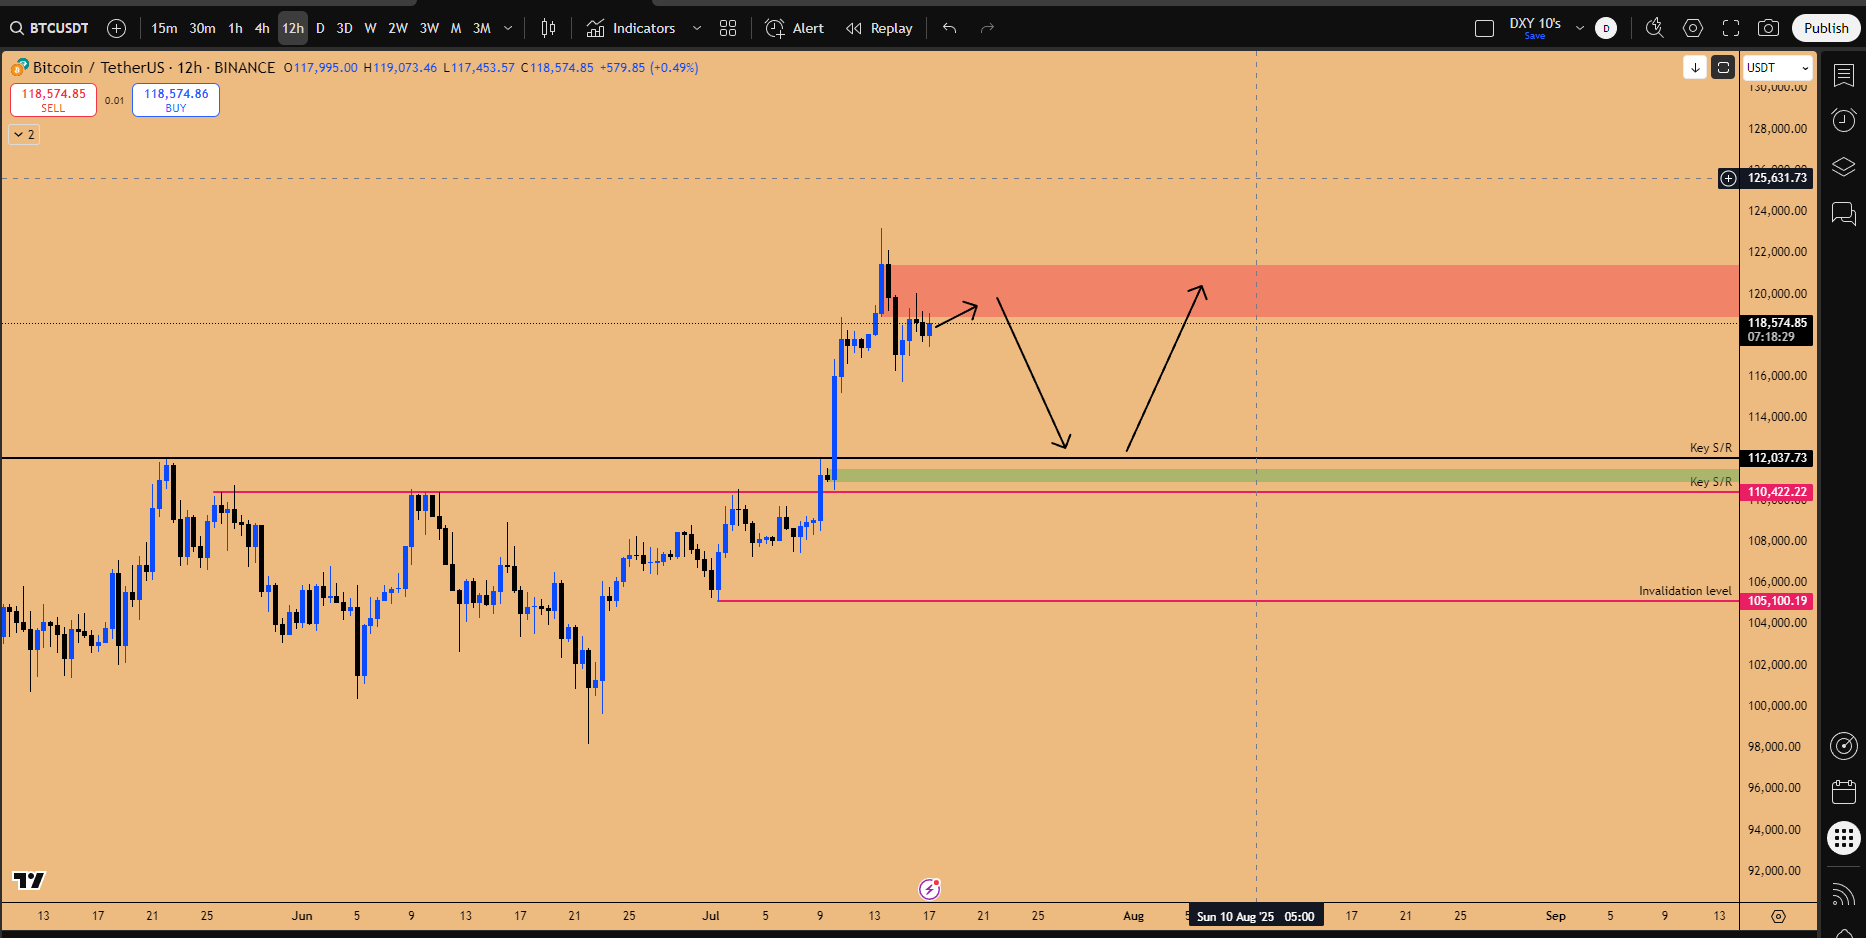
Figure 6: BTCUSD outlook
📊 Cross-Market Analysis and Asset Class Insights
GBPUSD and Dollar Index Correlations
GBPUSD’s close below SR flipped structure bearish—the first higher low break since January 2025. This signals a market structure shift from bullish to bearish on the weekly time frame, suggesting deeper drawdowns will follow in the coming week(s).
Key Mechanics:
Structure Shifts: Breaking higher lows signals reversals, prompting shorts on bounces.
Implications: Dollar Index has likely bottomed, Note: Inside monthly failure (if triggered) looks to target 102-104.
Contextual Detail: Foreign investments in US economy being pulled out to fund security in EU countries, fueled the weakening of the Dollar Index in 1st Half- 2025. A reversal in DXY (US dollar index) suggests Repatriation flow mechanics have reversed, consequently signaling US outperformance on a global level.

Figure 7: GBPUSD outlook, market structure shifted with the breach of Higher Low
🏁 Conclusion and Strategic Recommendations
July 2025’s dynamics favor longs in indices/crypto amid AI growth:
Indices: Adjust stops on SPX500 to 6185, target 6350, target on NASDAQ longs at 23800.
Crypto: Buy ETH/BTC pullbacks, if ETH revisits $2500-2600, potential long term spot buying opportunity
Forex: Short GBP bounces; watch Dollar Index to target higher prices .
Growth: Focus on Nvidia/Microsoft revenue surge; driven by AI GPU cluster demand for building global AI framework.
Speculators Edge is a reader-supported publication. To receive new posts and support my work, consider becoming a free or paid subscriber.
Disclaimer: This report is for informational purposes only and not financial advice. Conduct due diligence and consult a financial advisor before investing. Past performance does not guarantee future results.