

Five Macro Charts to Read Before You Risk Capital In October


Executive Summary
As we approach the final three-month stretch of the year, understanding the macro landscape and refining our trading methodology is critical. This analysis breaks down the essential components of successful trading when to trade, the psychological prerequisites, and the current market environment spanning bonds, equities, and the cryptocurrency ecosystem. The central thesis revolves around the necessity of alignment between the trader, the market environment, and the trade setup. Without this synergy, profitability probability decreases dramatically.
We explore the concept that “trading is going to come all down to when [traders] are ready, not when the market is.” This psychological readiness is paramount; failing to achieve it means even the easiest trades will be mismanaged. Once the trader is ready, the focus shifts to the environment, utilizing the proprietary Six-Week Cycle the price range between Federal Reserve meetings (read more about it here) to hunt for volatility and define tradable ranges. This systematic approach dictates entry timing, favoring predefined zones like the 50% or 75% percentile early in the cycle, rather than chasing breakouts late in the cycle.
The macro analysis reveals a market that is currently risk-on but stalling. Key indicators show a healthy environment: credit spreads are at historical lows, indicating low economic worry; market breadth is healthy; and the VIX is under 20. However, certain dynamics are puzzling. Real yields (currently 1.73%) and the US two-year yield (3.5%) have bizarrely not broken the lows of last September, despite the Federal Reserve being in an active cutting cycle and projecting rates nearer 3-3.2% by December 2026. This presents what is described as a “free money trade” in going long two-year bonds. Inflation expectations remain anchored, with the 10-year breakeven rate at 2.3%, suggesting the Fed is not currently worried. Furthermore, the Financial Condition Index shows liquidity is loosening, a positive sign for risk assets like Bitcoin.
In the crypto sphere, caution is warranted. Stablecoin dominance is dangerously low at 6.4%, a level historically preceding spikes, suggesting money may soon rotate out of riskier altcoins. While liquidity is generally good, the market is characterized as a “low conviction zone.” The drivers and excitement are not currently aligned, leading to a strategy of reduced exposure (less than 10%, closer to 5%) and lower leverage. We are not in “easy mode.” Specific setups include watching Solana for a pullback to the $160-$180 range as its dominance drops from its recent high of 3.4%, Ethereum at $3,800, and managing a current Bitcoin long position entered at $112,000 (stop loss $107,000), looking to add above $116,000.
Key Takeaways from this Analysis:
Psychological Edge is Primary: If the trader is not ready, the setup and environment are irrelevant.
The Six-Week Cycle Dictates Timing: Hunt volatility early in the cycle and avoid entries late in the cycle as the Fed meeting approaches.
Macro Environment is Healthy but Stalling: Risk-on conditions prevail (low credit spreads), but yields are resisting the downward break they should be taking.
Crypto Caution Advised: Low stablecoin dominance (6.4%) suggests potential rotation out of altcoins; the market is currently in a “low conviction zone.”
Exposure Management: Current strategy involves significantly reduced exposure (5-10%) due to the lack of strong market drivers.

The Three Cycles of Profitable Trading
A common pitfall for traders is entering the market based solely on a perceived setup, a macro theme unfolding, or simply feeling ready to deploy capital based on a directional bias (e.g., thinking gold can go higher). This approach is why there is such a low rate of successful traders. This low success rate, however, opens up a huge opportunity for those who do not trade that way. To outperform the market, a structured, three-pronged approach is required, prioritizing the trader’s readiness before assessing the environment and the setup.
The Crucial First Step: Trader Readiness and Psychology
The first and most critical realization is that the trader needs to be ready, or the investor. “If you are not ready to trade, you will mess up even the easiest trade.” This leads to mismanaged risk, getting out too early, and experiencing stress every week.
Conversely, if you are ready to trade, the direction the trade takes becomes less critical. You transform into a “super trader” who has the best risk management, dives in and out of bad situations, and holds on to winners longer.
Understanding your readiness requires introspection and utilizing psychological tools discussed extensively since November, focusing on:
Psychology
Edge
Engrams
Understanding emotions
Reappraisal
If you are not ready to trade, the imperative is to focus on getting yourself ready. “Do not worry about what the market is doing because you are not going to catch it anyway.” Recognizing this and having that maturity gets you one step closer to where you need to be. If a trader cannot overcome the hurdle of understanding their own readiness, there is no point in learning new, more complex strategies. You need to get over that block by understanding your own environment and your own cycle as a human.
This principle applies universally, whether you started six months ago or have been in the markets for 10 years plus. Many experienced traders still do not understand that “trading is going to come all down to when they are ready, not when the market is.” Learn more here.
Navigating Volatility: The Six-Week Cycle
Once the trader is sorted, the second step is assessing the market environment. Is it ready to trade or not? This is where the Six-Week Cycle becomes invaluable. The strategy focuses exclusively on hunting for volatility, and the six-week cycle defines where we are in that hunt.
The six-week cycle is essentially the price range created between each Federal Reserve meeting. This period creates a tradable range for us to accumulate, close out trades, and reaccumulate.
Key Mechanics of the Six-Week Cycle:
End of Cycle Dynamics: Once we get closer to the end of that cycle, we are unlikely to see any massive expansions. You are more likely to see more profit-taking and a slower market environment. The strategy advises staying out the last week or the week before the Fed meeting to get ready for the new one.
Entry Timing: If a great trade idea emerges late in the cycle, entry is generally avoided. For instance, if Gold was rallying late in the cycle and looking like it was about to break out, this is not the time to enter.
Predefined Zones: Entries are taken systematically at predefined zones, typically the 50% or even 75% percentile. In the Gold example, buying at the 50% percentile earlier in the cycle would have allowed the trader to make a “killing” as it went up from there. This systematic approach helps understand how volatility evolves over time in the market.
While volatility inputs can vary (e.g., start of a quarter, start of a month), this framework defines volatility for position trading.
The Execution Edge: Setups and Synergy
The third pillar is having a concrete reason to trade. This requires:
A specific setup.
A directional plan.
Defined risk parameters.
This is where specific strategies come into effect, such as the London Fix, an inside bar pattern, or an unfolding macro trade (like the current situation in Gold). This is when you want to express that trade idea, and that is when you are more likely to turn a profitable trade.
Executing the trade idea at this stage increases the likelihood of profitability because the groundwork has been laid. If the trade is a bit slower to take off, management is better because you are ready as a trader, you picked the right environment (which is more likely to make you succeed), and you actually have a setup with an edge ready to get executed.
The Power of Alignment:
There are a lot of things going into play before you can actually pull off a trade. If you miss any of those steps, the profitability probability decreases dramatically. They actually cancel each other out.
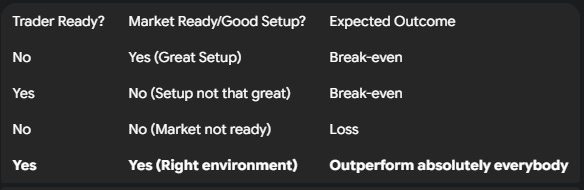
This is the space traders must strive to enter. It requires patience waiting days, weeks, or even a month until everything lines up. “That is the beauty of trading. You are not forced. Nobody is dragging you out of bed and saying you have to trade today.” The more you wait for things to line up, the more they actually start to line up.
Macro Landscape: Bonds, Yields, and Liquidity
To understand the current market environment as we enter Q4 2025, we must analyze the landscape from the bond market, yields, inflation, and liquidity, tracing the risk curve out to the altcoin market and cryptocurrencies.
Analyzing Spreads and Real Yields
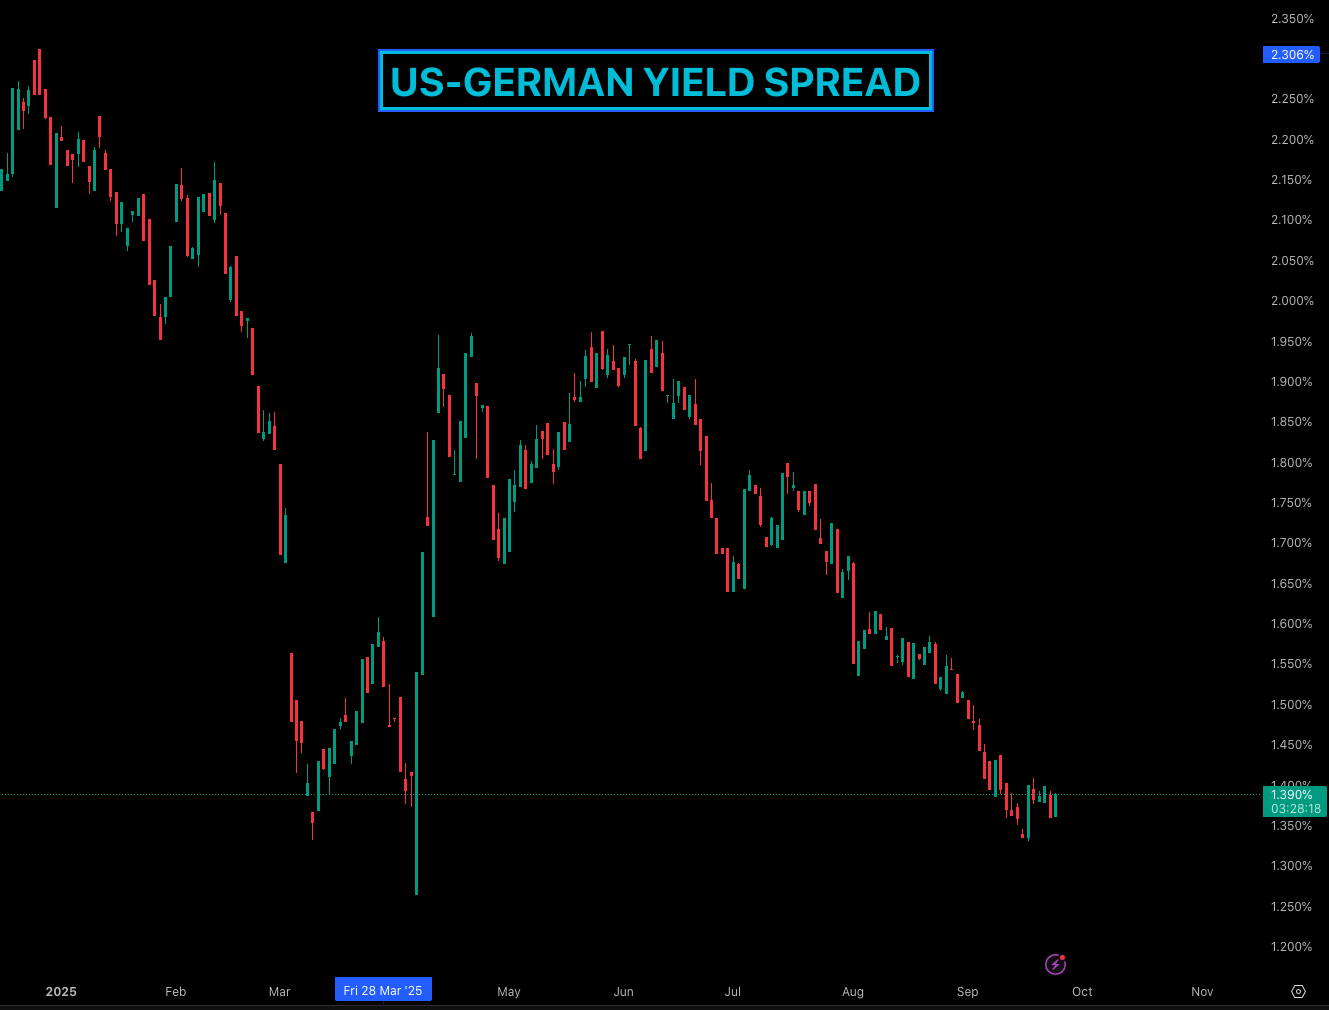
The bond market often serves as a directional indicator for currencies.1 One key metric is the spread between yields from different countries. For example, the 10-year bond yield in the US minus the 10-year bund yield from Germany provides a directional call on where EURUSD is trading.
“It is almost like a magic crystal ball that kind of tells you where currency is headed.” As this spread has been going down (contracting), the US dollar has been trending down with it. Currently, this indicator is stalling, offering no immediate directional information.
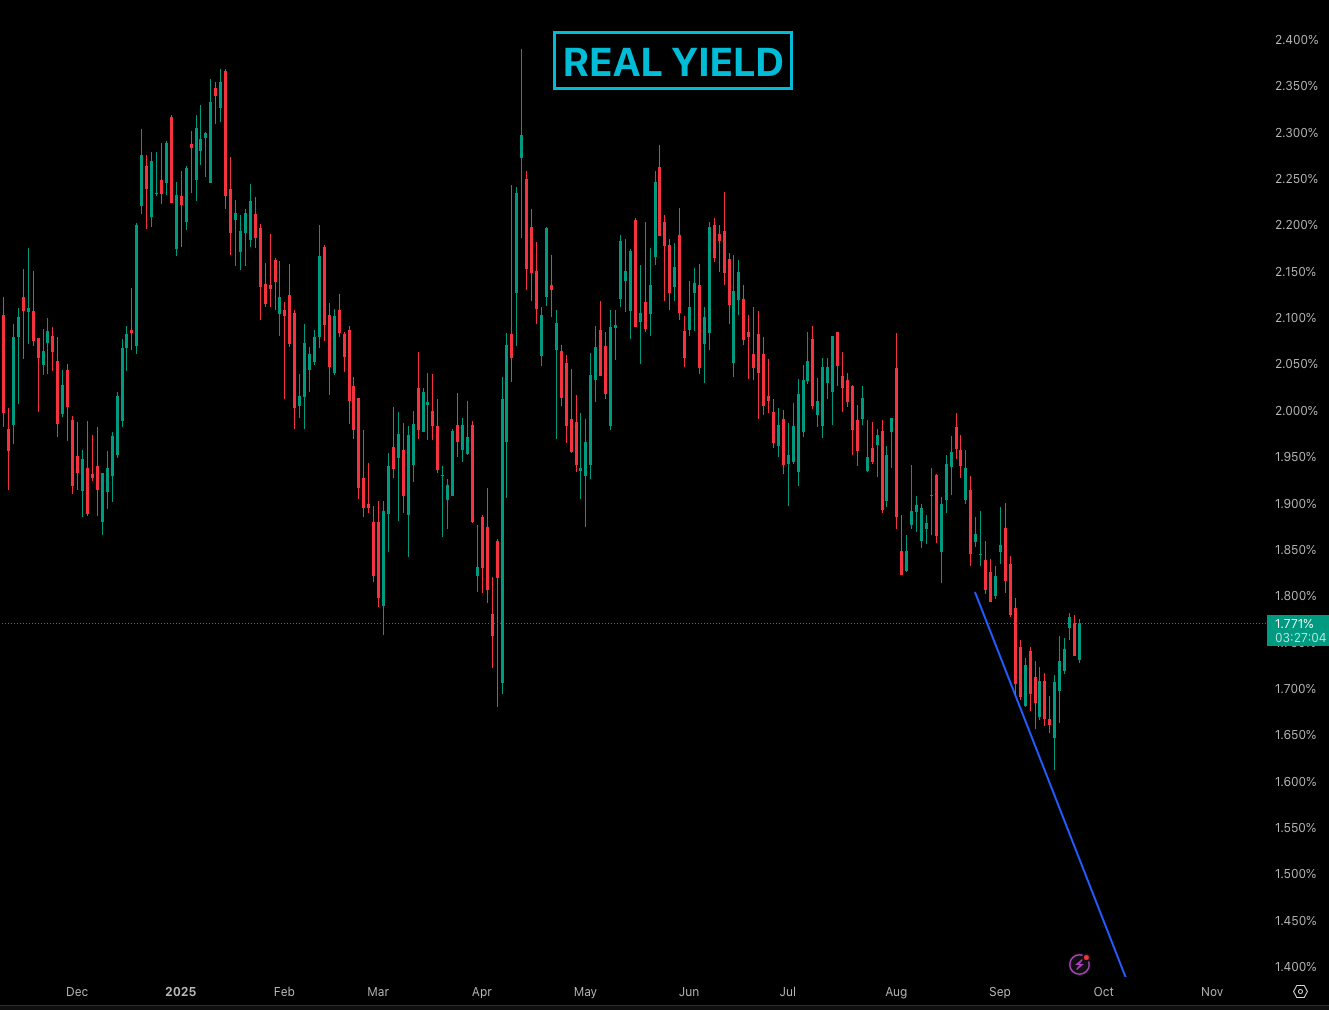
Another critical long-term chart is the Real Yield the yield investors get once you strip away the inflation component.2
Current Level: 1.73%.
Outlook: Expected to go down over time.
Dynamics: When you have lower real yields and a higher stock market, nine out of ten times, the dollar will come down with it. However, the real yield is currently pushing back, creating a rejection zone.
Historical Context: It is revisiting the zone established around this time last year when the Federal Reserve cut 50 basis points. It is currently struggling to break down below this level, but the understanding is that it eventually will.
Market Health Check: Breadth, Credit Spreads, and VIX
Several indicators point to a generally healthy, risk-on market environment.
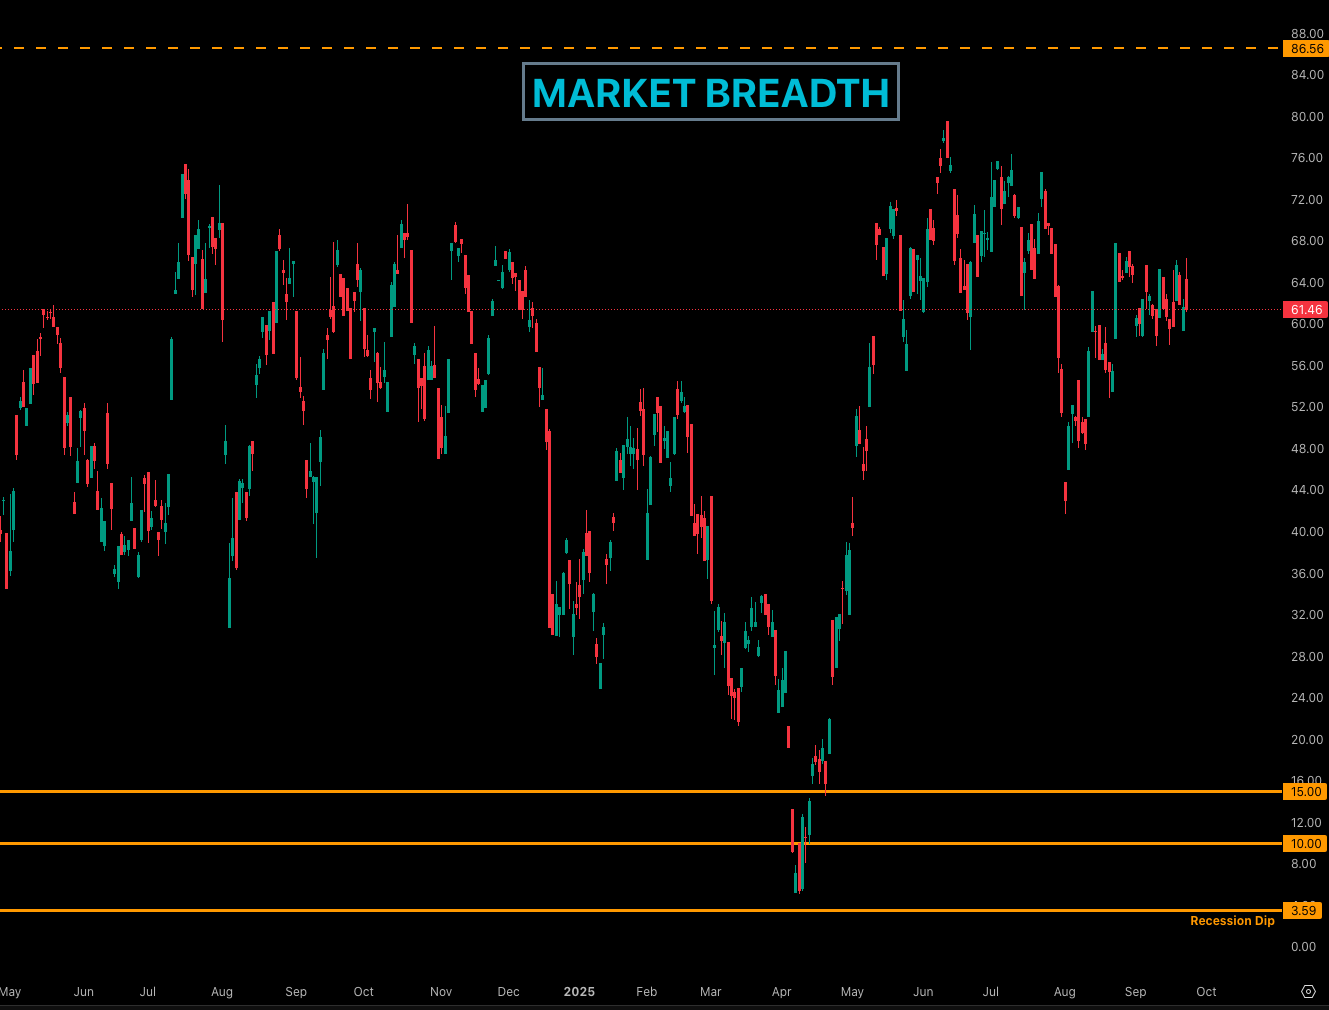
Market Breadth: The percentage of stocks above the 50-day moving average is still fairly healthy. Historical analysis (from December last year) indicates that whenever this metric hits the 15 or 10 level, it signals a recessionary dip and an extreme buying zone for indices. This worked well during the tariff-induced fears. These opportunities are rare “you do not really get them a lot, but when you do get them, they are your money makers.” 3
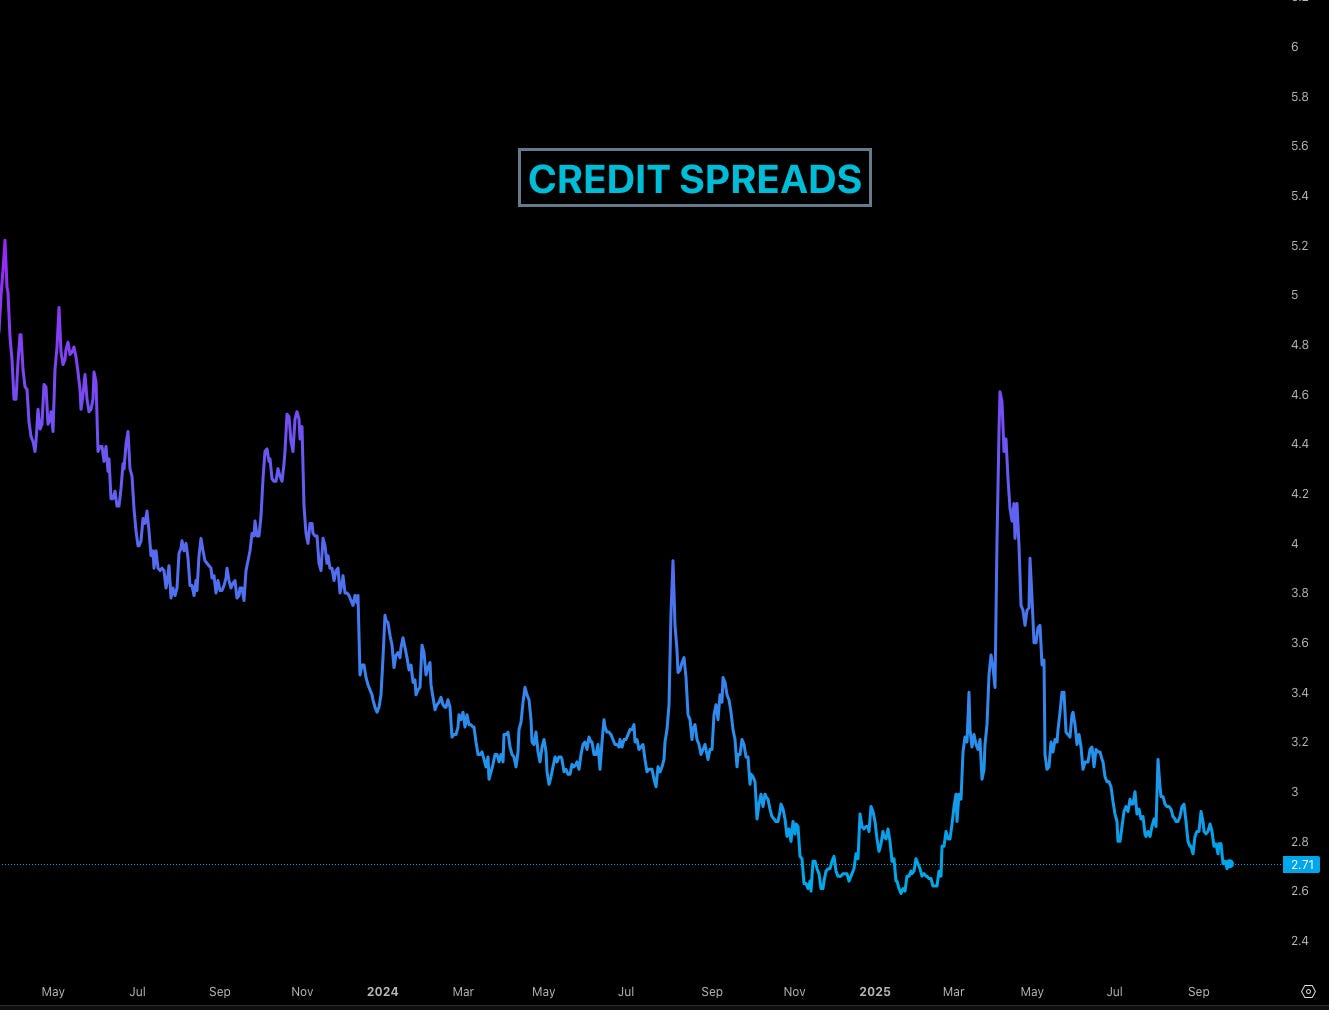
Credit Spreads: This measures the difference between the yield you get from government bonds and private corporate bonds.4
Contraction (Chart goes lower): Indicates the health of the economy and the risk is good.
Expansion (Chart spikes up): Indicates the market is worried. Spikes are often used as opportunities to enter dips on Bitcoin or indices.4
Current Status: The chart indicates that “nobody is worried.” Everybody is getting paid to just hold positions long. We are at quite historical lows, and spreads can remain there for quite some time. The market seems healthy, with nothing worrying at this stage.
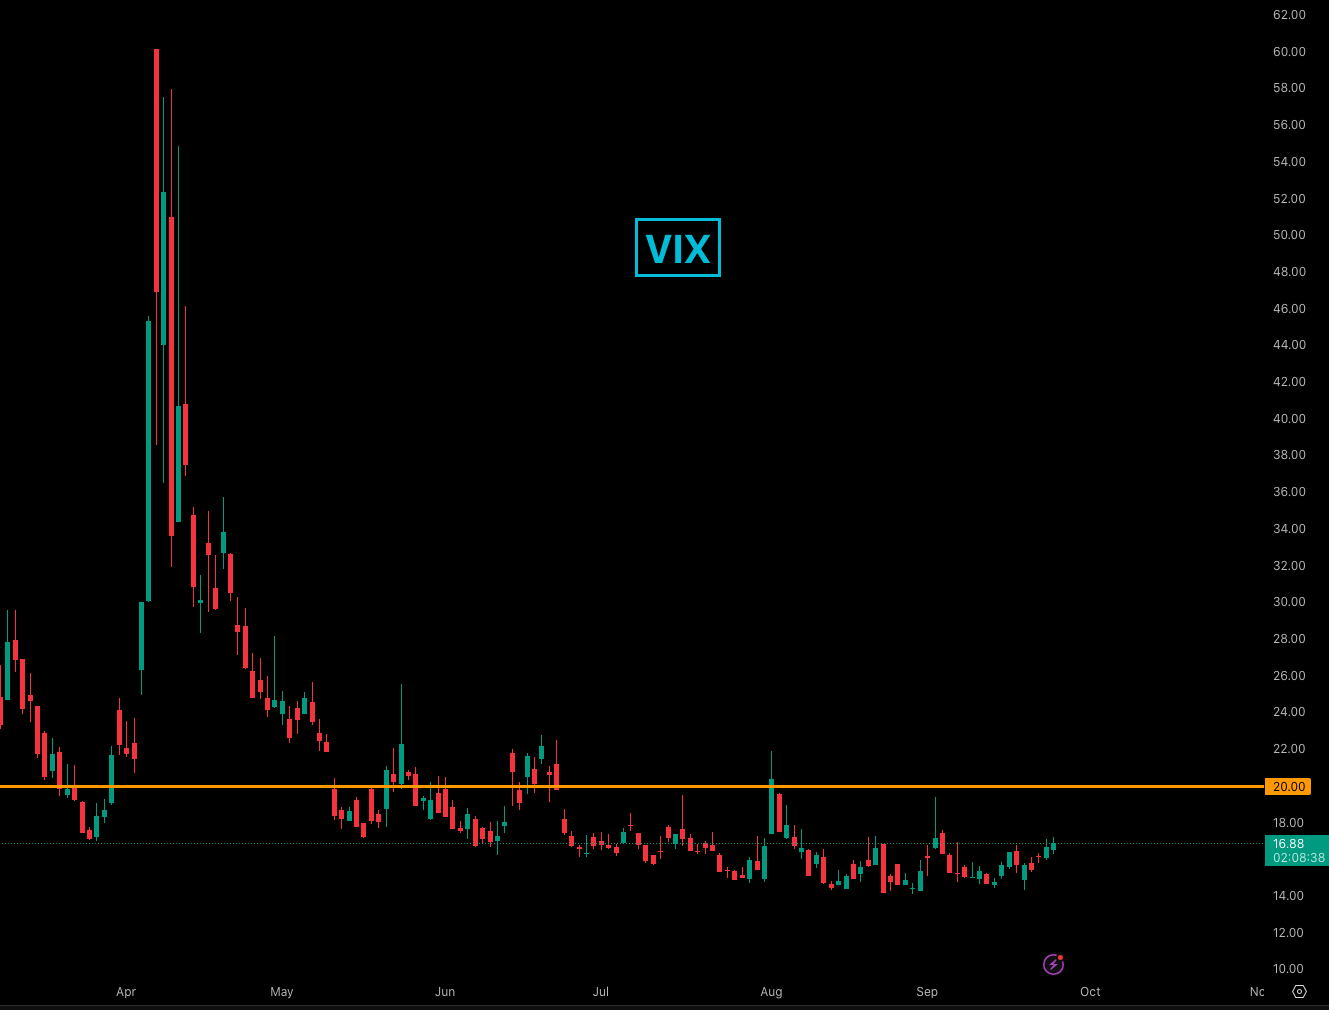
Volatility (VIX): The volatility index for the S&P 500 is trading under 20, which usually signifies calm in the market.5 However, historically, every time it tries to get under the 14-15 level, it kicks out. We are currently a few points above that; approaching this level might signal opportunities for intraday plays on the S&P 500.
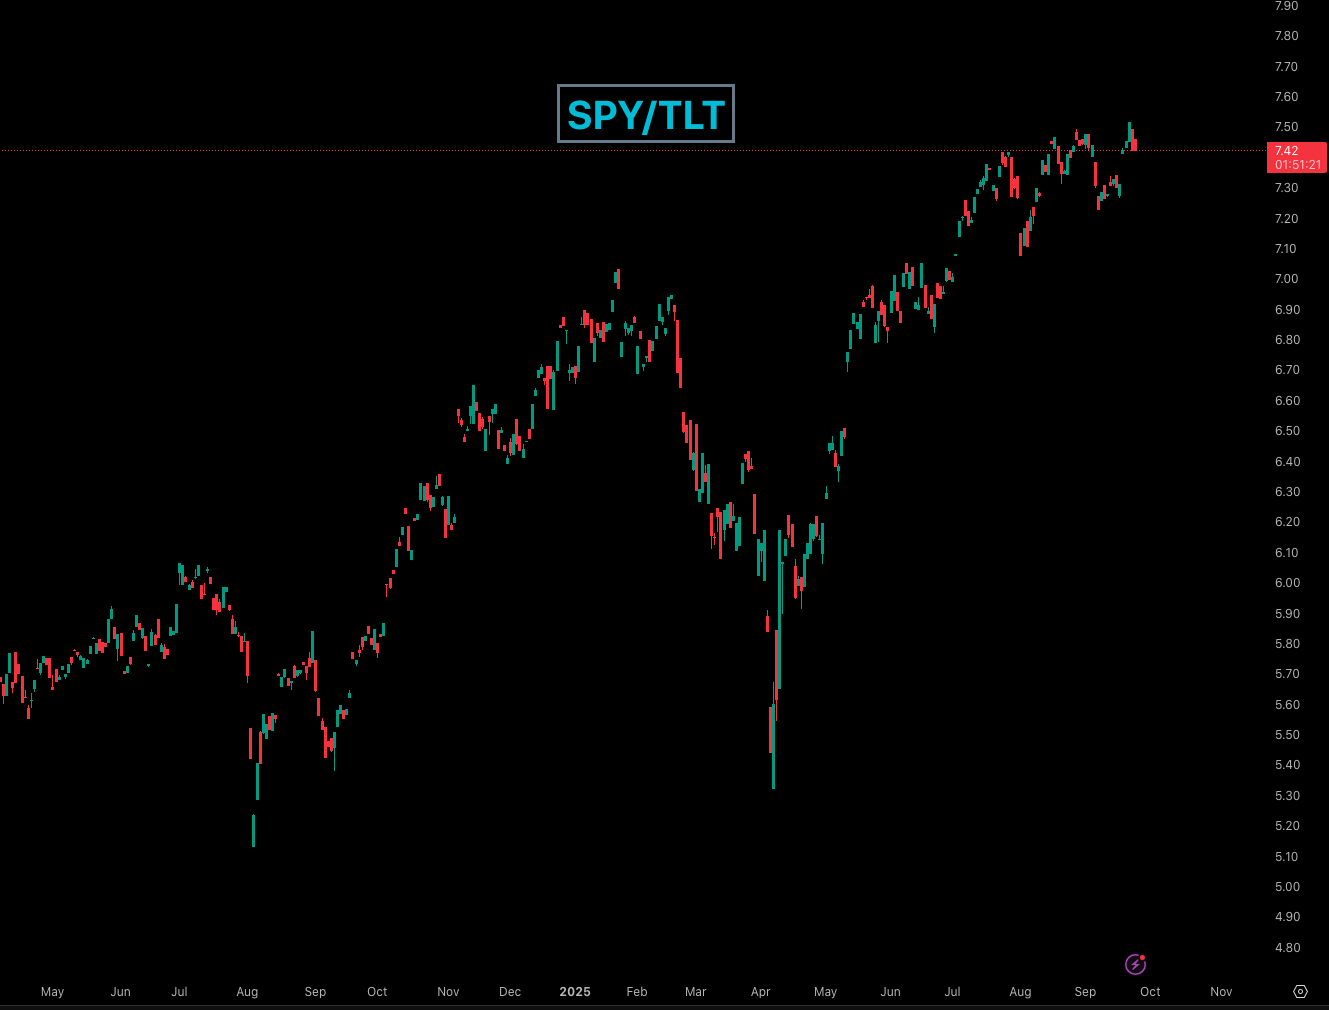
Furthermore, the ratio of the S&P 500 over bonds, which tracks money flow preference, shows that since July, the money put into stocks and bonds has been somewhat split. While no side is clearly winning, the market remains clearly risk-on and is doing nothing wrong.
The “Free Money” Trade and Inflation Outlook
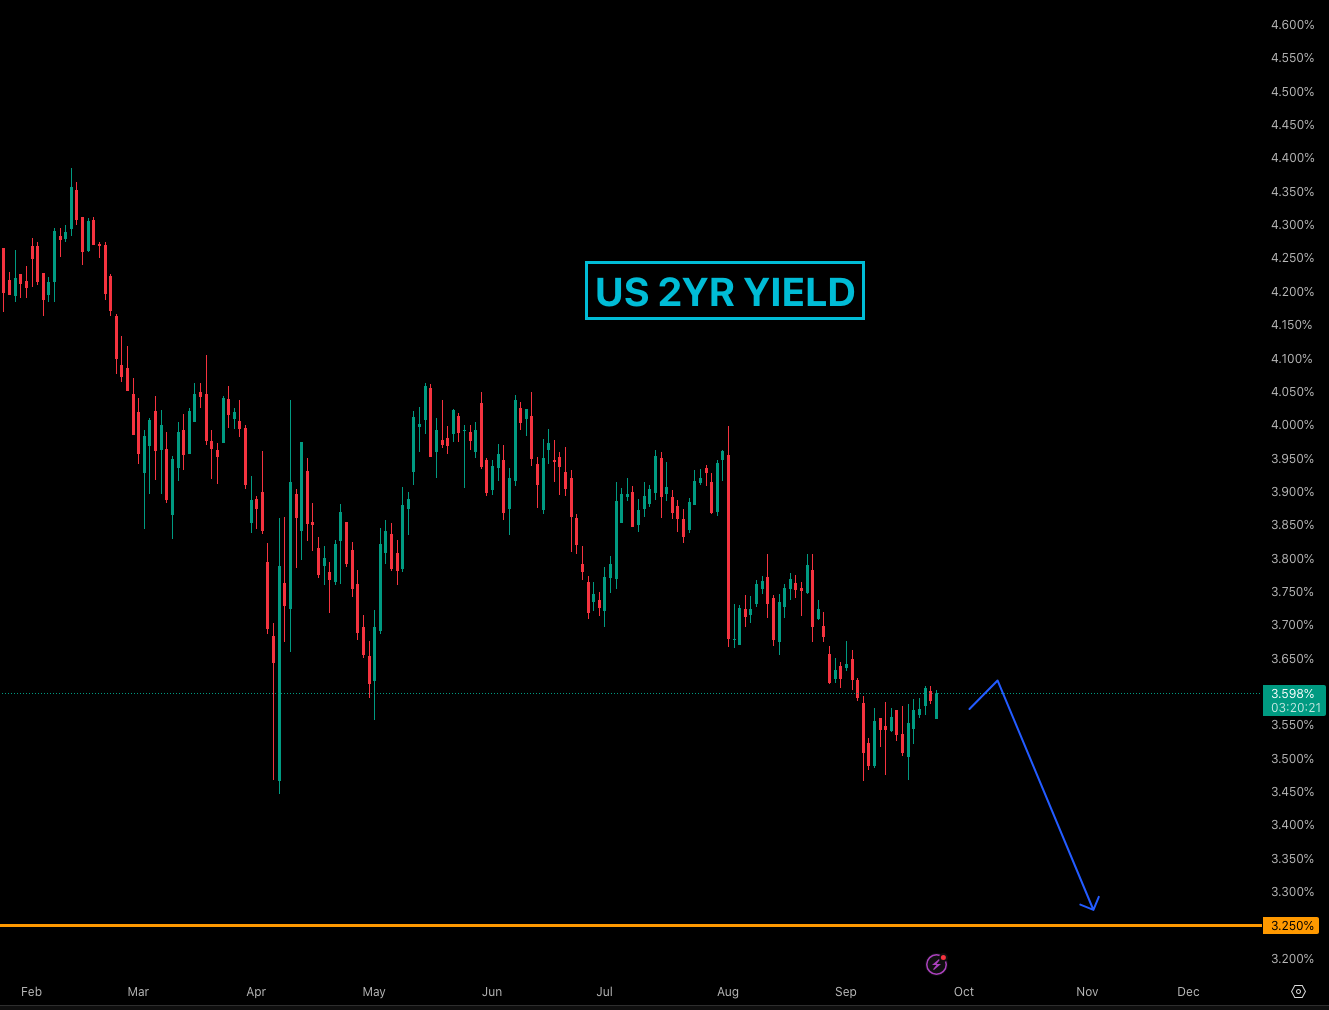
The U.S. two-year yield is supposed to track where Federal Reserve rates will be, usually by December of the following year, particularly during an active cutting cycle like the current one.
Current Yield: 3.5%.
Fed Projection: Nearer 3% to 3.2% by the end of December.
Bizarrely, the two-year yield has not broken the low of last September, similar to the behavior of real yields. It has no reason not to break it and really should go right down below it. This situation presents what is described as an “almost free money making trade idea” going long two-year bonds (betting on yields going lower). This trade idea, highlighted back in July, has been a moneymaker for sure.
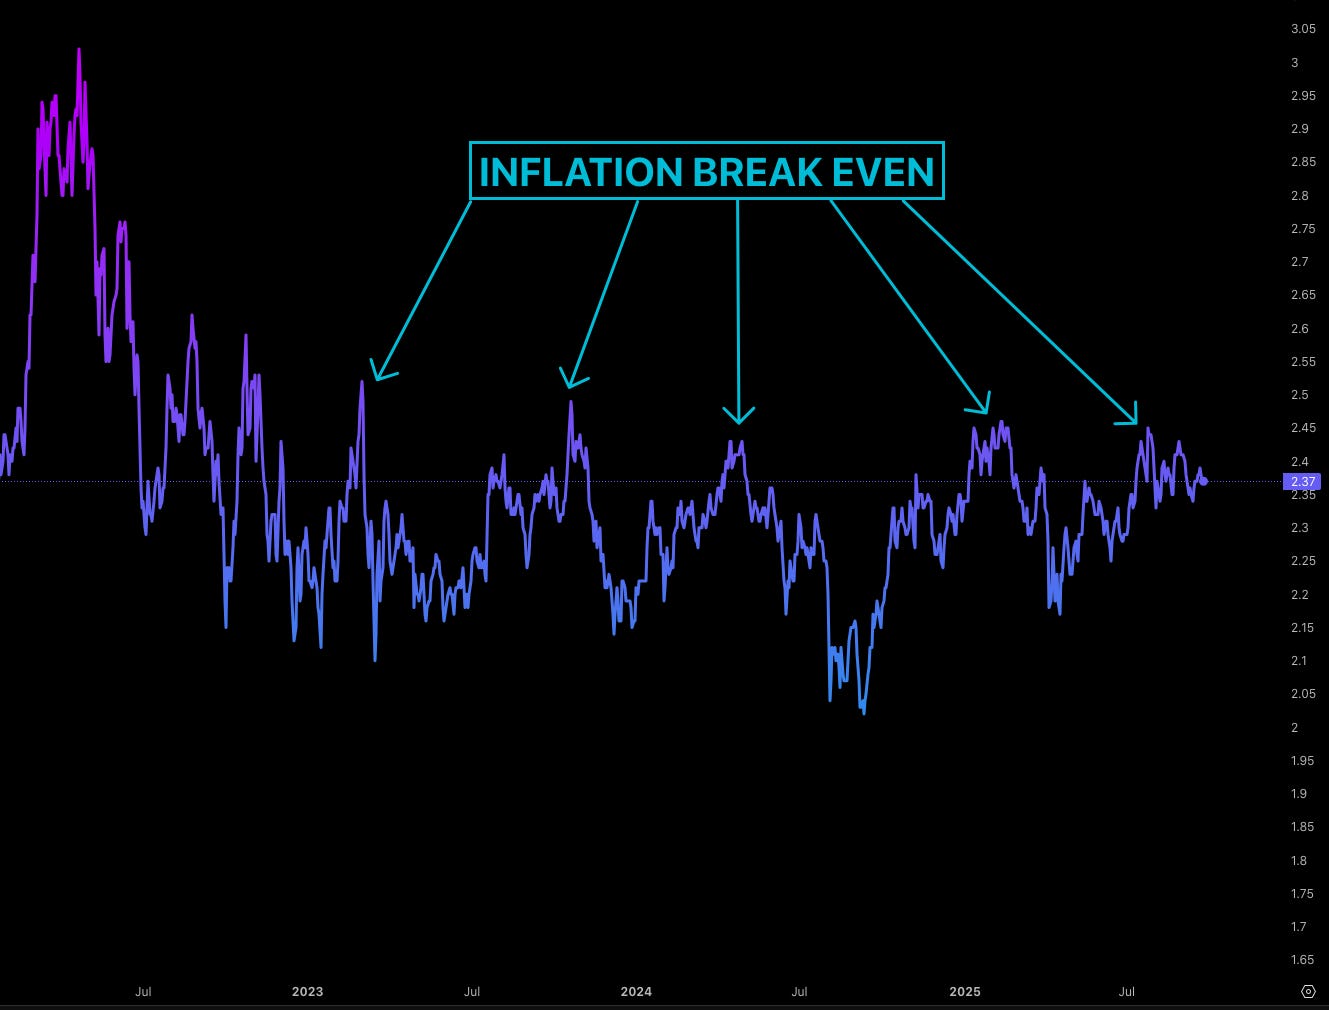
Inflation Expectations: The 10-year breakeven inflation rate provides brilliant insight into how the market views inflation over time, a chart the Fed tends to look at quite a lot.
Current Rate: The market is discounting that inflation in 10 years from now is going to average around 2.3%. This is slightly above the Fed’s target but nothing crazy.
Fed Reaction: If it goes above levels the Fed dislikes, they tend to get very aggressive, restrict money, make it difficult for people to invest, and may even hike rates.
Current Status: The chart has not been trending higher. Even with rate cuts and tariffs, nothing has made this market move higher; hence, the Fed is not worried about inflation.
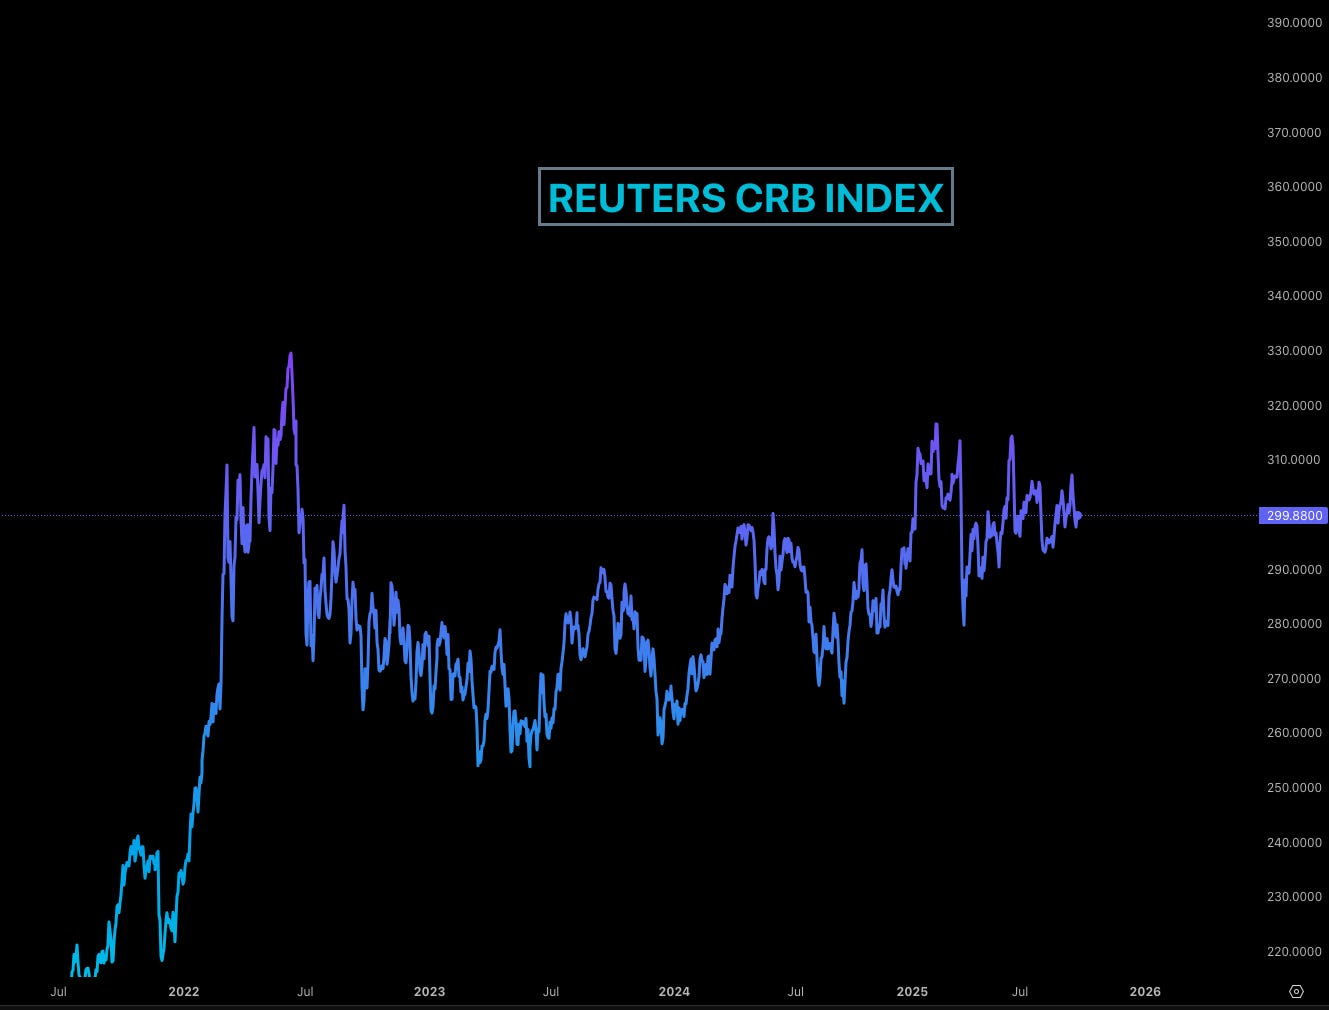
To assess consumer inflation concerns, we look at the Thomson Reuters Commodity Index. If inflation were picking up, commodities would rise. The index has not made a higher move since June. It is elevated but chopping. It is not coming down, which is not a great sign. If we see this making a run for the highs, then we should be worried about inflation again. Despite Gold’s massive surge, the index is not making a material move, largely because DBC and oil have not made any massive moves recently, attempting only mini rallies from the bottom of the six-week cycle.
Overall Macro Summary: The market has a direction yields should break down but it is not taking the bait yet. Inflation is high but not creating new fear. All the unknowns seem to be priced in, and all the knowns are fairly behind us.
The Liquidity Driver: Financial Condition Index
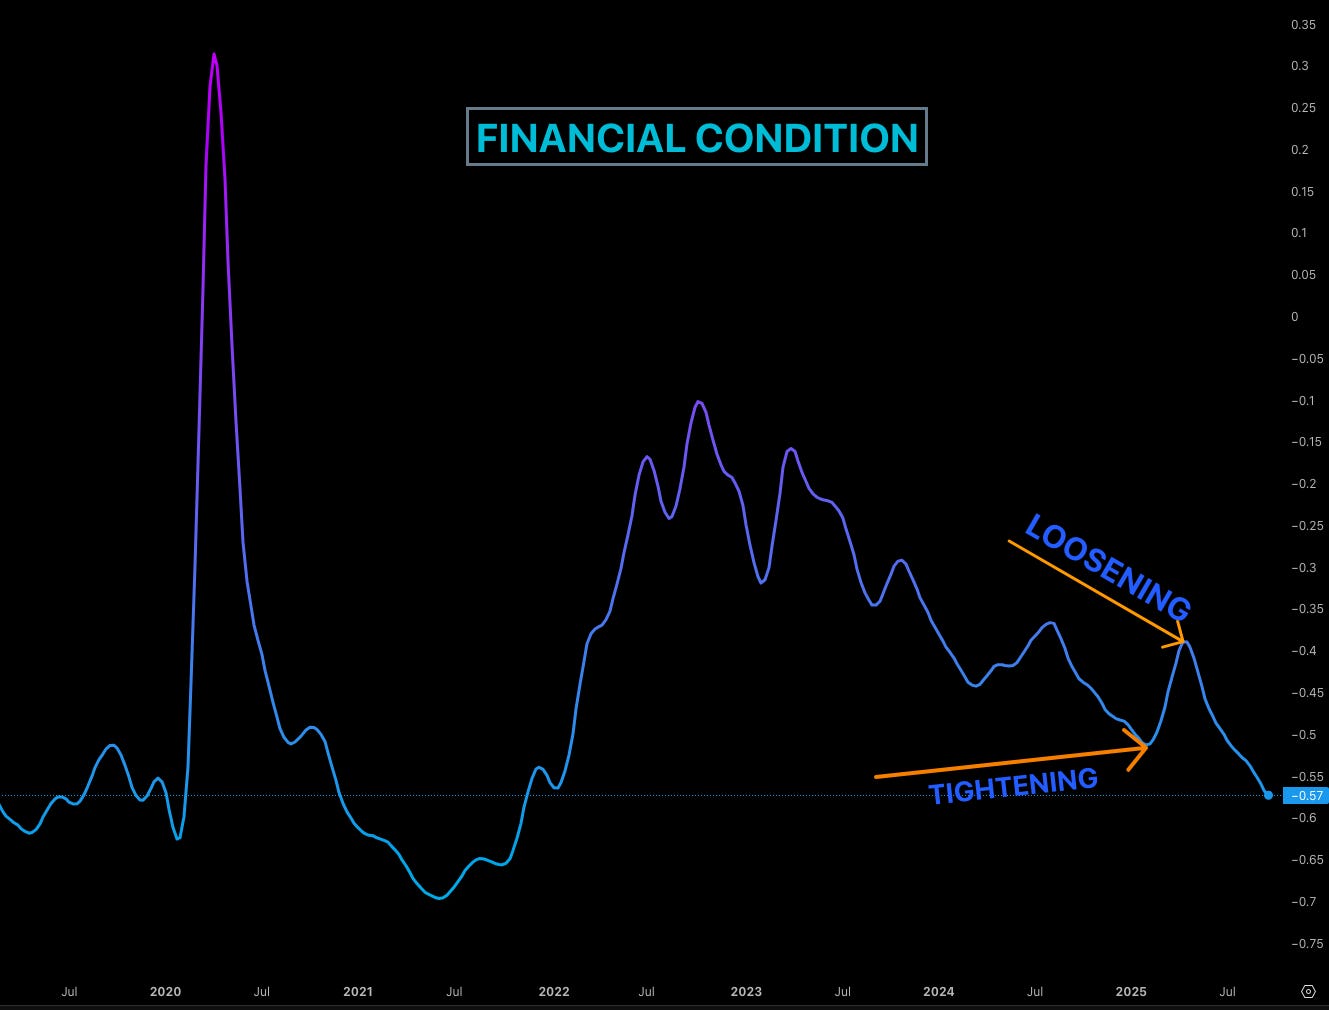
A crucial determinant of market direction, especially for risk assets, is liquidity, measured by the Financial Condition Index. This index indicates whether liquidity is tightening or loosening.
Tightening (Chart goes up): Liquidity is tighter. It is more difficult or expensive for banks, asset managers, institutions, and margin accounts to access credit. As the Western economy is built on credit and borrowing, restricted access is negative for risk assets like Bitcoin.
Loosening (Chart goes down): Access to credit is easier and cheaper, which is positive for risk assets. We call it loosening.
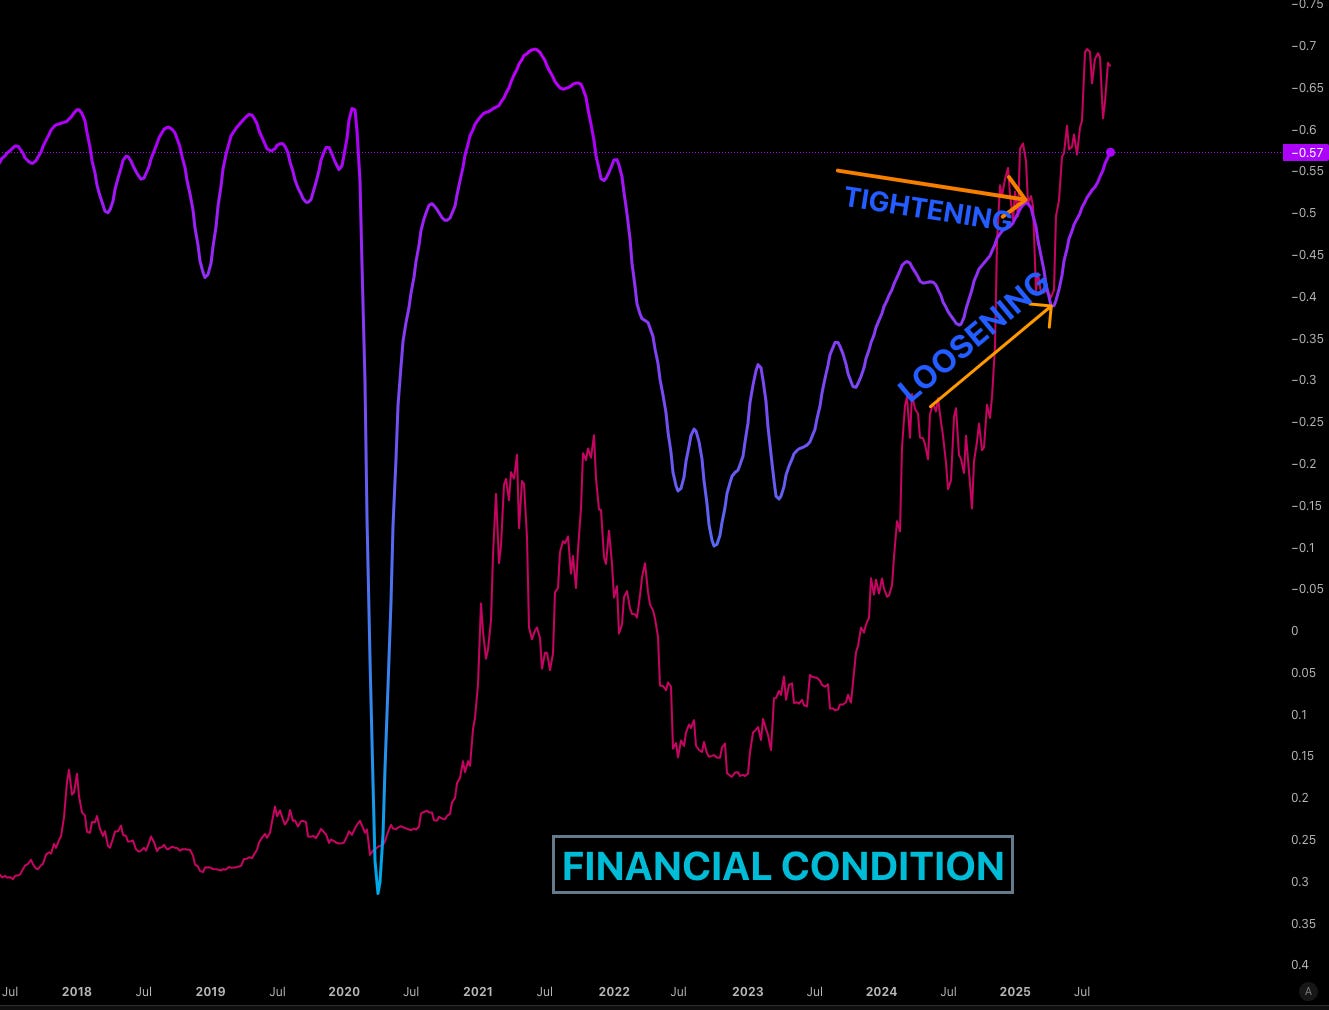
By inverting the Financial Condition Index chart, it becomes very clear that Bitcoin is following liquidity. This is how traders stay on the right side of the market majority of the time, it is not rocket science. This chart updates weekly and provides an overall edge from a weekly to monthly perspective. Currently, liquidity is good, the market remains healthy, and we are still in a good space.
Cryptocurrency Analysis and Strategy
With the understanding that overall liquidity is healthy, we analyze the internal dynamics of the cryptocurrency market, focusing on dominance charts to determine where capital is flowing within the ecosystem and ensure the reason to be in crypto is still there.
Decoding Dominance: Stablecoins as a Warning Signal
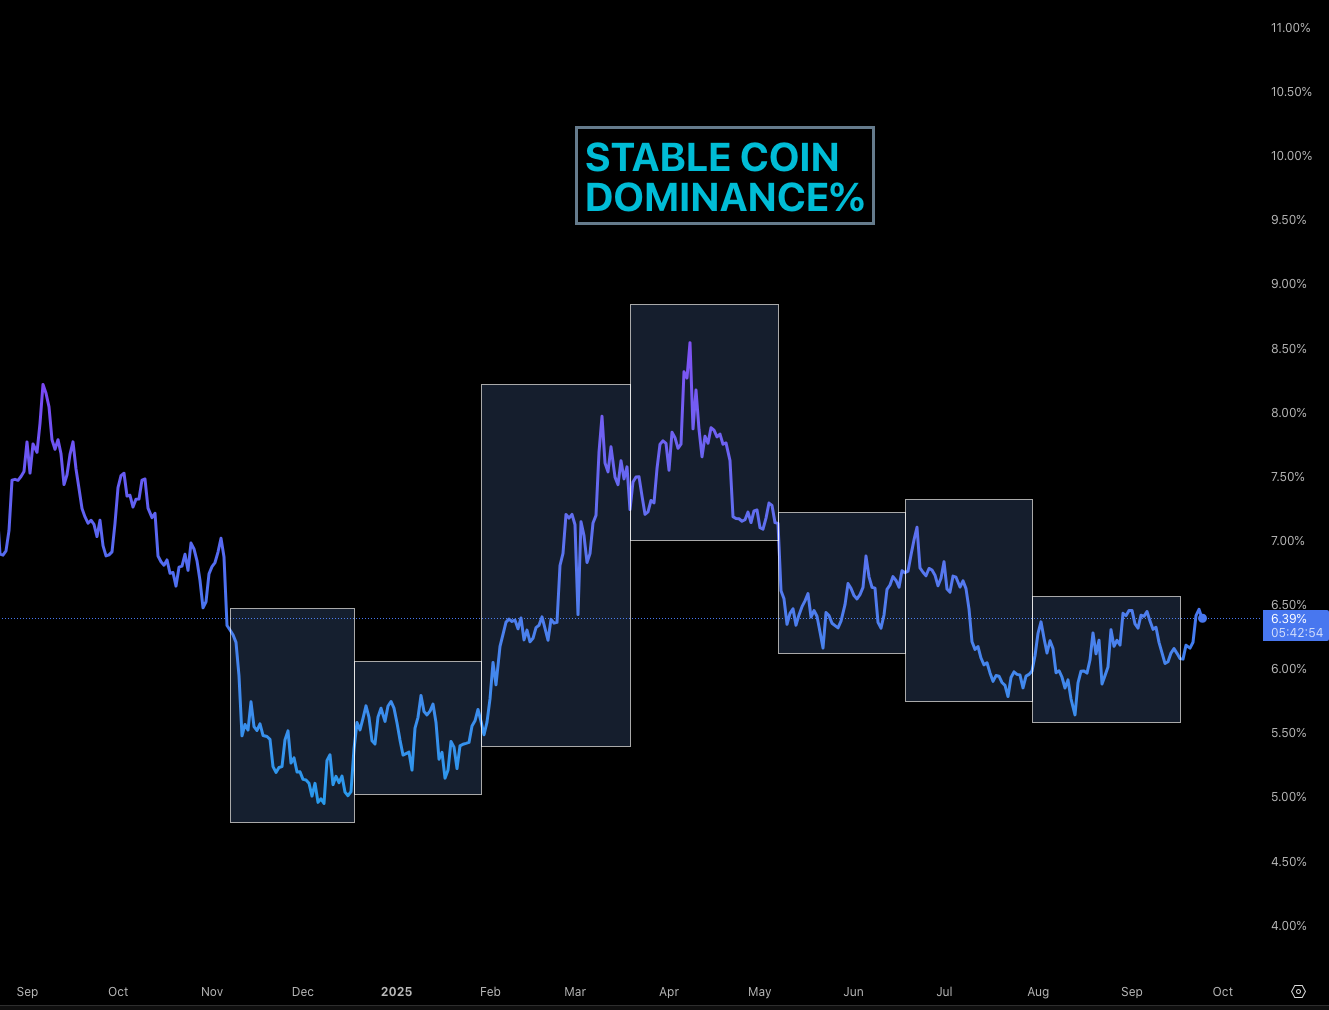
To assess the health of the crypto market, we look at stablecoin dominance (USDC, USDT, etc.) the percentage of the total crypto market cap held in stablecoins (shaded areas are 6-week cycles).
High Dominance: Means less money is in altcoins and crypto. This is the ideal time to enter Bitcoin or other long-term holds, as it signals a likely rotation into risk assets.
Low Dominance: Means money is moving out of safer assets into risky assets (altcoins and eventually memecoins).
Current Situation: Stablecoin dominance is very low, currently trading around 6.4%. Being this low is alarming because, in historical terms, it does not stay there for long. A spike-up could be expected. It is also dangerously close to the top of its six-week cycle range; a break above usually means it won’t touch the lower end until the next Fed cycle.
This requires timing crypto entries perfectly. Currently, the rotation from high dominance already happened back in April. The inclination now is to wait for dominance to climb towards 7% or 8% before looking to enter long-term coins and invest. Currently, the dominance chart is near the bottom, bouncing about, and has held its level since mid-July.
Altcoin Season Metrics and Solana Outlook
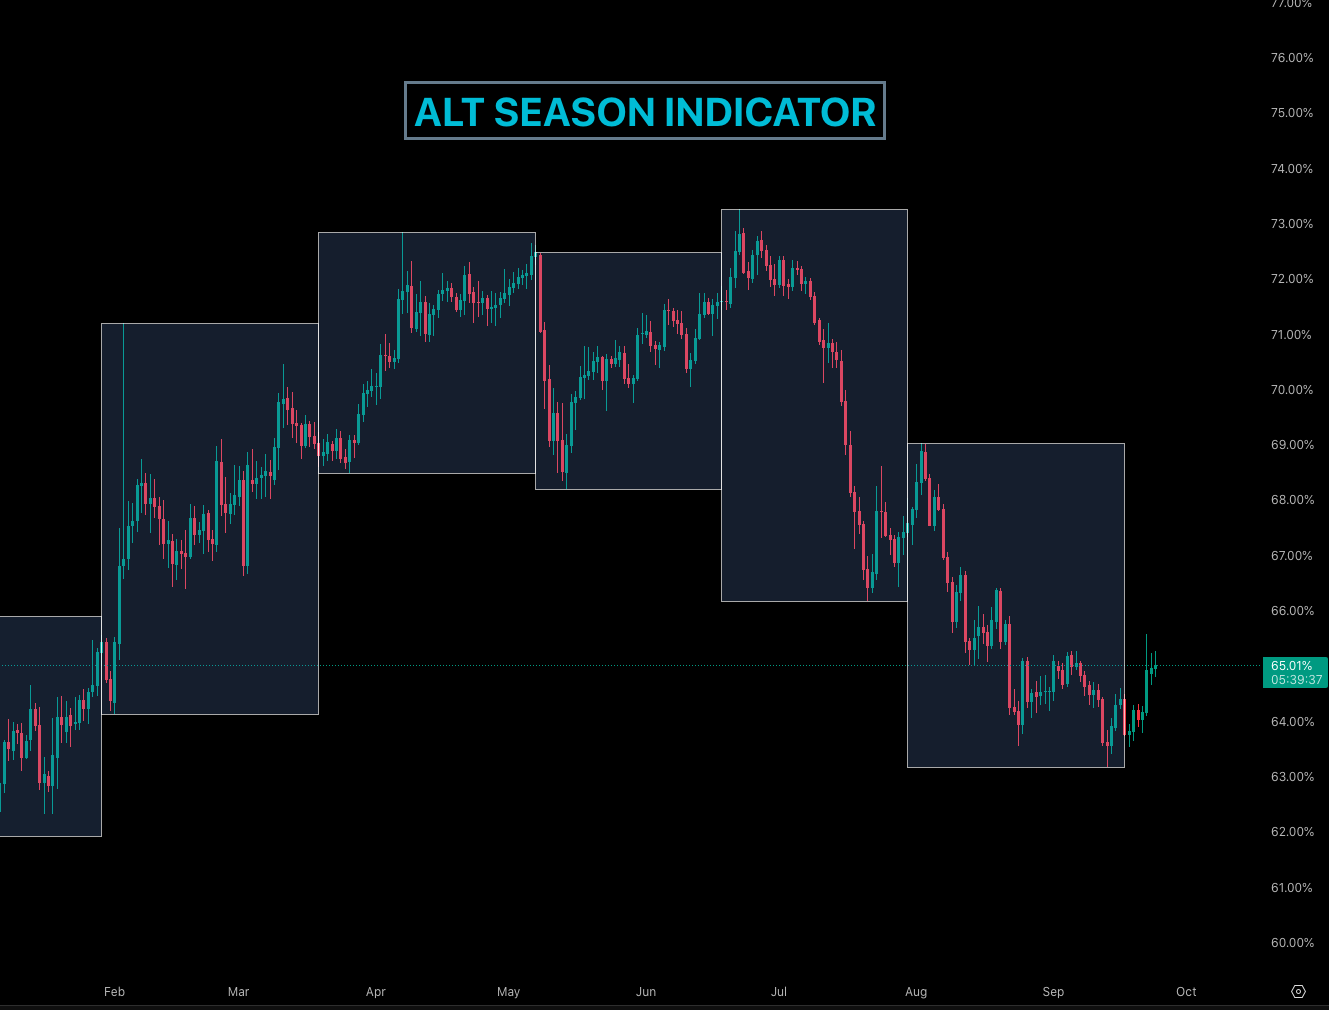
To understand where altcoins are headed, we combine stablecoin dominance and Bitcoin dominance. When this combined chart moves lower, it indicates money is moving out of both stablecoins and Bitcoin, flowing directly into altcoins (Solana, Ethereum, etc.), signaling the start of an altcoin pump and a gain in overall market share for alts(the chart goes down=liquidity moves to alts).
Solana (SOL) Analysis:
This trend has been true for Solana. As the combined dominance chart moved down, Solana gained significant market share.
Dominance Shift: In July, SOL dominance went from about 2.4% all the way to near 3.4%.
Current Assessment: As explained in previous videos and Discord write-ups, it is currently a terrible time to entertain longs because the dominance is historically way too high.
Outlook: Solana dominance is now dropping, which is exciting. Once it drops back down into the 2.5% or 2.4% zone, it will be interesting to look at the Solana network, pick some memecoins, and look at Solana itself at more lucrative levels.
Price Levels (Six-Week Cycle): The 50% level is at $203. Realistically, if Solana reaches $180 or maybe even around $160, that would be the time to look at longs again.
Bitcoin and Ethereum: Current Positions and Targets
Cryptocurrencies, like other asset classes, respect the mechanics of the six-week cycle. This finding has been confirmed through extensive statistical research over hundreds of hours the mechanics hold true in crypto assets as well.
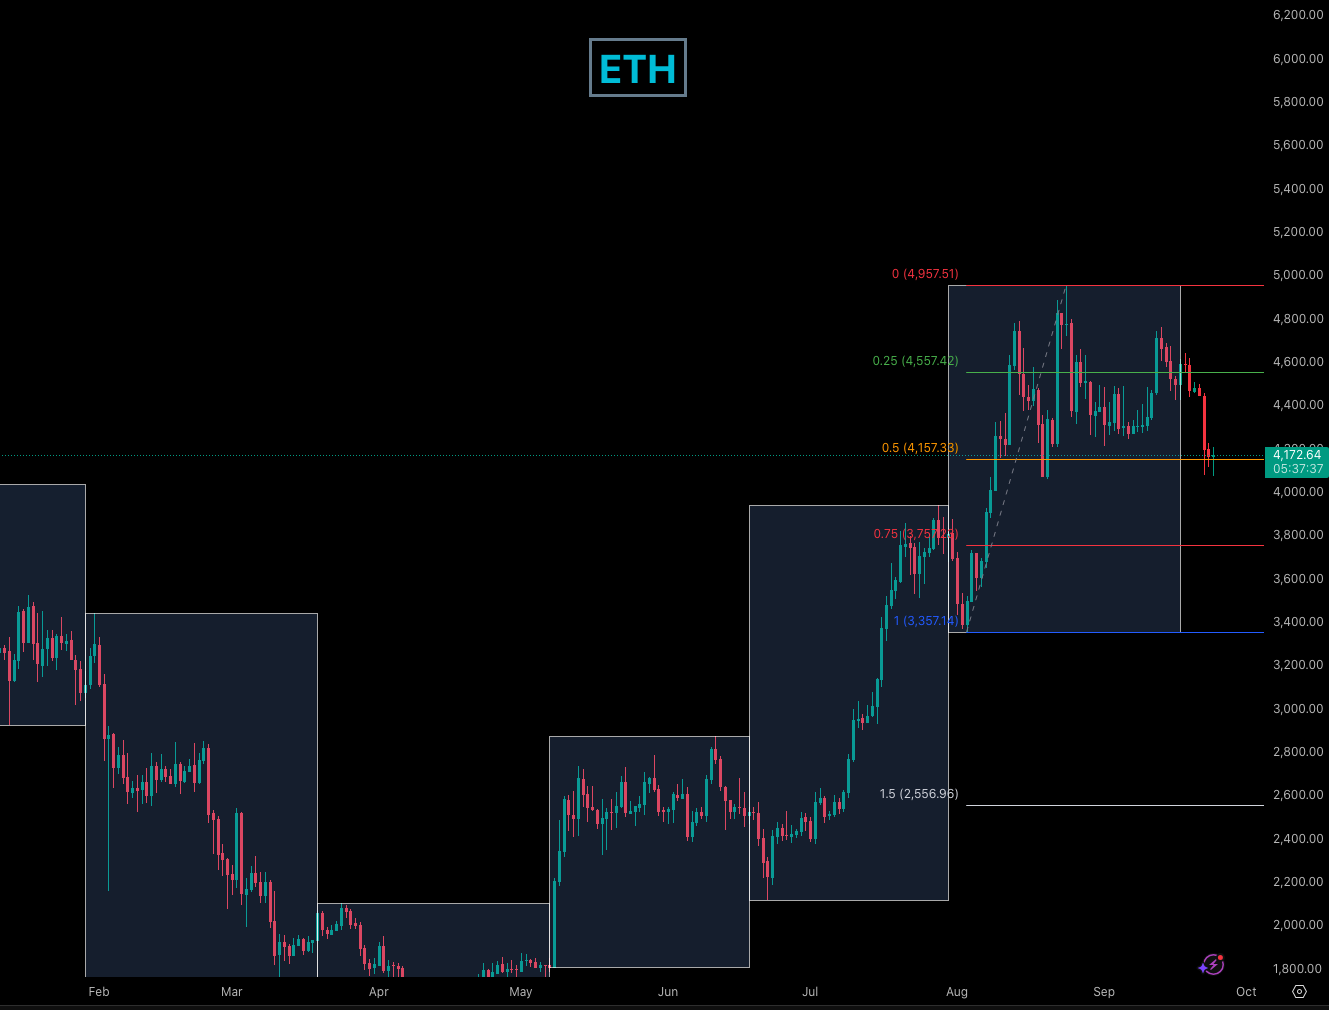
Ethereum (ETH): Ethereum is within the six-week cycle. If it hits $3,800, it would be an interesting level to look at it again.
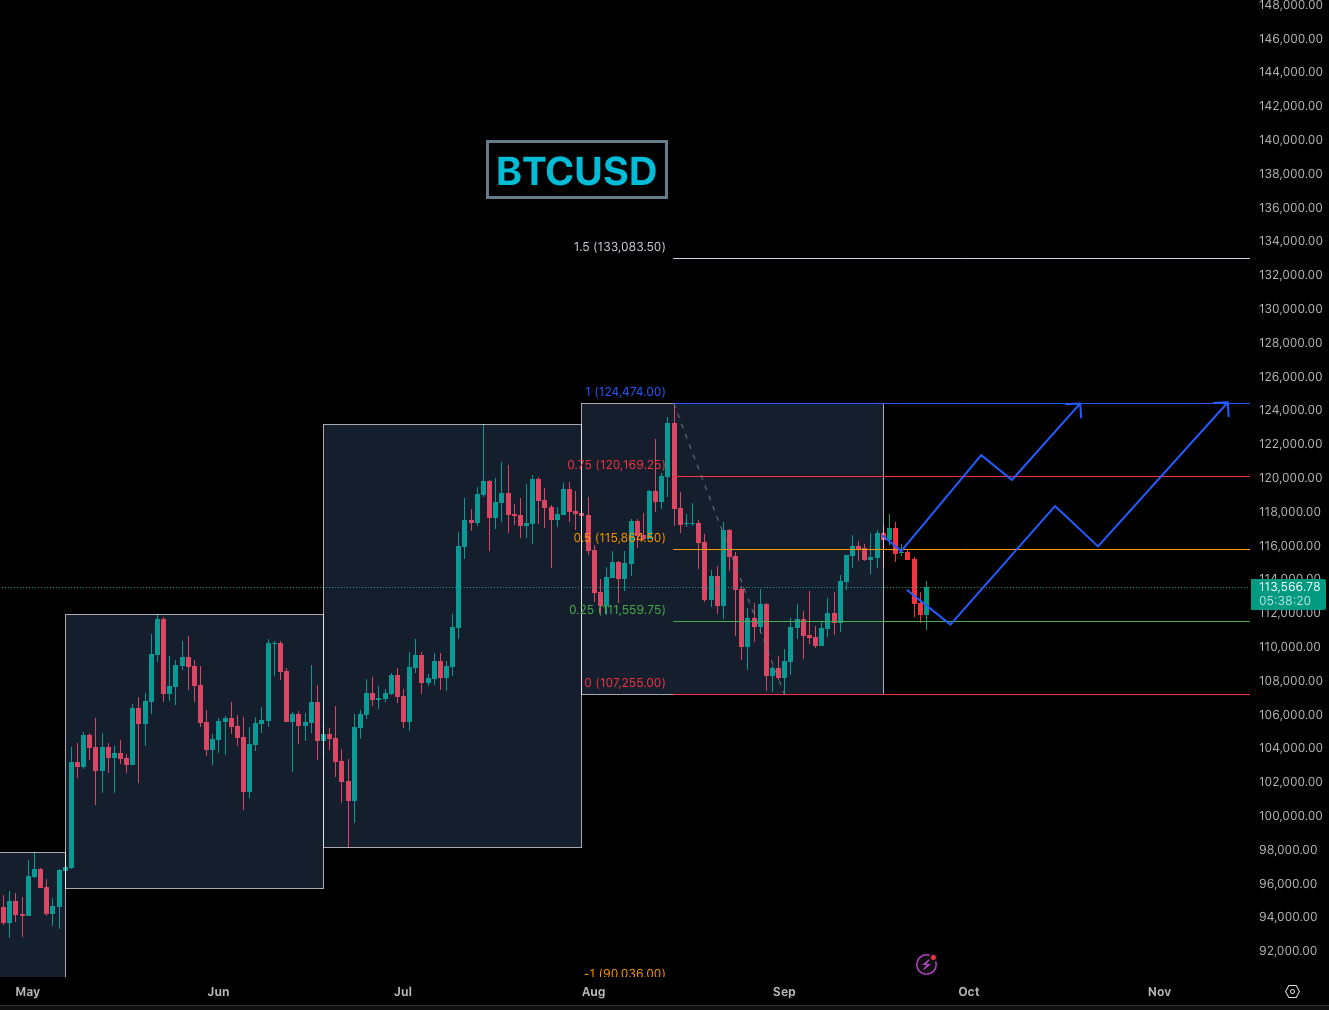
Bitcoin (BTC): A long position is currently active.
Entry: Around $112,000 (slightly later than the initial $111,000 target).
Stop Loss: Managed behind $107,000.
Current Status: This is near enough to the bottom of the cycle we want to get, but we are as close as we can get to our stop loss. Smaller dips will still be held.
Strategy: If it starts moving up and reclaims the $116,000 level, it is worth adding to the position and expanding our position trading here.
Navigating the “Low Conviction Zone”
It is crucial to recognize that the market is currently not in a high conviction zone. Bitcoin, along with many other assets, has gone nowhere for ages. The driver is not there.
Strategy in Low Conviction:
Pull back on leverage.
Pull back on position sizes.
Overall exposure in the market is currently very low less than 10%, maybe closer even to 5% across lots of the assets. While some larger trades taken earlier in the year are still running, all new positions are being entertained with lower leverage and lower risk exposure. The reasons for the market to go up are present, but the drivers and the excitement are not. When these factors do not line up, there is no point in pushing luck too far.
“Some traders call it easy mode. We are currently not in easy mode. We are currently in let us see who blinks first mode.”
The Altcoin Indicator (inverse to altcoin season; dominance of stablecoins and Bitcoin together) currently provides no clear indication. The overall trend is down (good for alts), suggesting you don’t want to be short altcoins. However, the market is very stretched and not at a lucrative level, meaning you don’t want to be aggressively long either. This is not a “low-hanging fruit” opportunity, and waiting out trades until a better entry presents itself allows for more composed trading.
Trader Q&A: Strategy Deep Dive
The following section addresses specific questions regarding the application of the six-week cycle, risk management strategies, and outlooks on specific assets.
Timing Entries within the Six-Week Cycle
Q: What do you look for to decide which level you want to bid on the six-week cycle? What makes you skip the 50% level and some decide to bid the lower 25 or the zero?
A: The 0% level is typically only bid if trading is already close to it, such as when the six-week cycle starts right at the bottom of the zone.
The decision to skip the 50% or 25% level relies heavily on understanding the macro environment, how price is evolving, and a good degree of experience.
For instance, with the current Bitcoin cycle, the initial target was the 50% level at $115,000-$116,000. However, this entry was skipped because the risk environment was not there: yields were playing up, and correlated assets were just not aligned. The decision was made to start trading from a lower level, seeking a better entry, with the acceptance that the market might move without participation. “If you are tuned in with yourself, if you are tuned into the market, you can 90% of the time trust yourself that you tend to enter at the right times.”
The Flip Side - Missed Opportunities:
Waiting for ideal levels means potentially missing out on larger moves. A notable example occurred with Gold back in November and December of last year 2024.
In November, it was clear Gold should be longed after a dip, but the trade was passed up.
In December, the analysis again favored buying, targeting a lower level (around $2,576). The decision was made that the macro environment suggested it was not the right time.
This assessment was wrong. It was the perfect time. Gold went straight from the six-week cycle and expanded repeatedly. Entry was eventually achieved at a much higher price.
While waiting can lead to missed trades, having a good understanding of the evolving macro narrative allows for trading with more conviction when entries are taken.
When to Increase Bitcoin Exposure
Q: When do you aim to go 20% risk on BTC?
A: Increased exposure will occur when liquidity is observed translating back into Bitcoin. Currently, Bitcoin dominance is super low and on a downward trajectory.
Current Dominance: 58%.
Potential Drop: Dominance can drop further, potentially to the 51% level.
Strategy: A drop to 51% would be very exciting, indicating Bitcoin is cheap. While currently long BTC because it is still a good trade, aggressiveness requires new factors lining up. Aggressive entries occurred in April due to a sharp move into very low dominance levels and significant mispricing.
The approach to trading emphasizes finding bargains. We tend to get excited about trades when they are really well priced. When these bargain opportunities arise in position trading, that is when we pounce.
Stop Loss Management and the “Decision Zone”
Q: Do you often close the position macro trade before the SL is hitting?
A: Yes, a lot of the times, positions are diluted significantly before the stop loss is hit.
In the context of the six-week cycle, the stop loss serves as a backstop: if you mismanage the trade, it will manage it for you; if the market moves too quickly, it takes care of it for you as well.
Strategically, if the trade is not moving in the intended direction, the cycle allows time to reassess. The zone between the 0% and the 25% percentile is the “decision zone.” This area prompts the questions: Do I still want to be in that trade? Is everything still going the right direction? Maybe I should get out, or maybe I should stick to my guns. Sometimes the answer doesn’t come quickly enough, and the stop loss gets hit, but often the market reverses favorably. However, the tendency is to close before the SL or greatly dilute the trade within this zone. This is a skill learned through trading more cycles.
NASDAQ Outlook and the Microsoft Divergence
Q: What are your thoughts on NASDAQ?
A: NASDAQ is bullish. It has clearly broken out of its six-week cycle. From a position trade perspective, there is no position to take due to this massive breakout zone.
Key drivers for NASDAQ include NVIDIA and Microsoft. A significant divergence is currently observed with Microsoft (MSFT).
Divergence: Microsoft has not caught up to the move on NASDAQ yet.
Current Price: $509 a share.
Expectation: It should move up towards all-time highs above $560 to replicate NASDAQ’s performance.
Risk Scenario: If Microsoft does not catch up and breaks the low of the six-week cycle at $493, it signals that NASDAQ might turn south with it.
Microsoft often acts as a leading indicator for NASDAQ. If MSFT starts breaking down those levels, it signals a massive mispricing in NASDAQ, presenting very interesting trade opportunities where risk would likely be increased.
The Reality of Stop Losses in Position Trading
Q: So, your current BTC trade is still a spot position, and do you put the SL order when you open the trade right away?
A: Yes, the stop loss order is placed immediately as standard practice.
However, it is important to understand the context of macro and position trading. Most traditional macro traders and hedge funds do not use stop losses at all. They do not believe in it. There is a running joke in those circles: “stops are for buses.”
Instead of stop losses, they use:
Portfolio management techniques.
Hedging to diversify risk and ensure directional alignment.
Teams of analysts to stay on the right side of liquidity moves.
When the market goes against them, they are not too worried; they may add positions. The challenge arises when communicating this strategy to traders from different backgrounds who may view it as reckless.
The six-week cycle provides a solution: it allows for the expression of position trades while providing a safe stop loss. Statistically, if you are on the right side of a trade, the six-week cycle will always keep your stop loss safe. While many traditional hedge funds are unaware of this or stick to old ways, newer participants recognize its value, such as structuring options outside that cycle price range to achieve outsized returns.
Therefore, the stop loss is placed under the six-week cycle, acknowledging some nuances if trading very close to the bottom of the cycle.
Key Takeaways and Outlook
As we navigate the end of September and enter the final quarter of 2025, the alignment of trader psychology, market environment, and setup remains the cornerstone of profitability. Utilizing the six-week cycle provides a systematic framework for hunting volatility and managing risk, defining clear entry zones and statistically sound stop losses.
The macro environment is characterized as healthy and risk-on, supported by historically low credit spreads and loosening liquidity conditions. However, the refusal of real yields (1.73%) and the two-year yield (3.5%) to break lower despite the Fed’s cutting cycle presents a notable puzzle, offering potential opportunities in the bond market (the “free money trade”). Inflation remains subdued (2.3% breakeven), giving the Fed leeway.
In the cryptocurrency markets, we are in a “low conviction zone.” While overall liquidity supports risk assets, the extremely low stablecoin dominance (6.4%) signals potential volatility and rotation away from altcoins. Exposure should be managed conservatively (5-10%) until clear drivers re-emerge. Key levels to watch include $116,000 for Bitcoin expansion, $160-$180 for Solana entries, and the critical $493 level on Microsoft as a leading indicator for NASDAQ’s sustainability.
Disclaimer: This isn’t financial advice – just market musings from the charts. Always do your own research.
If you enjoyed this deep dive, please share it with fellow traders!
Great write up once again, so much to learn here