

Liquidity Squeezes, VIX Deflation, The Great Positioning Unwind: A Live Market Deep Dive

Administrative Announcement:
In the markets, your greatest asset is your information and your discipline. At Speculators Trading, our goal is to provide the cutting-edge research and technical frameworks you need to improve your edge. To help you prepare for the trading year ahead, we are excited to announce our Black Friday Sale. For a limited time, enjoy 30% OFF all our premium tiers.

Which path is right for you?
The Monthly Pass (All-Inclusive) Best for traders who want real-time guidance. Gain entry to the #trading-floor for daily setups and live analysis from Lead Analyst Miad Kasravi and Veteran Trader Pheneck. Engage in the Speculators Edge discussion rooms and get full access to all bi-weekly livestreams.
The Webinar Pass (Education & Prep) Best for traders focused on deep-dive learning. Access our Sunday Battle Plan streams to prep for the week and Wednesday Macro Webinars to master the global landscape and trader psychology. Plus, unlock our full archive of educational recordings and research reports.
The Annual Pass (Year round All-Inclusive Access): Best value offer, future proof your journey navigating the financial markets in 2026 at 30% discount. Receive year round access to all services and courses offered at Speculators Trading Community.
Claim Your 30% Discount Today using the code: Black Friday at Speculators Trading
Don’t just watch the markets, learn to master them. Join Speculators Trading to operate alongside elite traders, armed with lightning-fast tools and institutional-grade insights. Secure your competitive edge today and step into 2026 fully prepared to dominate the financial landscape
📊Executive Summary
Welcome to a special deep dive analysis from Glasgow, Scotland. The conclusion over last week’s sell off is distinct: This sell-off is not fundamental it is a positioning unwind.
The recent market turbulence has nothing to do with the “AI trade blowing up” or systemic failures; the fundamentals remain very much intact. Instead, we are witnessing a leverage flush in a market that was historically overextended. On the monthly S&P 500 chart, we saw six consecutive bullish months a “steroidal” run where S&P500 had posted 6 consecutive bullish monthly candles. A bearish pullback month was statistically overdue to unwind leverage, punishing short-term positions while resetting the board for the next leg up.
Key Themes for the Week Ahead:
Liquidity & Seasonality: As we approach December 1st, we face the end of Quantitative Tightening (QT) and a looming liquidity burst heading into January, February, and March 2026.
The VIX Deflation Signal: We are witnessing a rare “Four consecutive weekly Candle” pattern on the VIX weekly chart. Historically, the VIX rarely sustains four consecutive up candles; therefore a sharp deflation (and subsequent equity squeeze) is statistically imminent.
Gap Theory: Both S&P 500 and NASDAQ have filled critical downside gaps and should now be targeting upside inefficiencies.
Crypto Reset: Institutional capital is reshuffling from leveraged proxies like MSTR into spot ETFs (Ticker: IBIT). We are eyeing deep spot entry levels for Bitcoin (69k-74k) while navigating the current drop.
The Bias: Shorting here is not a wise option. The market has filled its inefficiencies, and we are seeing signs of a reversal starting as of Friday’s OPEX last week.
⚙️Market Mechanics: S&P 500 and The VIX Reversal
The Gap Fill and OPEX Squeeze
The primary driver of the S&P 500’s recent descent was technical inefficiency: an open gap left from Sunday, October 10th.
The Setup: Following a bearish weekly close, futures opened with a massive gap that remained unfilled despite minor pullbacks.
The Resolution: The recent flush was the market’s mechanism to fill this gap entirely. Once the price action precisely filled this inefficiency, we saw immediate profit-taking from shorts heading into Friday’s OPEX (the largest on record).
The Result: This triggered a short squeeze. The market inefficiency is now resolved, and the reversal began on Friday.
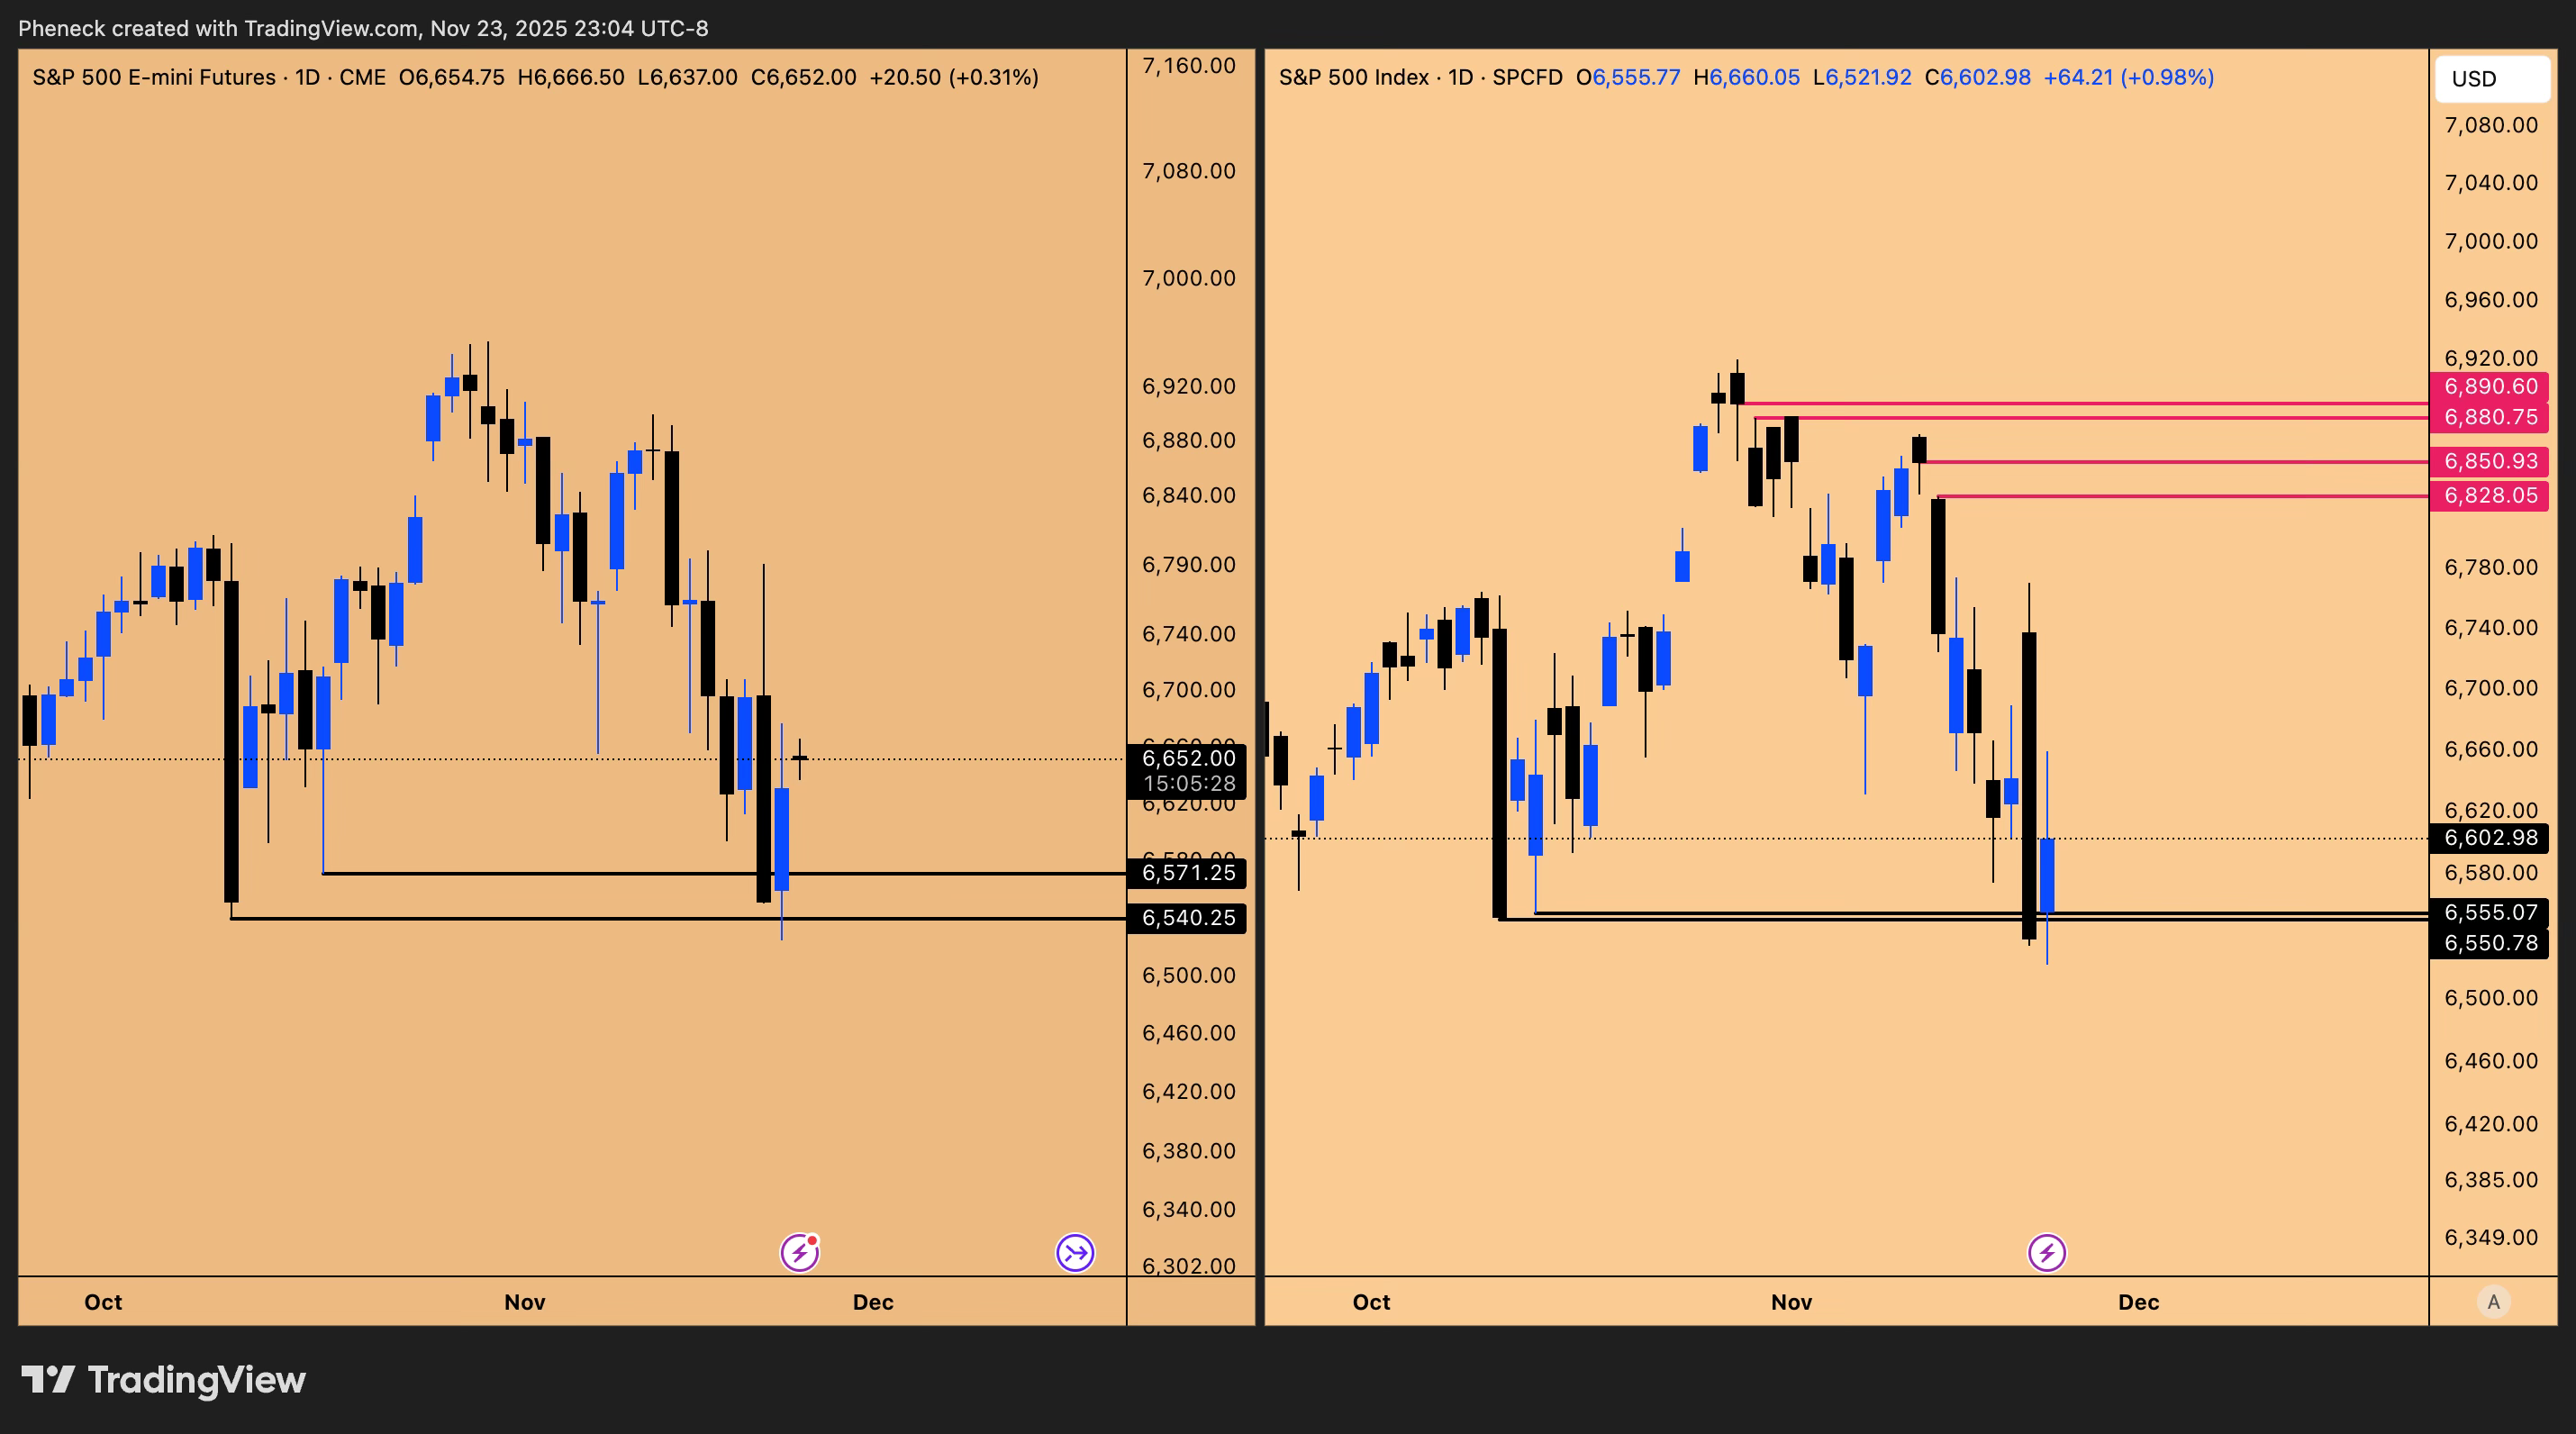
Figure 1: Open gap’s on ES/SPX500 index
Intraday Volatility as a Bottoming Signal
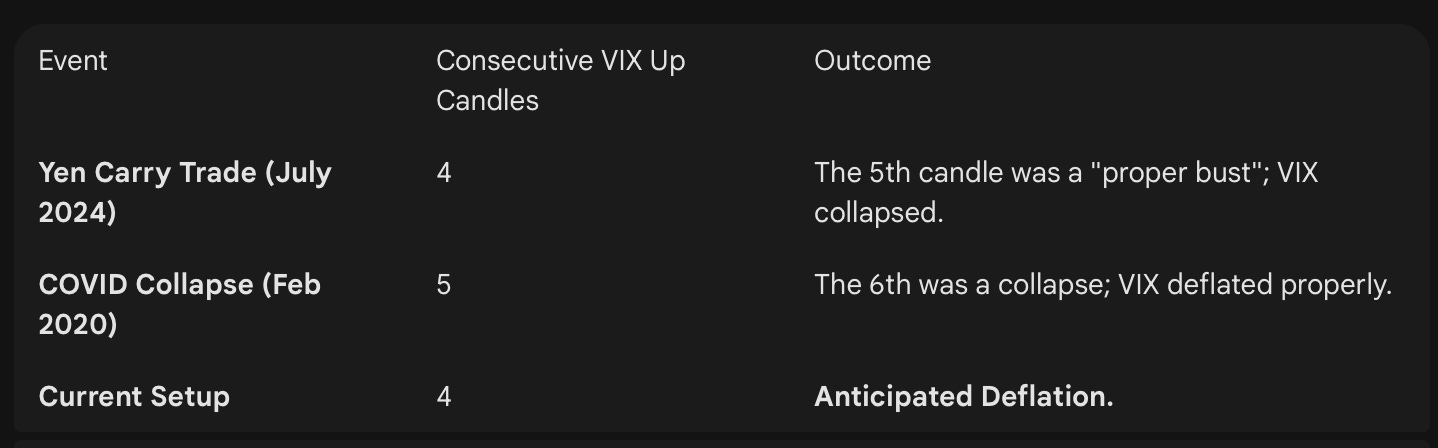
We are witnessing a specific volatility signature that often marks local bottoms, similar to the COVID crash (April 2020):
The Pattern: The market opens heavily bullish (up >1% to 1.3%), reaches ~90 points up, and then undergoes a massive intraday reversal to close down significantly (e.g., -2.6%).
Implication: When you see this specific type of intraday volatility—opening up 3% and flushing—it usually signals a capitulation bottom. Notably, the bottom formed on Friday should not been re-attacked. In April 2025, the market had a similar setup and managed to squeeze 10% higher within the week
VIX Analysis: The “Four Consecutive Weekly Candle” Limit
The most compelling argument for a bullish week in Risk-On Assets lies in the Volatility Index (VIX). The VIX has been capped by a specific S/R level at 28.32 for over a year (since December 2024 and the tariff attack in April 2025). We tagged this level on Friday and began rejecting.
The “Four consecutive bullish Candle” Historical Anomaly:
On the weekly timeframe, the VIX has printed four consecutive up candles. This is the “rarest of the rare.”
The Thesis: Very rarely does the VIX go for a fifth consecutive green weekly candle. If the four-candle pattern is printed, the subsequent candles almost always turn bearish. If the VIX deflates, the S&P 500 must be bought up by VOL control funds.
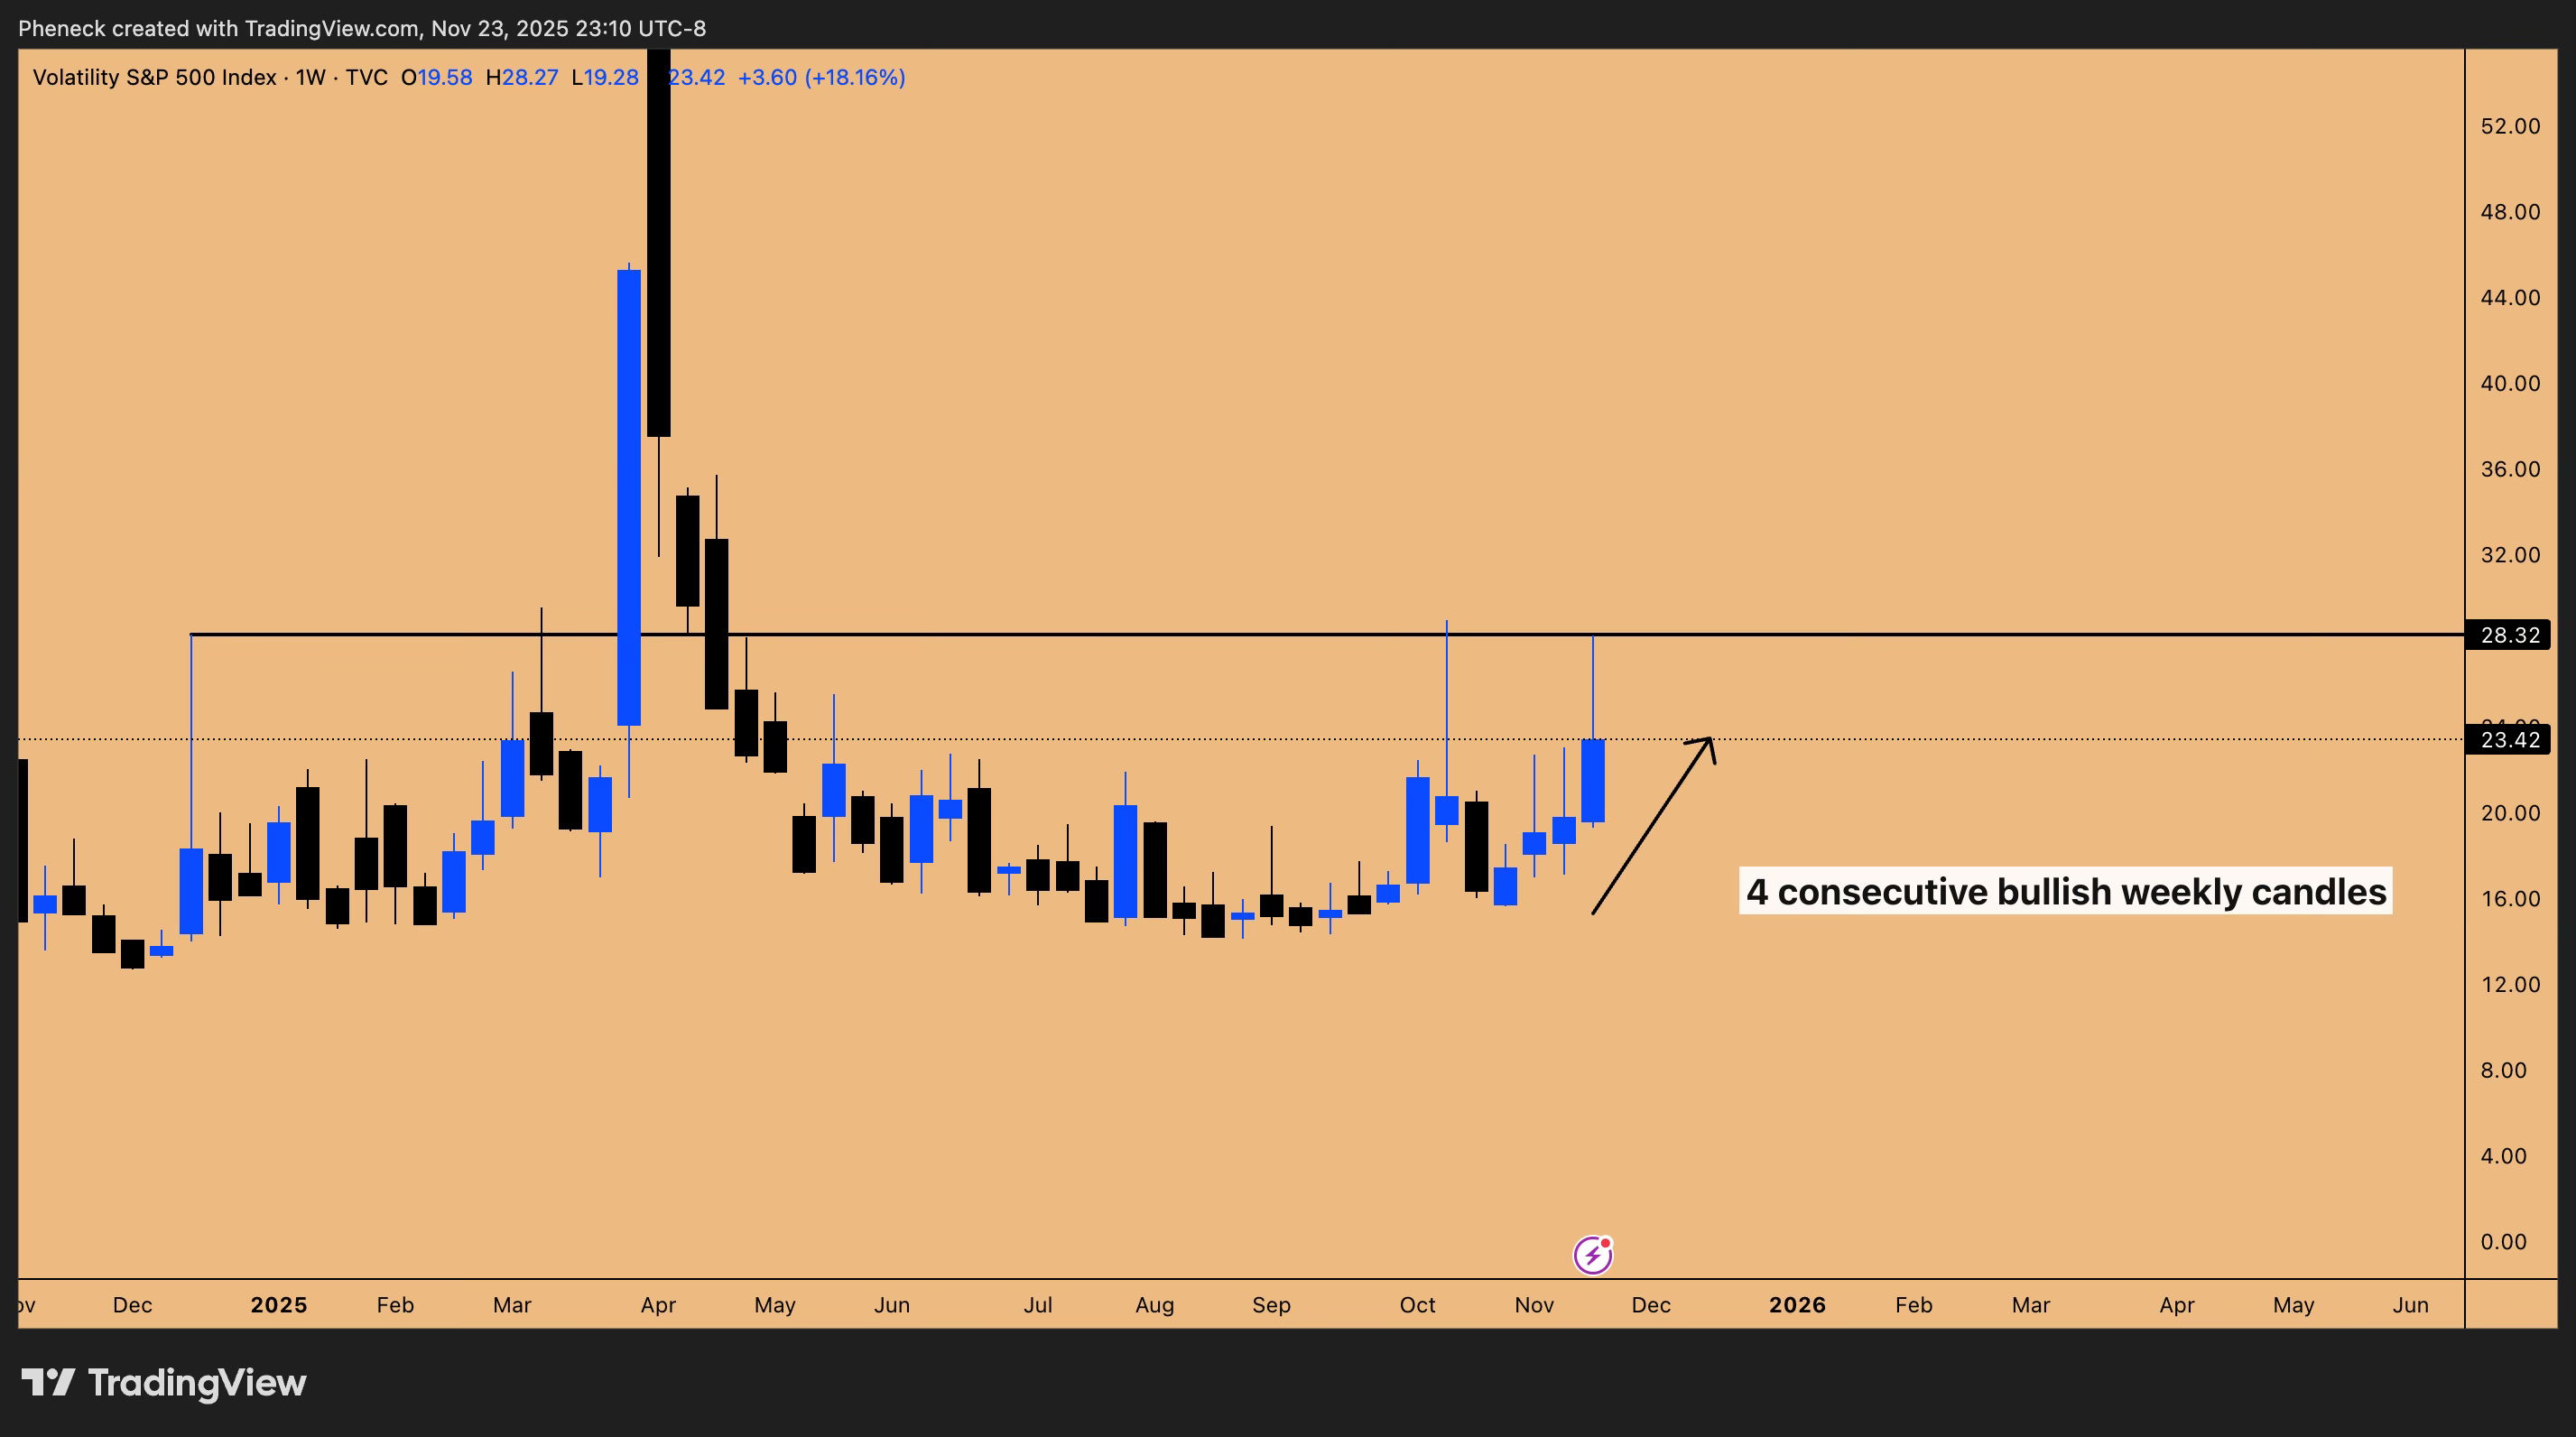
Figure 2: 4 consecutive bullish weekly candles on VIX, rare pattern in play
🌐Global Indices: NASDAQ, Seasonality, and Targets
Correlated Upside Targets
The S&P 500 and NASDAQ are mirroring each other. Just as they attacked the downside gap simultaneously, they will target the upside inefficiencies together.
S&P 500 Targets: If the VIX deflates, the draw on liquidity is the open upside gaps between 6,828–6,850 and 6,882–6,890.
NASDAQ Targets: The correlated gap on the NDX cash index sits between 25,762 and 25,887.
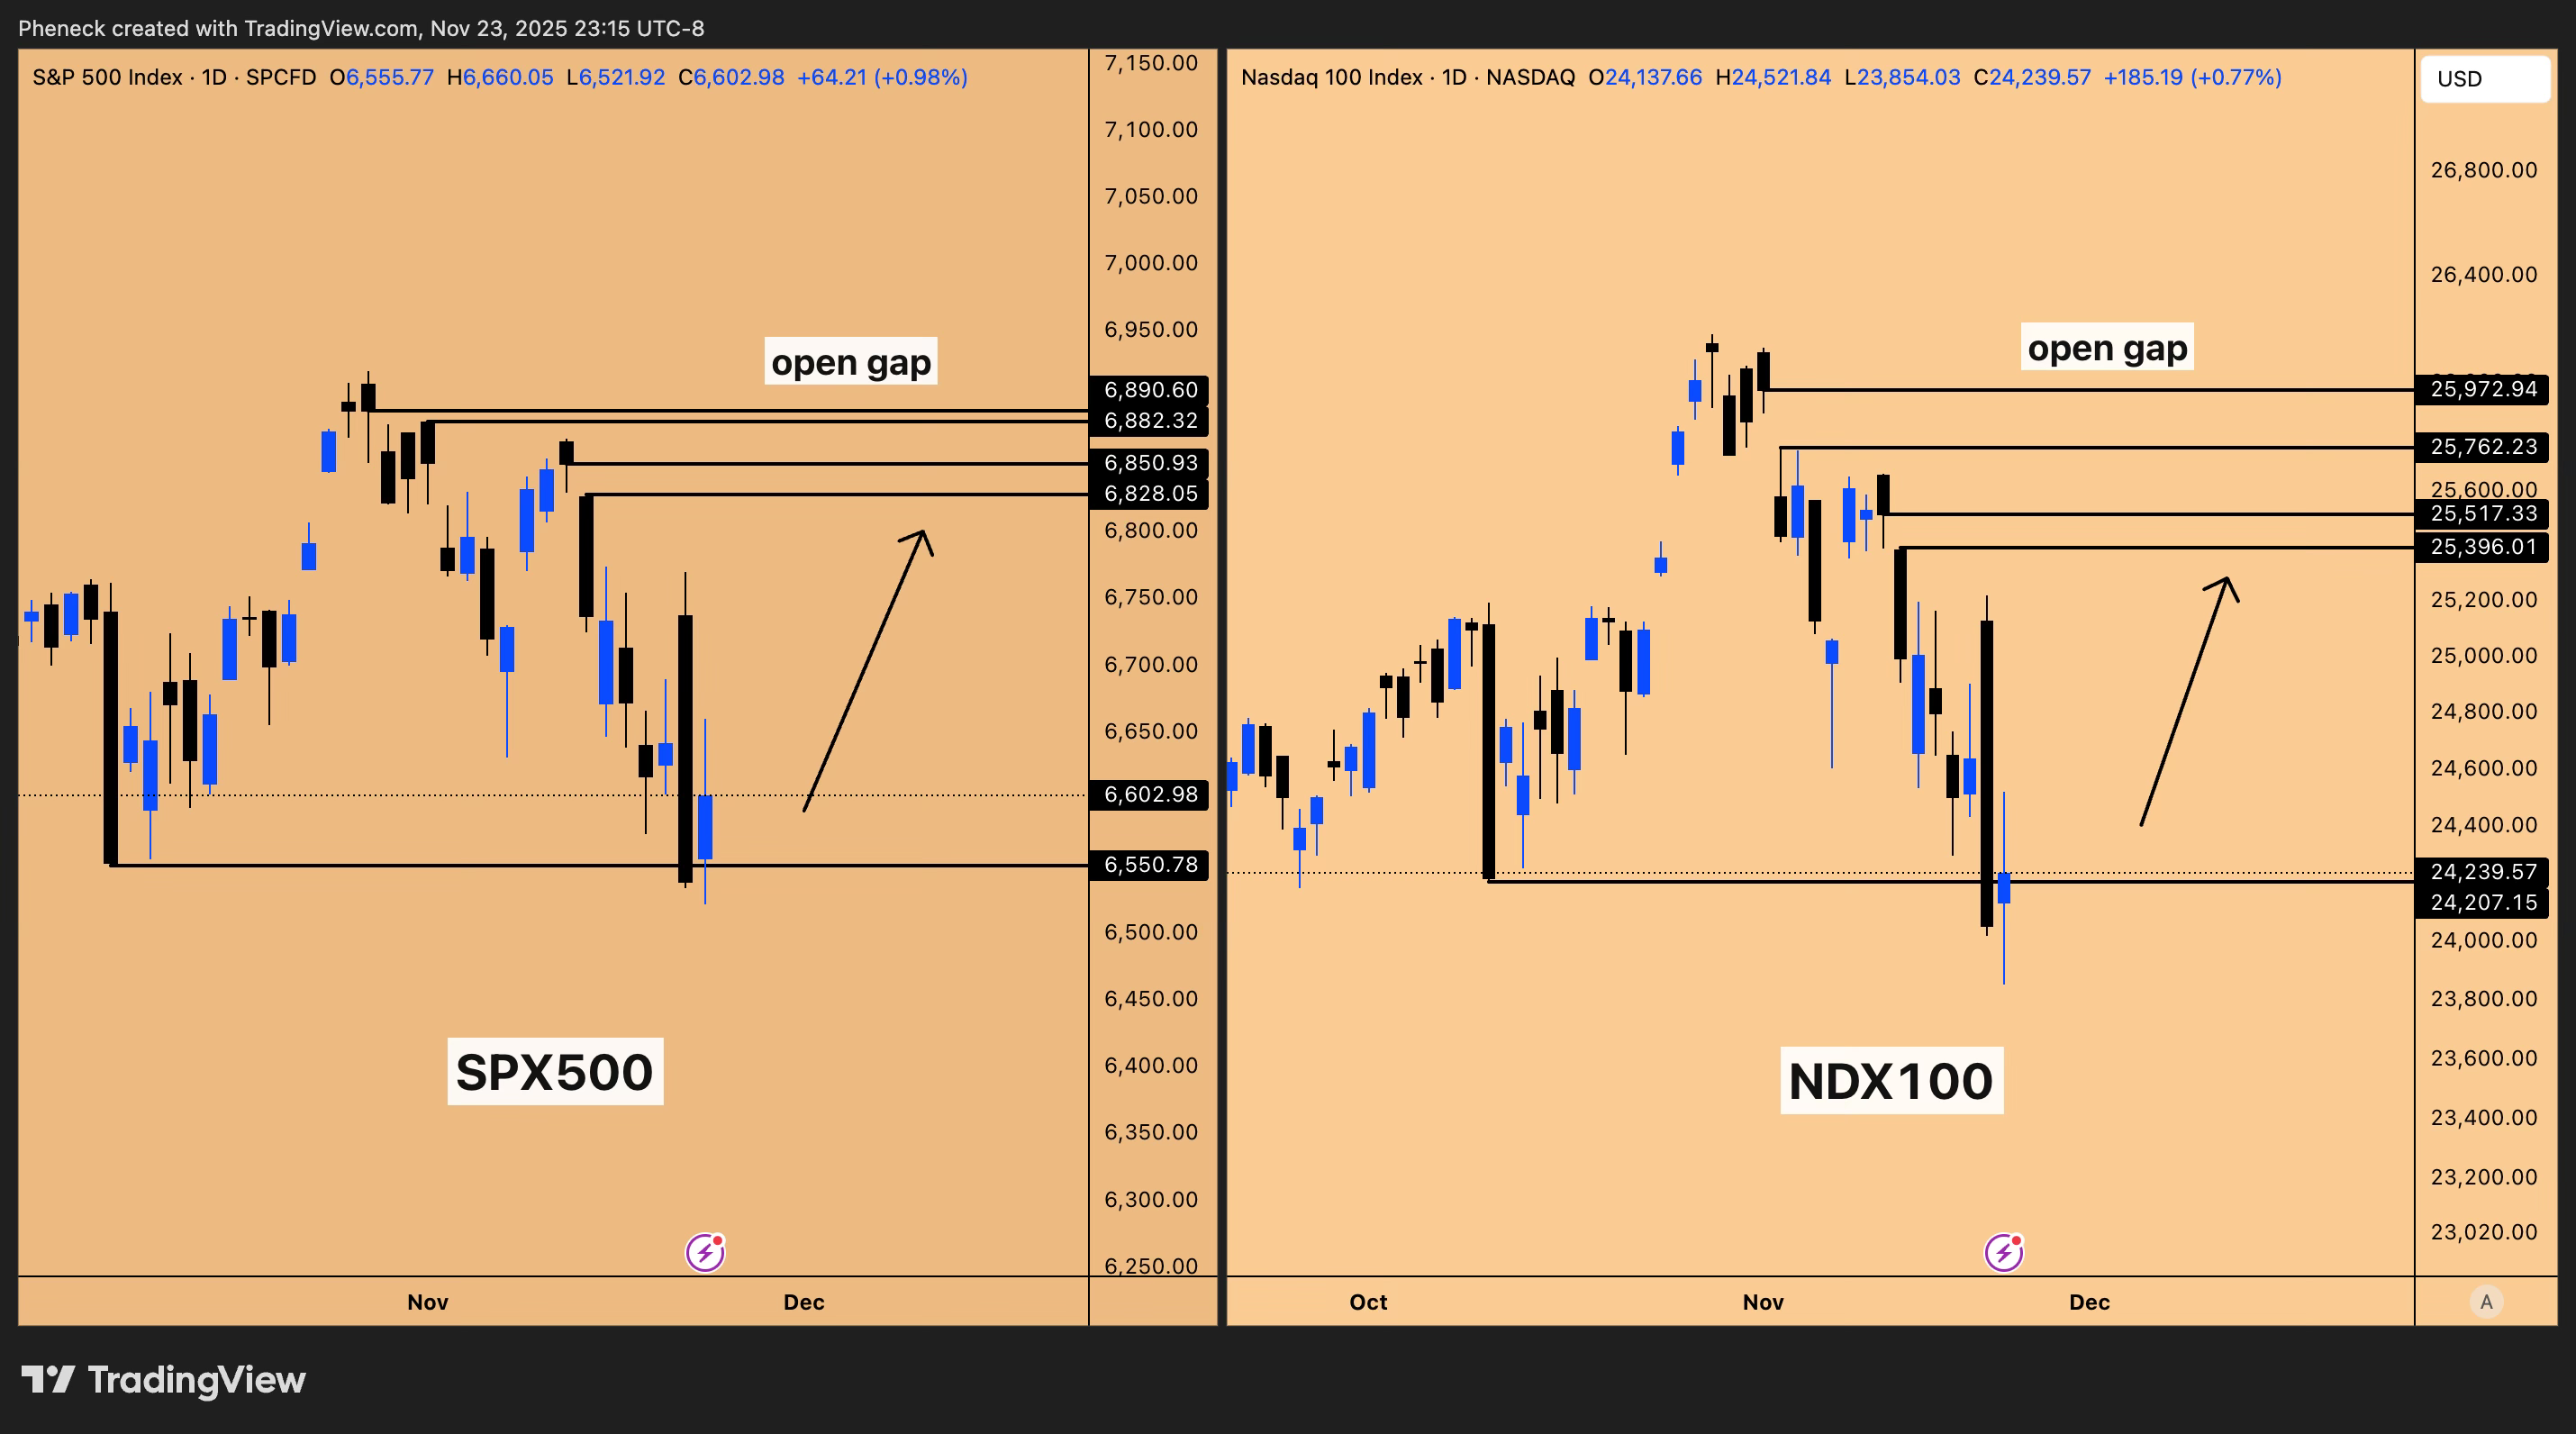
Figure 3: SPX500 vs NDX100, open gap’s in play
The “Flat Open” Monthly Magnet
On the SPX monthly chart, the current candle has a “flat open.”
Open Level: 6,882.32
High Level: 6,882.32
Interpretation: There is literally no wick on the monthly candle. This creates a magnetic draw. If the squeeze begins, it will not stop until this inefficiency is resolved. The market is unlikely to drop another 18-20% to fill lower inefficiencies without first addressing this flat open at 6,882.
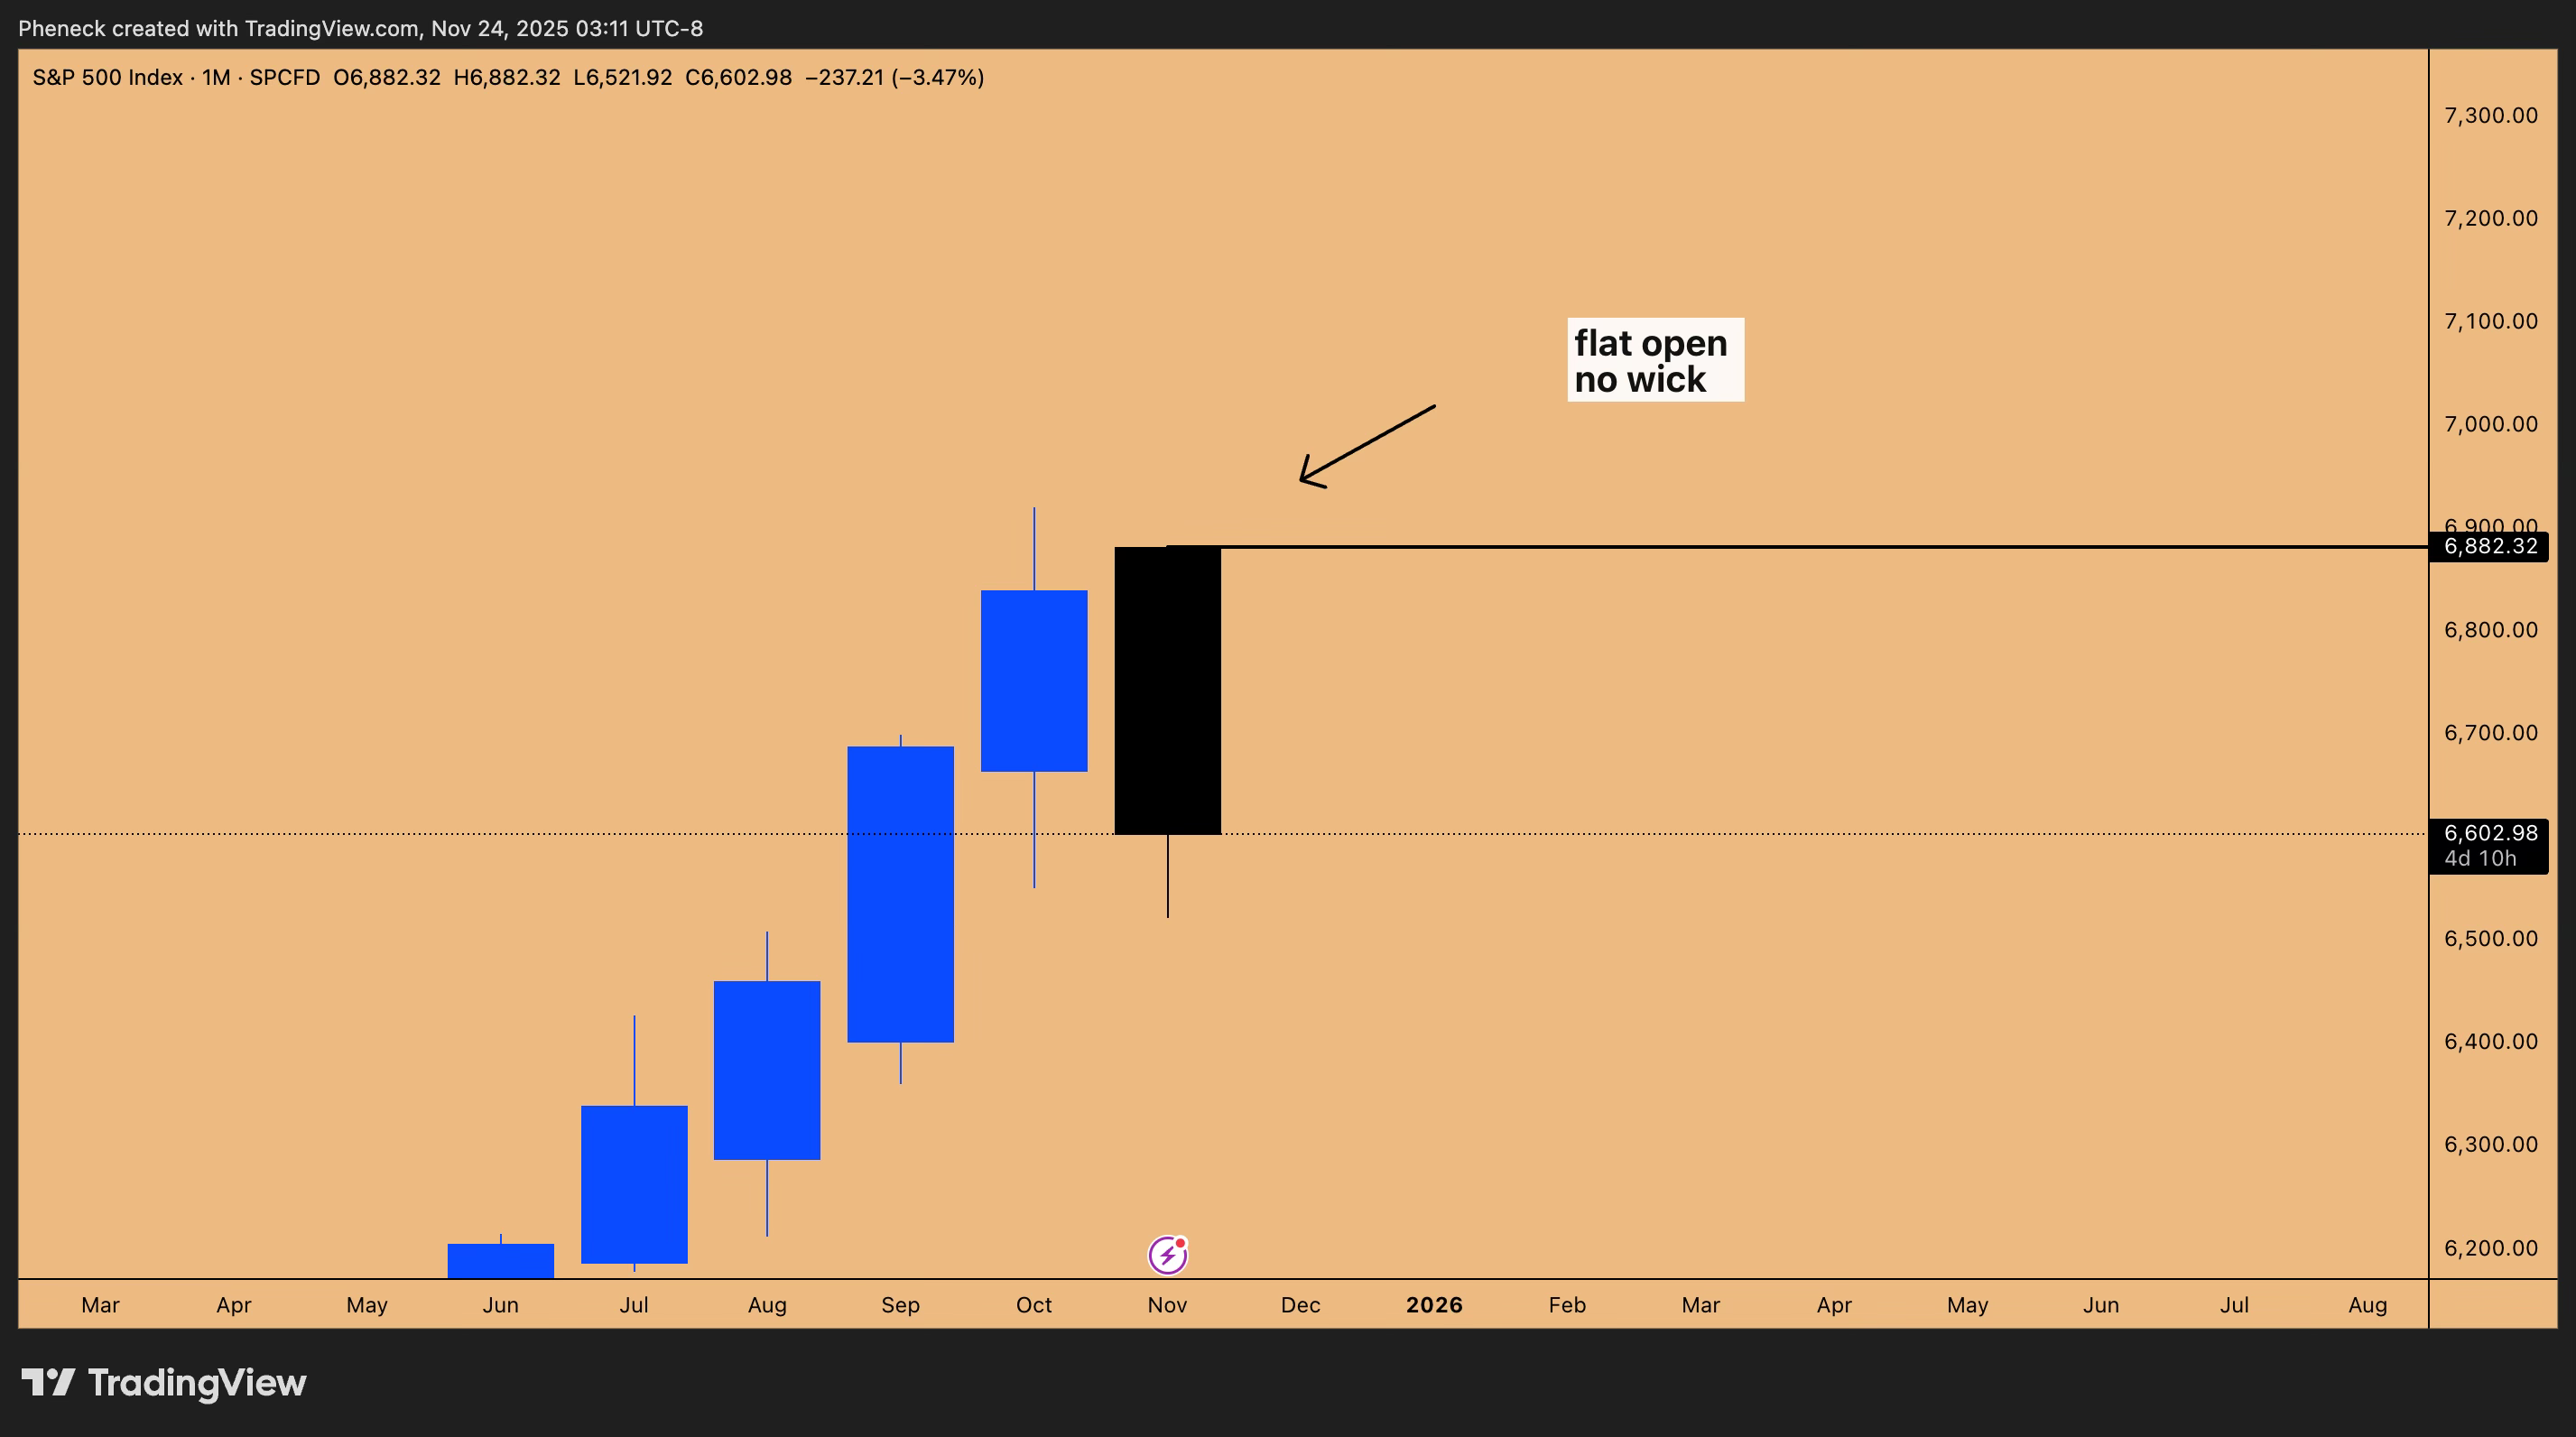
Figure 4: Monthly Flat Open on SPX cash Index
November Seasonality Discrepancy
Looking at seasonality data dating back to 2010 for November:
Bullish Stats: S&P 500 has been up in 12 out of 16 reported months.
Bearish Stats: In the 4 down months, drawdowns were mild (-0.5%, -0.2%, -0.8%).
Current Reality: We are currently sitting at roughly -3.5%.
Conclusion: This deep drawdown is a statistical anomaly. Given there are no systemic failures or plumbing issues, this “reeks of manipulation.” It implies a high probability of a short squeeze into the last week of November to correct this deviation.
₿Bitcoin and Crypto Markets
The Institutional Reset: MSTR vs. iBit
There is a massive reshuffling of institutional capital occurring. We are seeing a leverage unwind in MicroStrategy (MSTR), which caused panic about the broader crypto industry.
The Shift: Institutions are exiting MSTR (which trades at a premium) to load up on the iBit ETF for direct, unleveraged exposure.
Outlook: MSTR may not make new highs, but iBit and the Bitcoin market will. This is a healthy reset for the next leg up.
Bitcoin Technical Analysis
We are currently in a chop zone. The “hot air” zone is between 80k and 98k—there is no trade here.
1. The Bear Case (Short Triggers):
Quarterly Bearish Order Block: Any move to 105k hits major resistance.
Structural Resistance: The zone between 98,240 and 98,898 was previous support; broken support turns into heavy resistance. If we bounce here, it is a short opportunity.
2. The Bull Case (Spot Accumulation):
I am looking for a 30-40% correction to enter long-term spot positions (3-5 year hold).
The Target Zone: 69,000 to 75,000.
The Specific Level: 73,794. This is a powerful, untested SR level.
Liquidity Dynamics: There is a swing low at 74,794. Stop losses are likely sitting at 74,434. I expect the market to run those stops, liquidate positions, and tap the 73,794 support (which aligns with the 2021 cycle high).
Current Status: Bitcoin is showing oversold daily RSI signals and is likely to squeeze in tandem with equities this week, but the medium-term bottoming process will take time.

Figure 5: Resistance zones and Support zones in play for BTCUSD
🧩Altcoin Strategy: Ethereum and Solana
Ethereum: Currently stuck in a “ping-pong” range (25% SR level support vs. resistance). It is forming an inside quarterly candle pattern. I expect ETH to eventually take out lows at 2,374 and 2,621 when Bitcoin tests 74k.
Solana (SOL): Bullish long-term, but currently forming lower highs.
Target: I am eyeing the inside monthly candle lows. If SOL enters the $50–$58 zone (an ~80% drawdown), I will open spot positions.
Risk/Reward: At an 80% drawdown, the downside is zero, but the upside is 4-5x back to all-time highs.
General Rule: Do not try to bottom-catch altcoins. Wait for Bitcoin to bottom first. If you must trade, short the weakest altcoins (like BNB or XRP) if Bitcoin hits the 98k resistance.
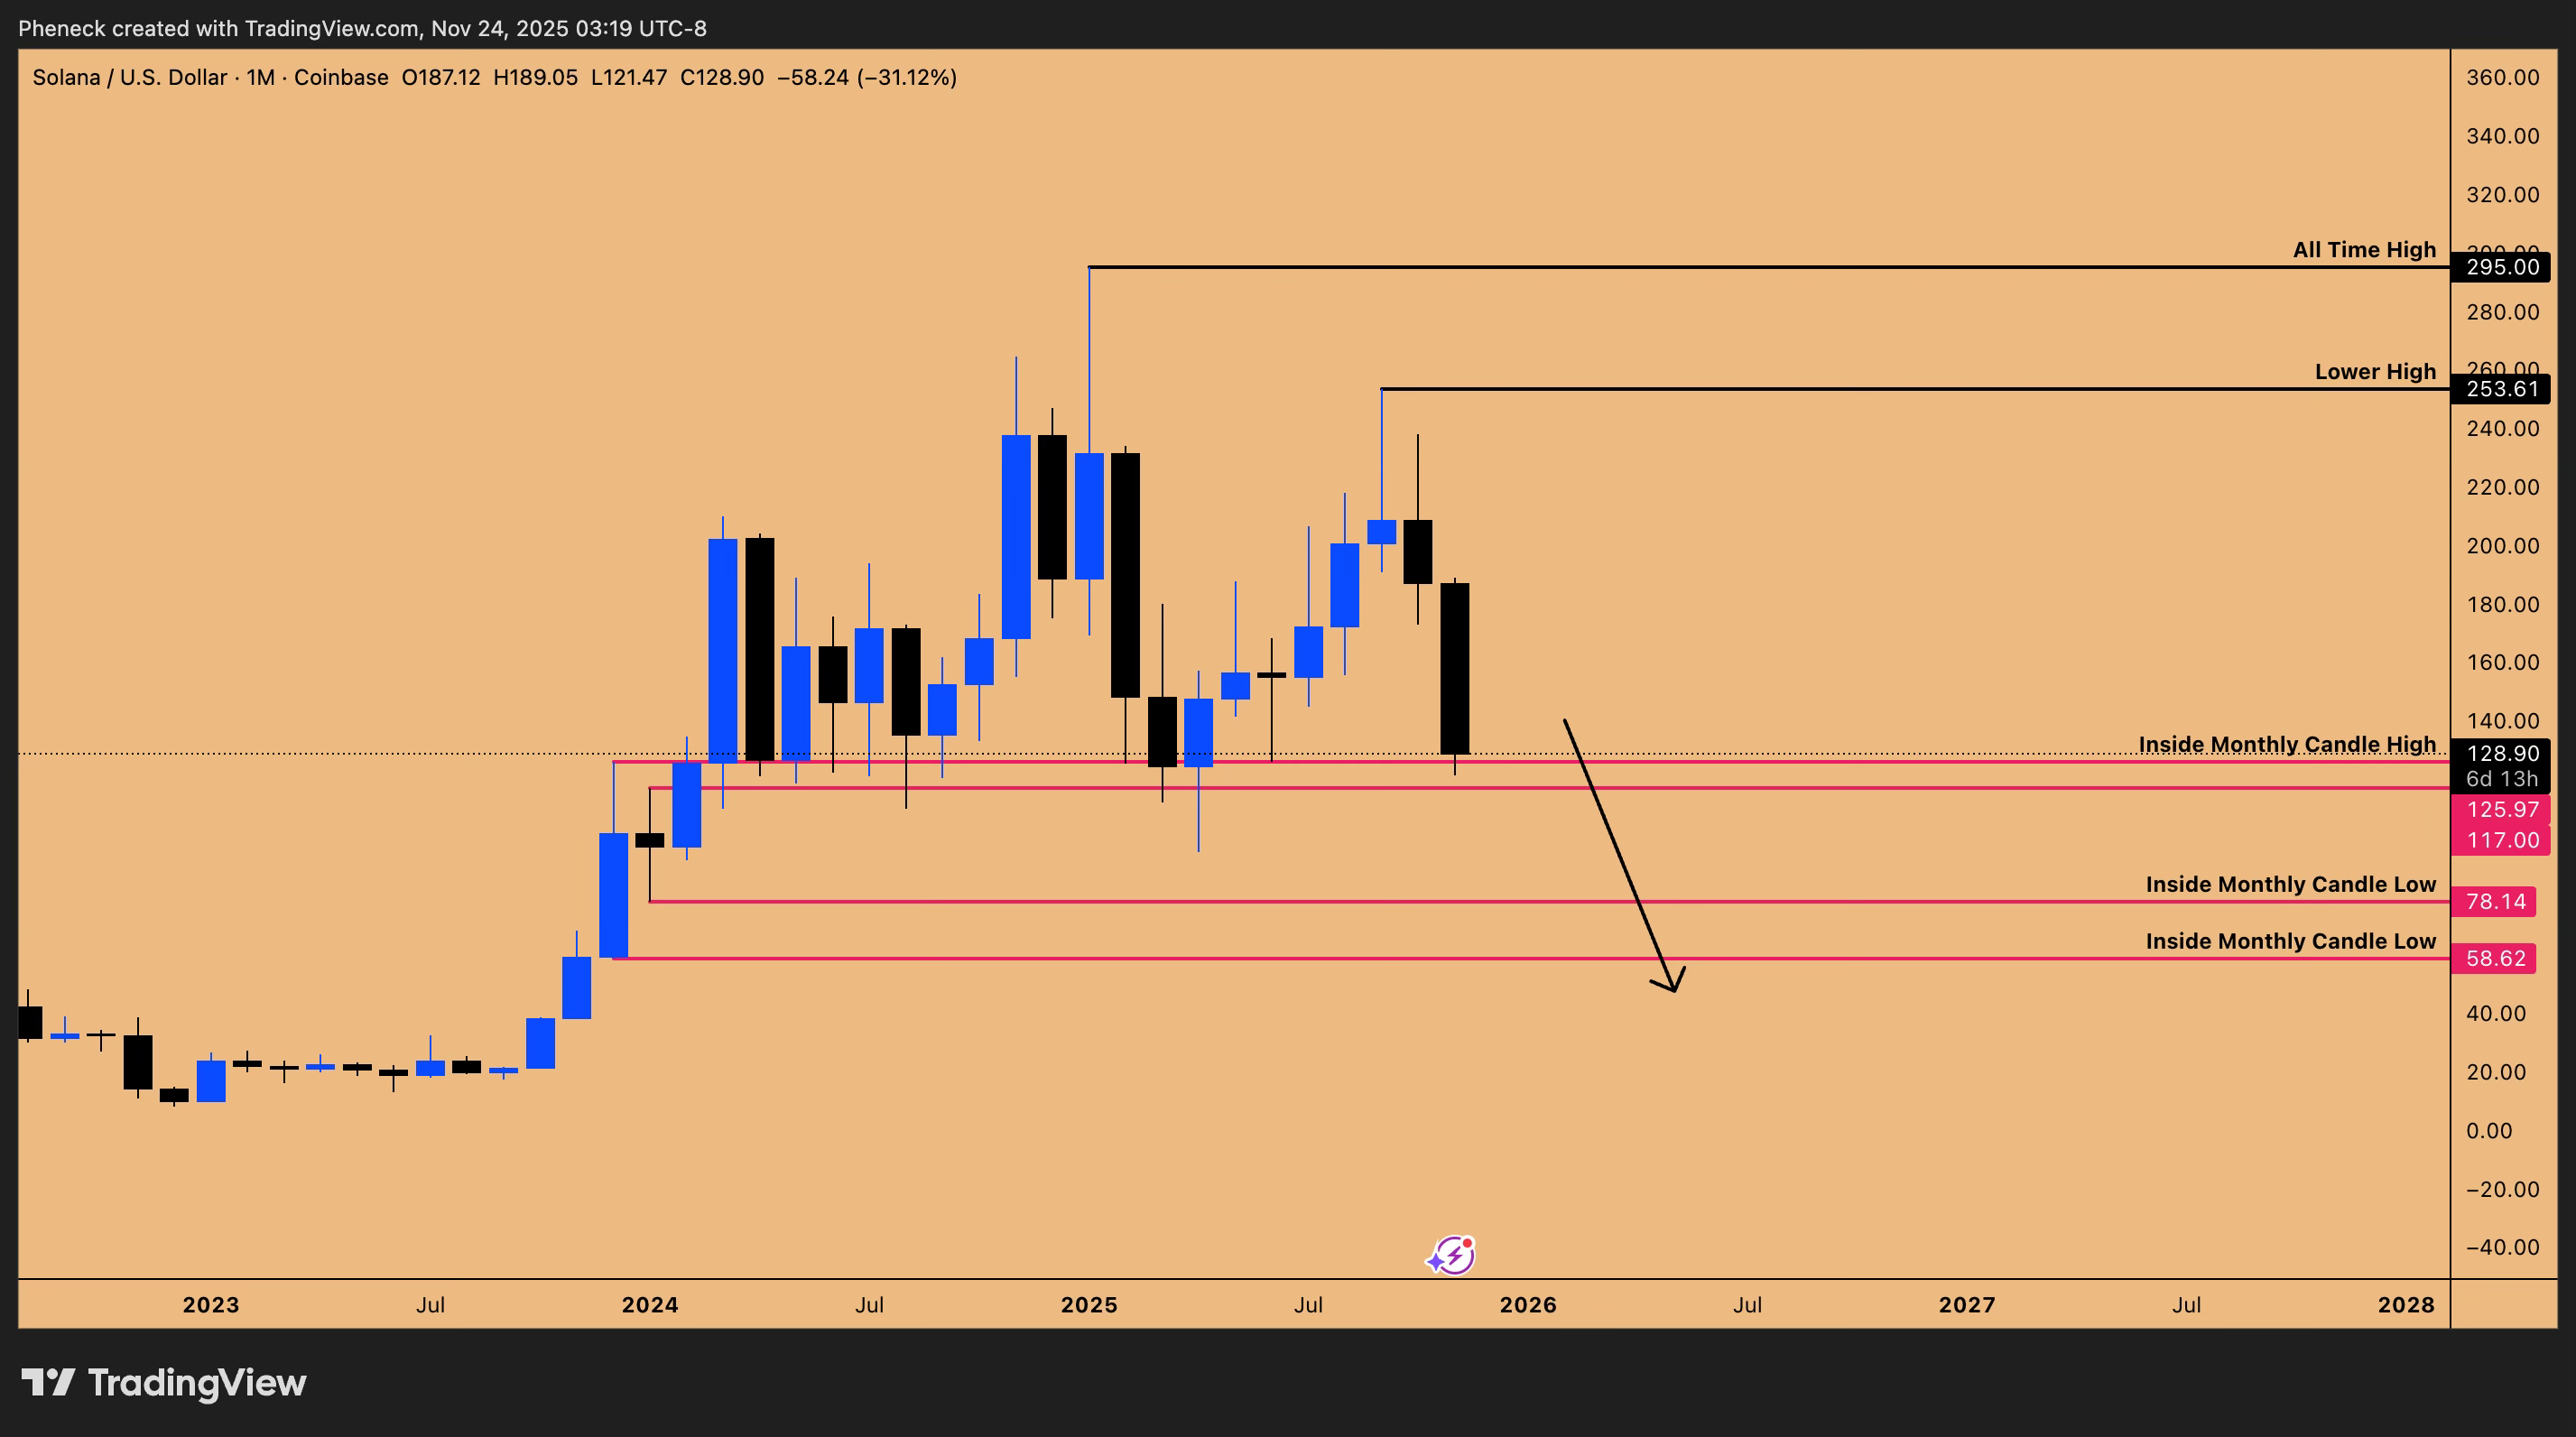
Figure 6: Inside Monthly Candle Lows are the draw on liquidity
⚖️Commodities and Global Indices Setup
DAX: The Mean Reversion Play
The DAX offers the best risk-reward for the week.
Pattern: It is trading in a clear range. We just swept the range low for the first time after tagging the top five times.
Trade: Long from the range low.
Stop Loss: Below Friday’s low.
Target: Mean reversion to the mid-range at 23,754.

Figure 7: DAX mean reversion play
Gold: The Complex Squeeze
Gold is messy but actionable due to multiple “Inside Candle” formations.
The Pattern: Inside 3-week candle, Inside Monthly candle, and an Inside Weekly candle failure (long trigger).
The Trade: Long setup.
Stop Loss: Tight stop below 4,000 (trendline support) or looser stop below 3,928 (monthly low).
Thesis: The monthly chart is creating higher lows. We anticipate an expansion to the upside without running the lows below 4,000 again.

Figure 8: Gold Long setup based on Inside Weekly Candle Failure pattern in play
🏦Individual Equities: The Watchlist
NVIDIA (NVDA) vs. Microsoft (MSFT)
The algorithm has shifted weight from Microsoft to NVIDIA.
Microsoft: Technically breaking down (taking out quarterly order block lows), but we are still holding our position as it is positioned for April, 2026. Selling here means selling into a 6-month bullish order block support (cycle high at 468.35).
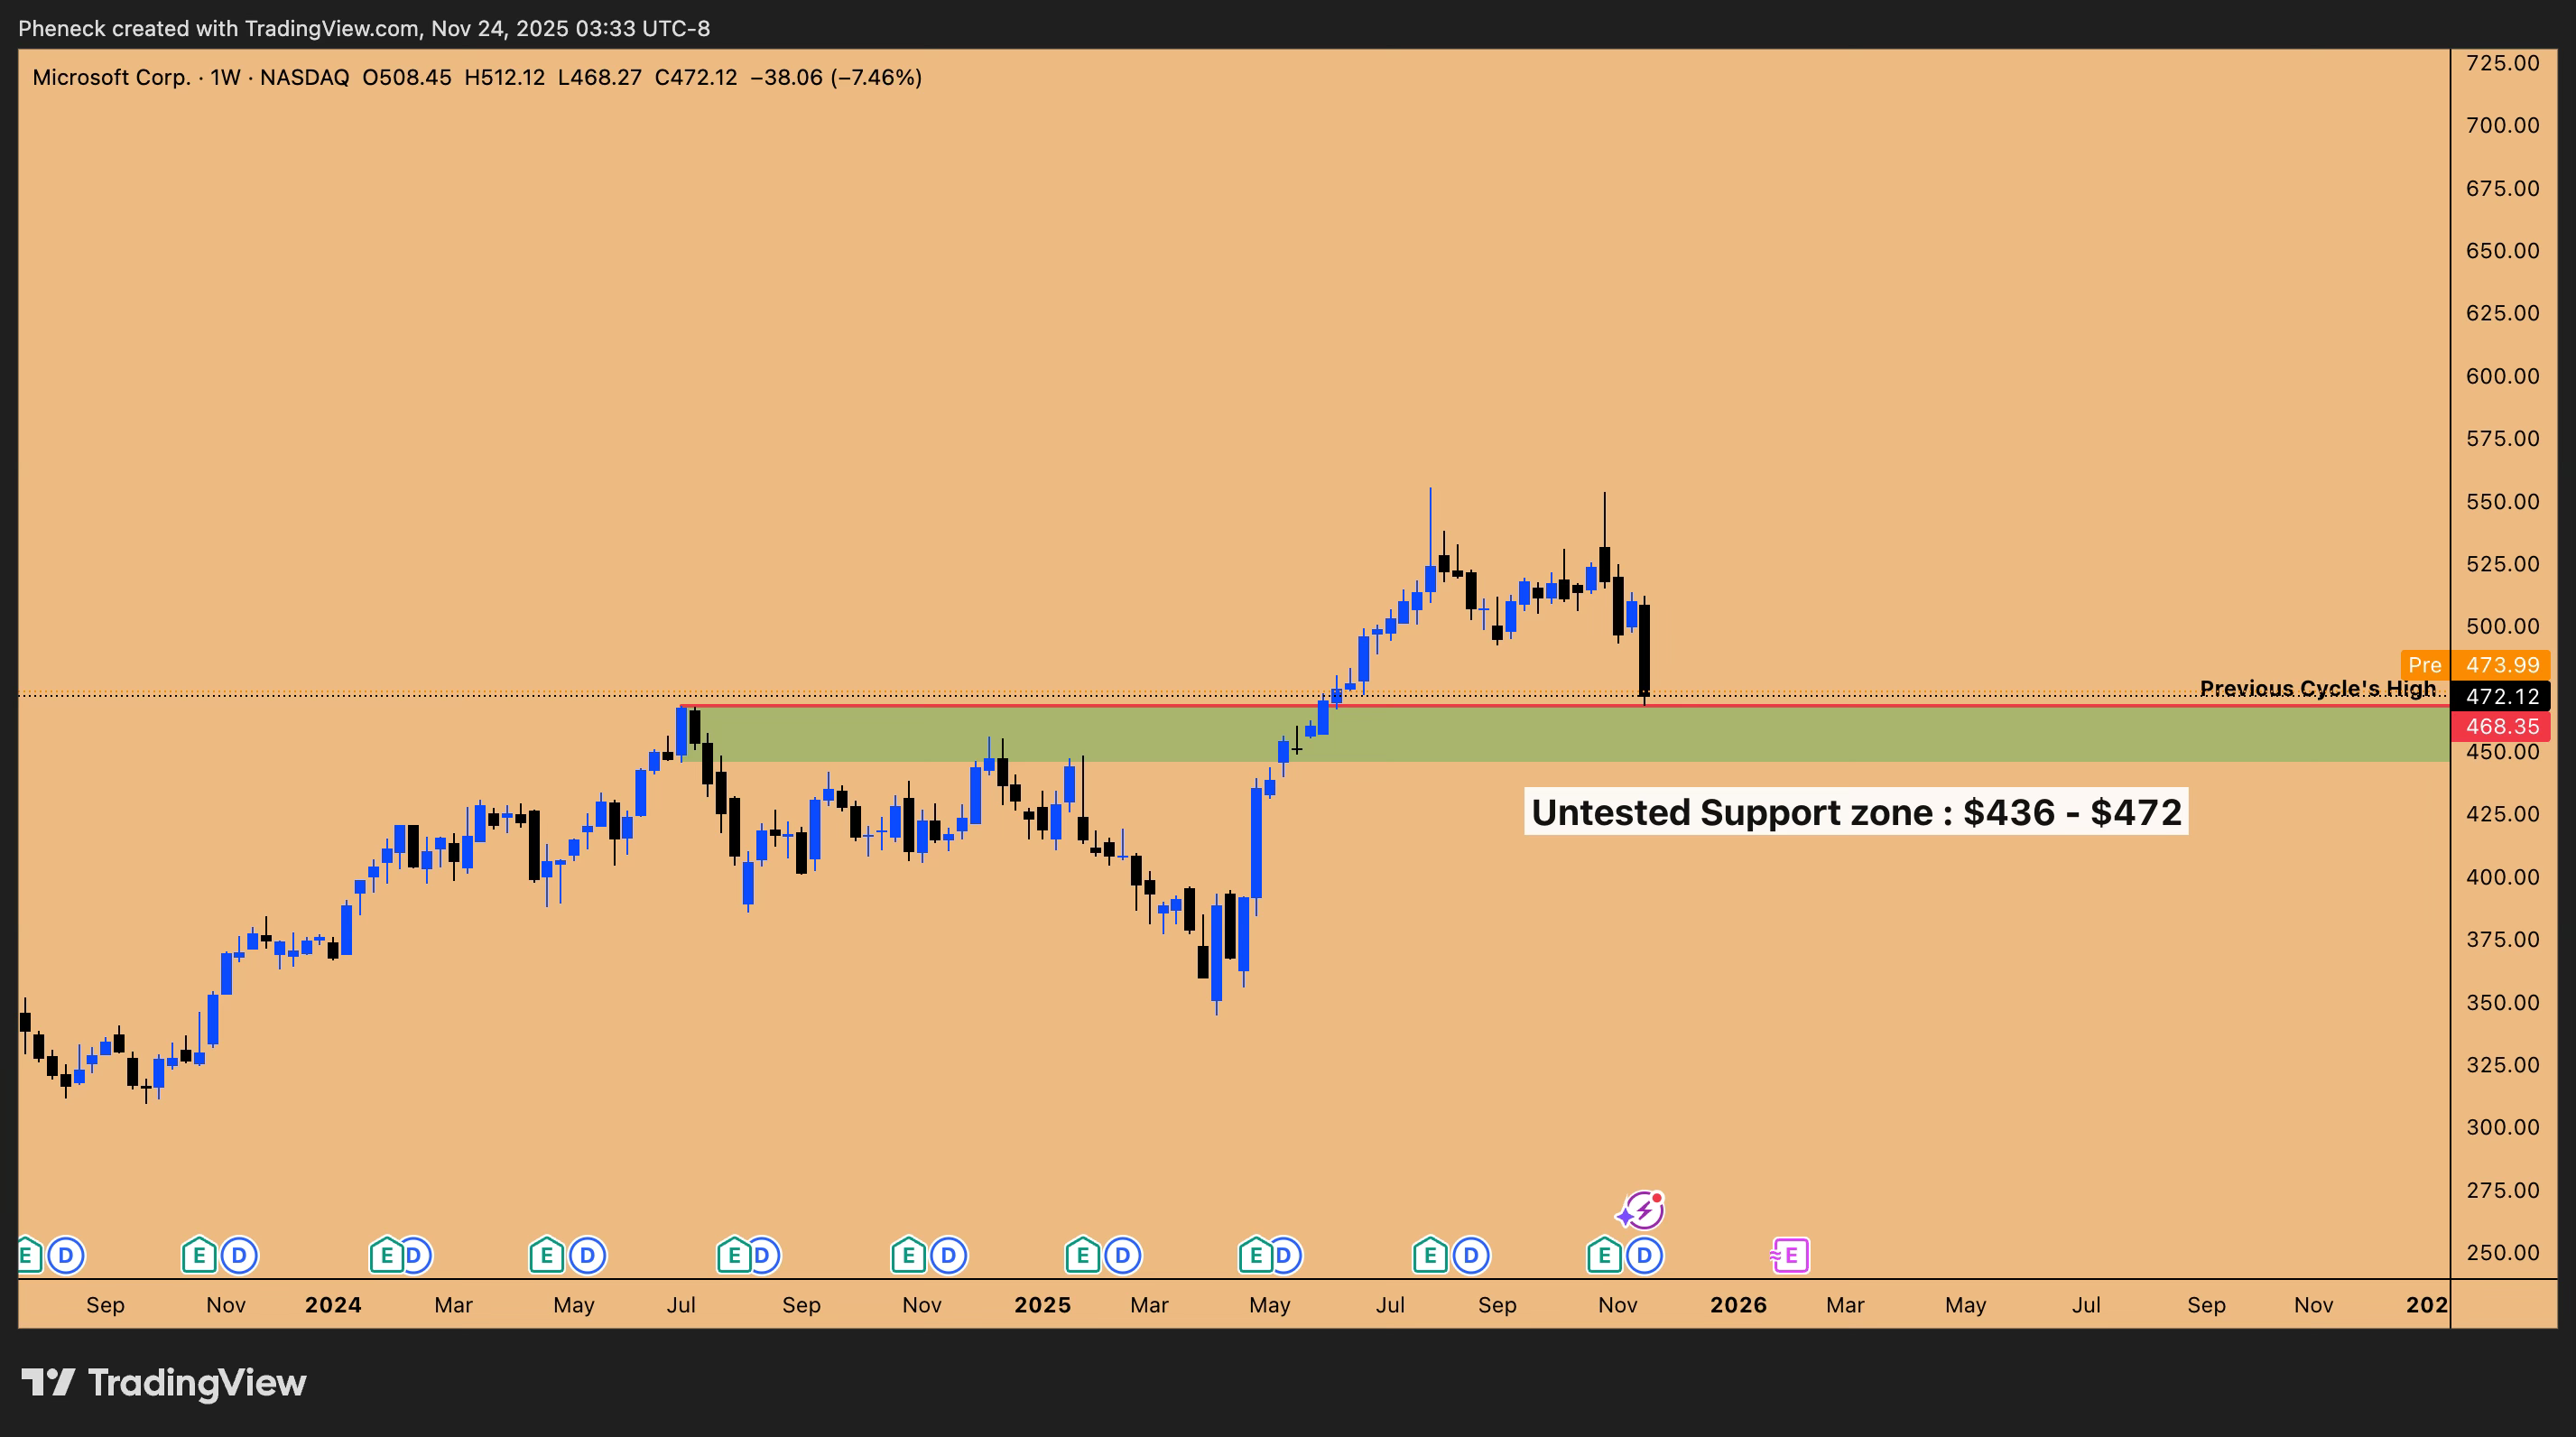
Figure 9: MSFT support zones in play
NVIDIA: Acting as the “General” holding the market up. It formed a daily SFP (Swing Failure Pattern) on Friday, which triggered the broader market reaction.
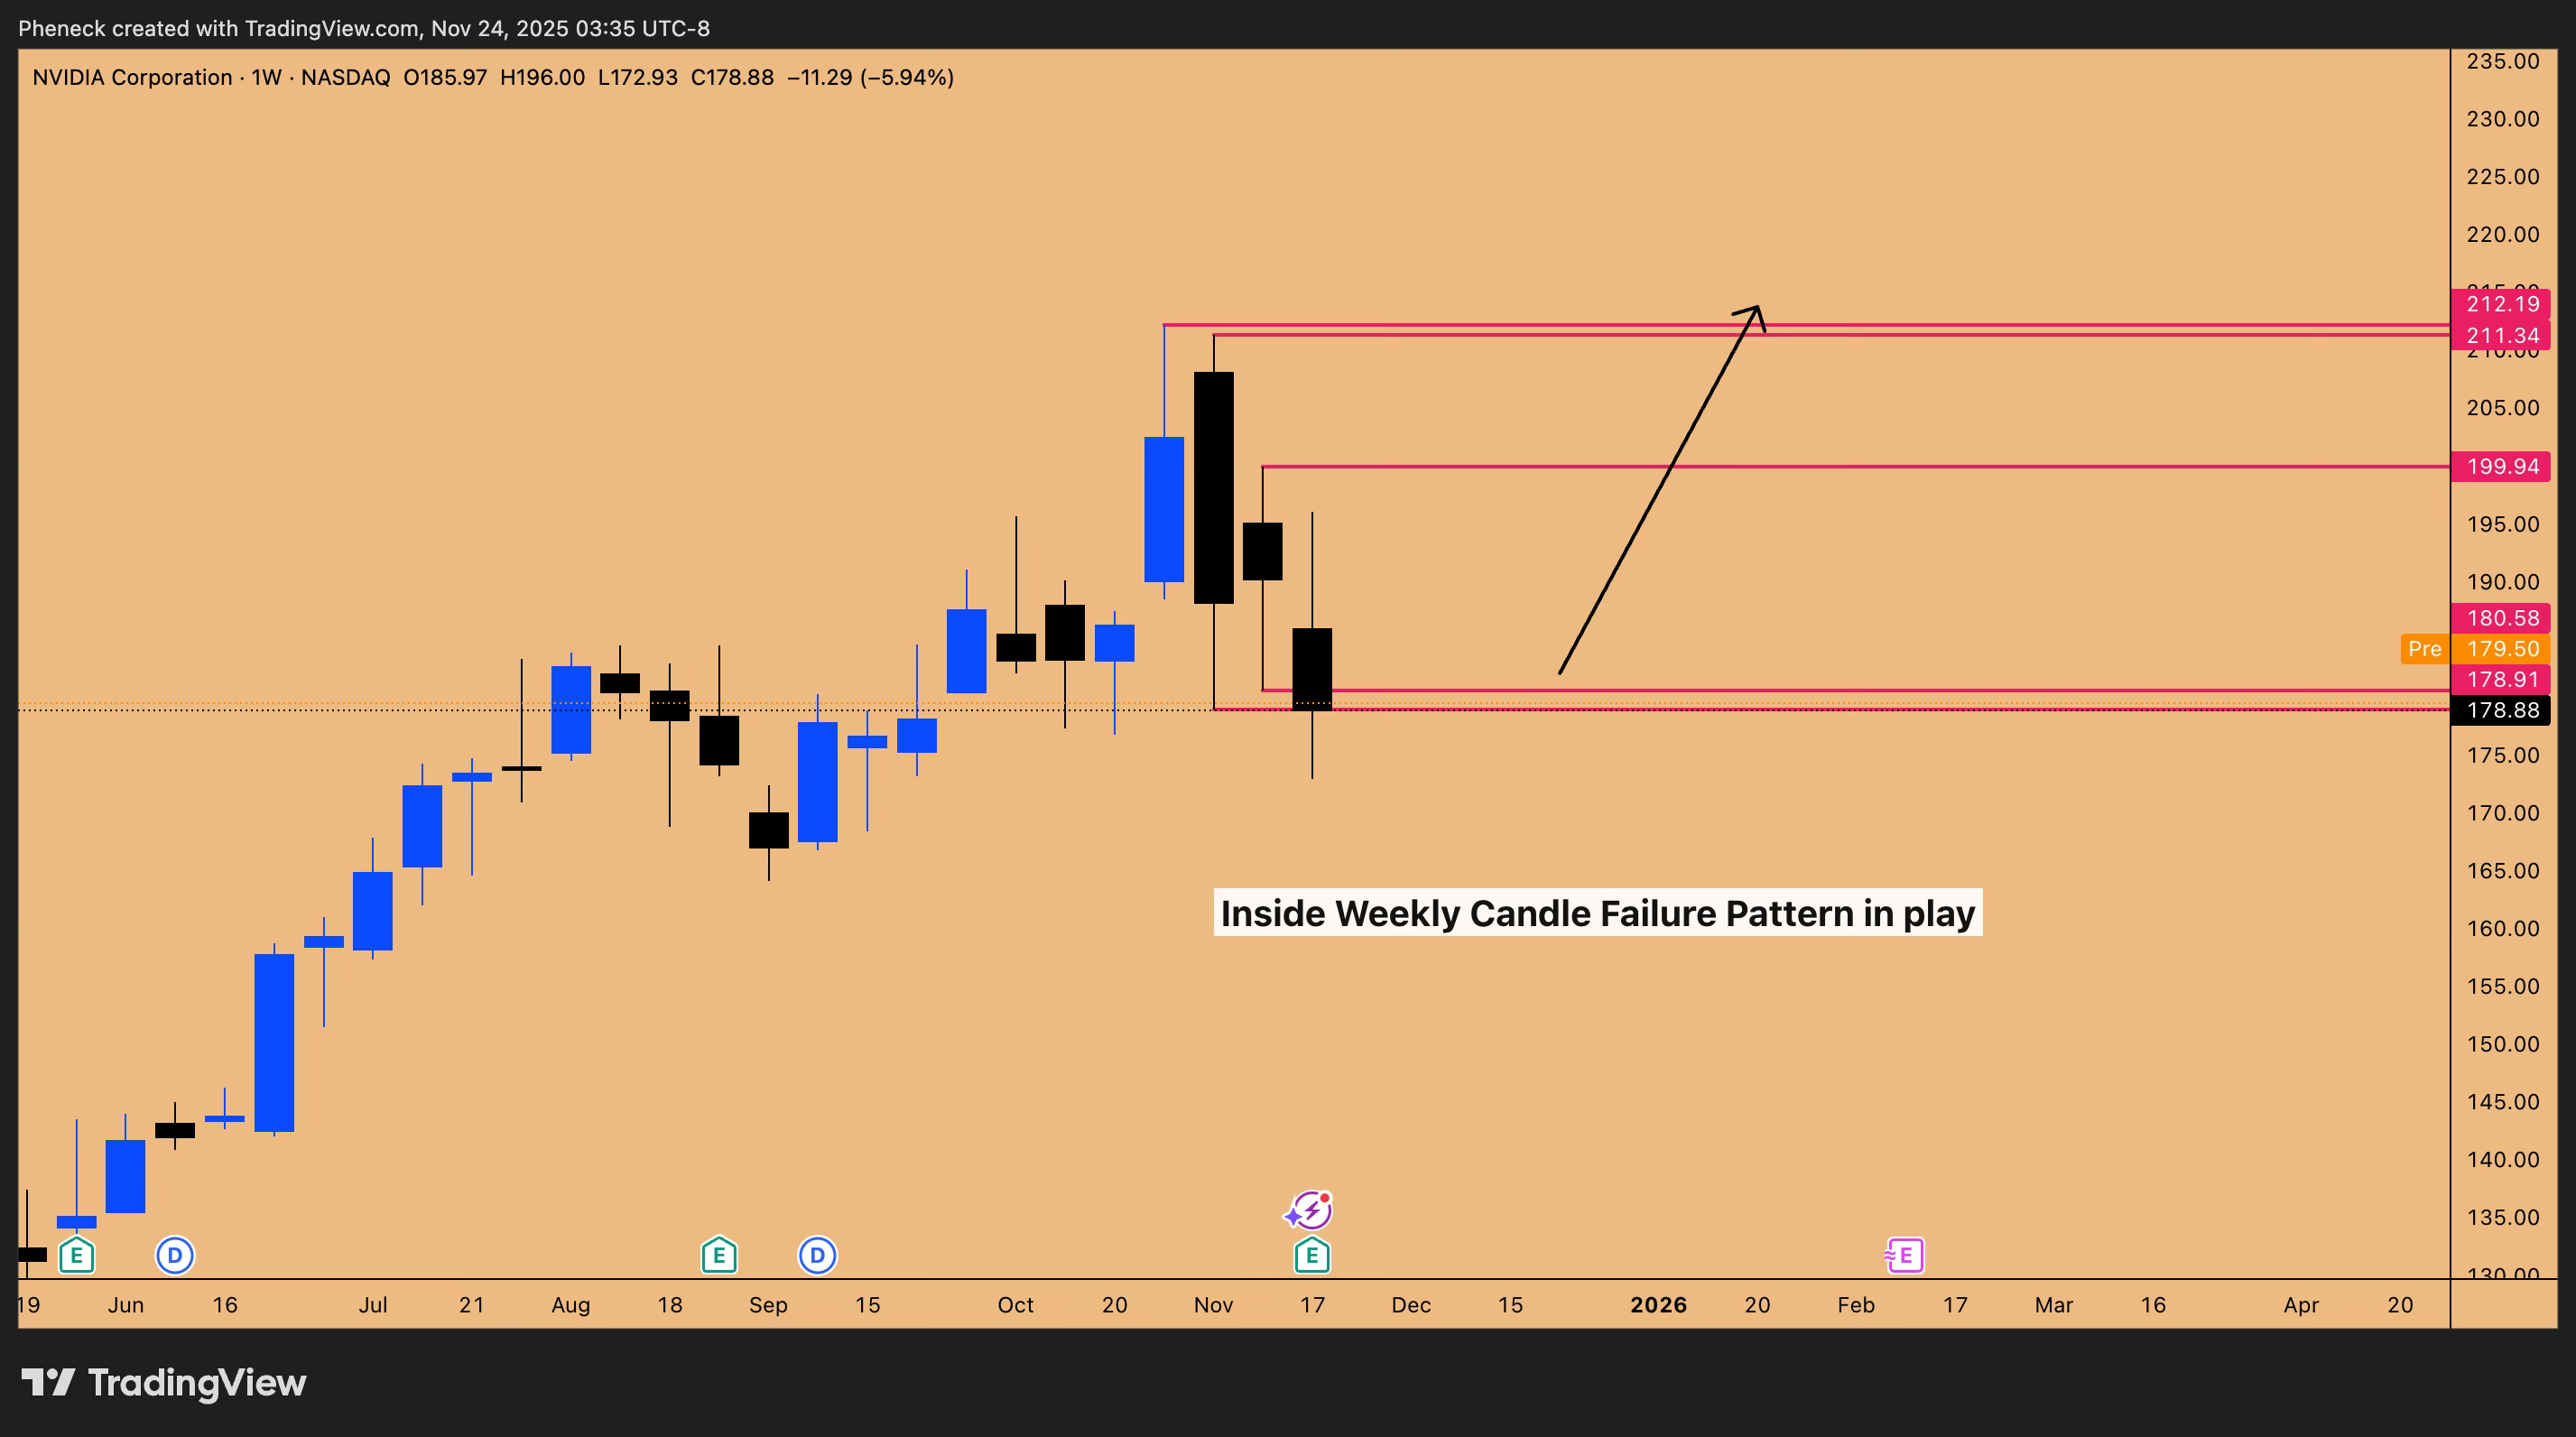
Figure 10: NVDA Inside Weekly Candle Failure Pattern in play
Oracle (ORCL): A Historic Opportunity?
Oracle is down 44%. This is the extreme end of bear market drawdown
Historical Bear Markets: Dec 2024 (-40%), Dec 2021 (-42%), 2008 Crisis (-42%), COVID (-45%).
Insight: Oracle corrections historically cap at 40-45% drawdown. We are currently at the maximum historical drawdown, entering a quarterly bullish order block. For long-term investors, this is the buy zone.
Apple (AAPL): The Silent Bull Flag
While the tech sector battered, Apple consolidated.
Pattern: Inside 4-day candle failure and a massive bull flag.
Price Action: On Friday, Apple erased 70% of Thursday’s drawdown candle. It refuses to go lower.
Outlook: If Apple breaks out of this consolidation, it drags the S&P 500 and NASDAQ higher.
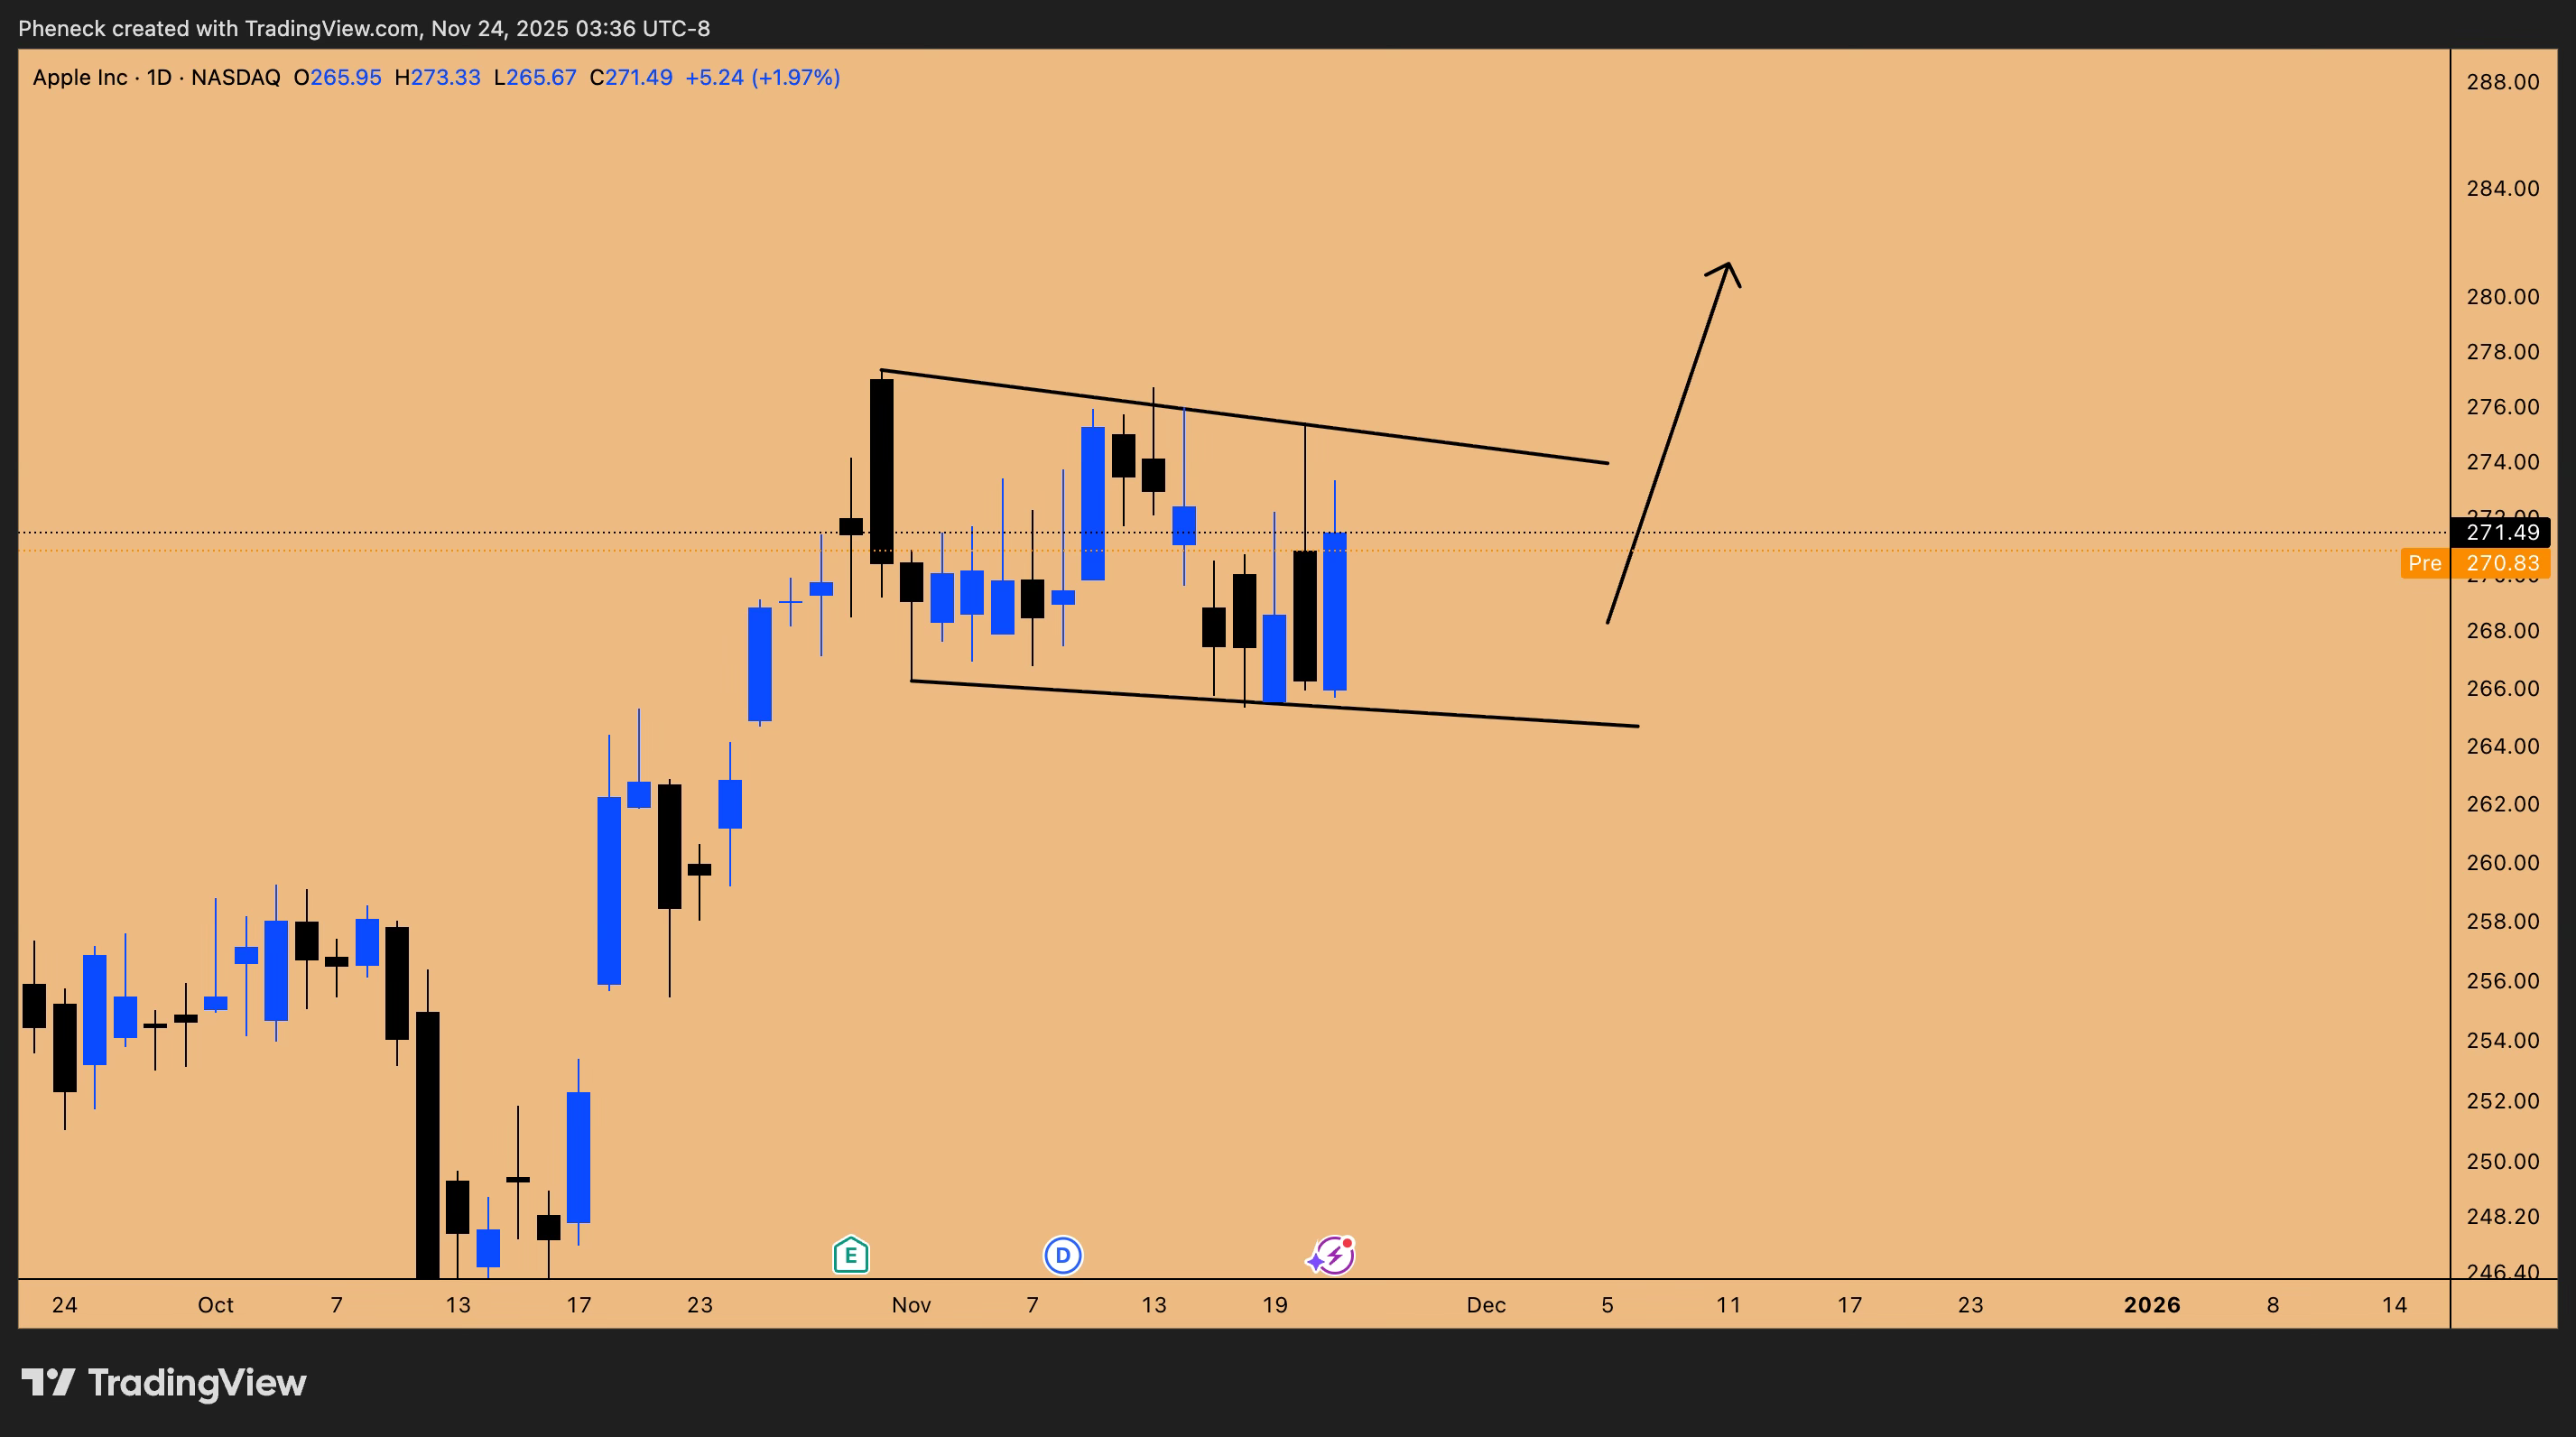
Figure 11: Bull Flag in play for AAPL
Tesla (TSLA): Immune to the AI Trade
Tesla is disconnected from the “AI CapEx” narrative.
Setup: Inside quarterly candle failure.
Entry: Retest of the previous quarter’s high/SR level at 367.
Target: All-time highs at 488.
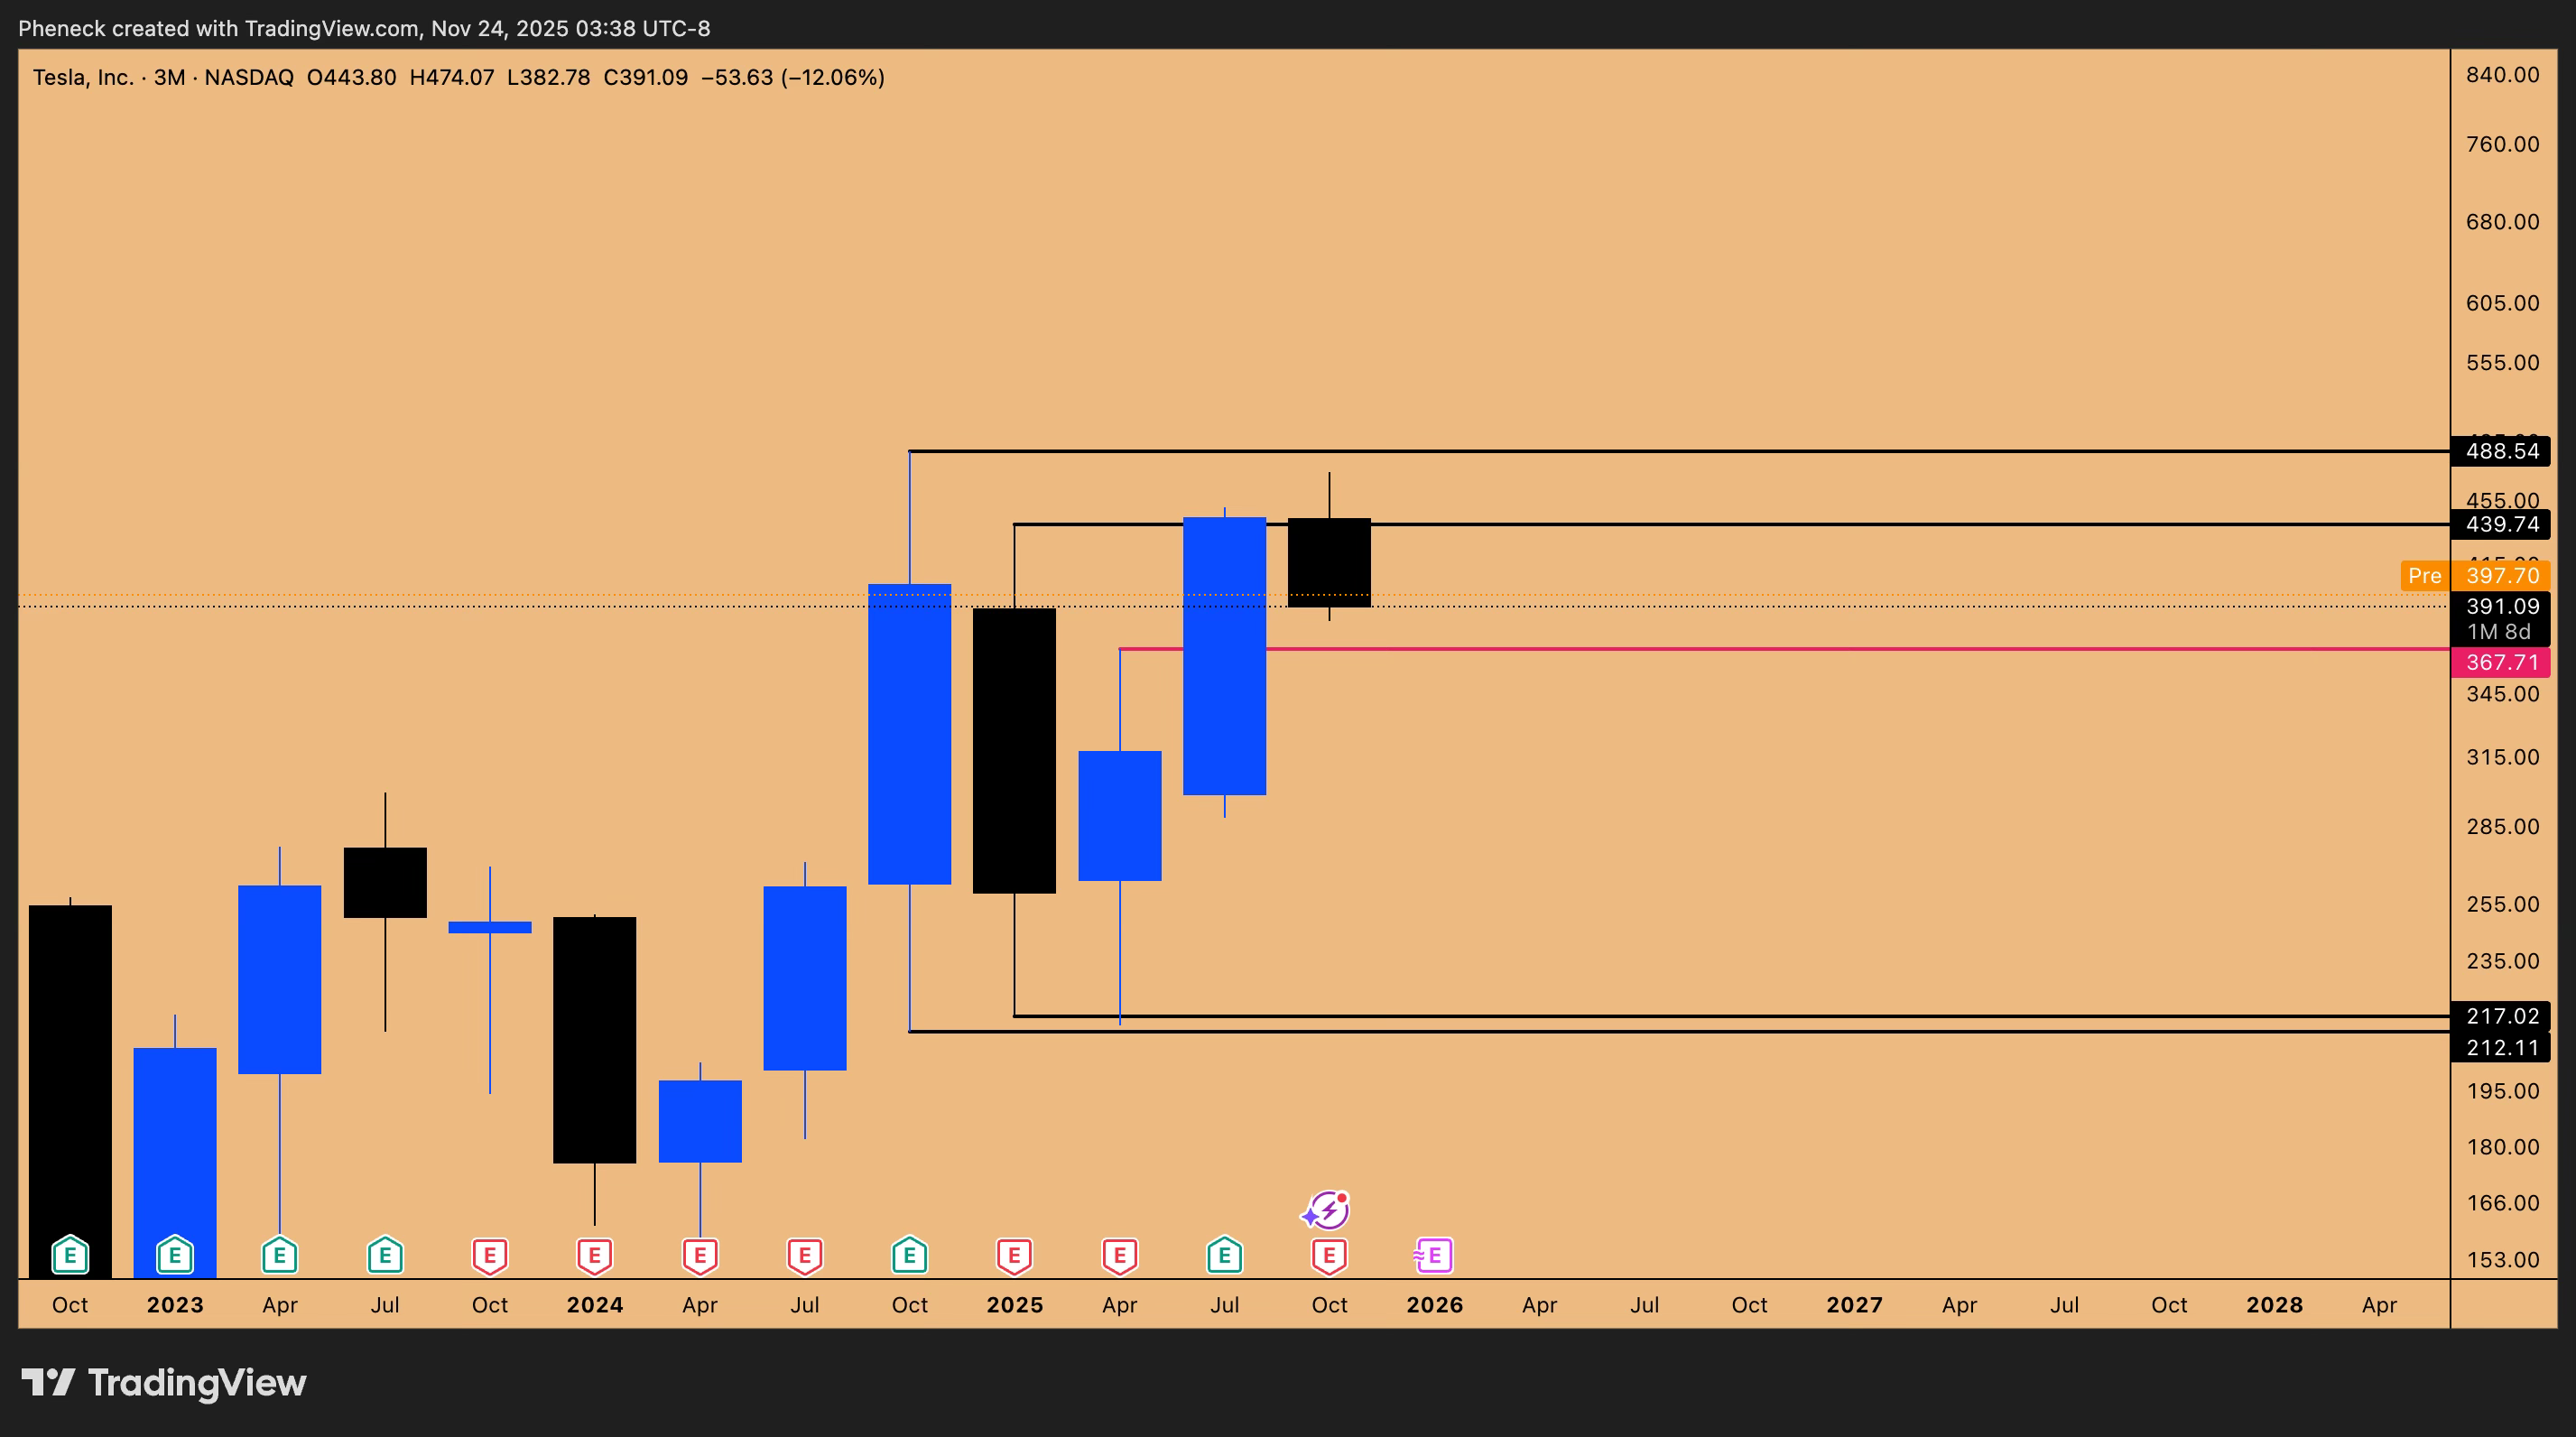
Figure 12: TSLA Inside Quarterly Candle Failure pattern Intact
TE (Tech Energy): The AI Bottleneck Play
I am holding a 5% portfolio position in TE.
Fundamental Thesis: AI is not dead; it is in the “1996 dot-com” phase. The bottleneck for infrastructure is energy.
Outlook: TE is oversold but primed for a 10x return once capital rotates from AI chips into the energy sector required to power them.
✨Key Takeaways and Outlook
As we head into the final week of November, the data points to a sharp reversal of the recent bearish trend.
VIX Deflation: 4 consecutive up candles signal an imminent collapse in volatility.
Seasonality: The -3.5% November drawdown is an anomaly that usually resolves with a squeeze.
Liquidity: The “Flat Open” on SPX (6,882) acts as a magnet for price.
Bitcoin: Ignore the chop (80k-98k). Look to short at 98k or buy spot heavy at 73.7k.
Next Steps: I will be finalizing the alpha for the January 2026 outlook with Miad, as the liquidity burst in Q1 is the “big trade” we are positioning for. For now, watch for the squeeze, don’t chase the shorts, and respect the historical boundaries of the VIX.
What’s your take on these setups? Are you buying the Oracle dip or waiting for Bitcoin at 73k? Share in the comments—let’s discuss strategies.
Disclaimer: This isn’t financial advice – just market musings from the charts. Always do your own research.
If you enjoyed this deep dive, please share it with fellow traders!