

Market Analysis: VIX Deflation, The “Blow-Off Top” December Squeeze, and the 2026 Bull/Bear Line

Executive Summary
This week’s analysis comes with a critical pivot in market structure. Previous week, we identified a rare and potent signal:
VIX deflation. The VIX, often the “canary in the coal mine,” posted a specific patternfour consecutive weeks up, followed by a sharp down candle. Historically, when the VIX breaks a streak like this, it signals an immediate bid for risk-on assets. We are seeing this play out in real-time across the S&P 500, NASDAQ, DAX, and Gold. This was not just a correction; it was a solidified bottom.
In this deep dive, we break down why the recent S&P 500 low is your new “line in the sand” for the bull market extending into 2026. We examine the Gap Fill Mechanics that established the 6774 support zone and why the algorithm will likely defend this level at all costs. The analysis points toward a “blow-off top” scenario in December, driven by political incentives to beat previous yearly returns and the “Magnificent Seven” year-end rebalancing.
However, the outlook is nuanced. While equities prepare for a vertical squeeze, the crypto markets are undergoing a painful but necessary deleveraging event. We explore the Bitcoin vs. MSTR divergence, identifying why a quarterly bearish order block on Bitcoin dictates caution until specific spot levels (69k–74k) are tested. We also cover the “AI Energy Trade” via Uranium, the bullish correlation between Nikkei and NASDAQ, and a high-conviction setup on Microsoft based on 1990s fractals.
Finally, we address the most important trade of the year: doing nothing. We discuss the December 19th Cutoff Rule, detailing the psychological traps of trading during the holiday liquidity drought and why real wealth is built during the year-end review, not on the charts.
The VIX Signal and S&P 500 Technical Outlook
VIX Deflation: The Canary in the Coal Mine
The reversal we witnessed last week was predicated on a very specific, rare pattern in the VIX. The Volatility Index had been up for four weeks in a row. Even during massive crashes where volatility explodes, it rarely sustains an upward trajectory for more than four weeks without a pullback. The fifth week is generally a down candle.
When we spot a down candle on the VIX after such a streak, it essentially means the S&P 500 catches a bid. This deflation in volatility is the green light for risk-on assets. It is why we successfully called the long setups on the DAX, S&P 500, NASDAQ, and Gold. The timing of OpEx (Options Expiration) coincided perfectly with this VIX deflation, marking the end of the correction.
The New Bull/Bear Line: 6774 Support
You must treat the recent bottom as a floor that will not be breached for months, potentially until 2026. Here is the technical reasoning:
The Gap Fill: When the S&P 500 corrected, it came down precisely far enough to fill a wide open gap left in the market. Once that inefficiency was filled, the algorithm had no reason to push lower.
Inside Weekly Candle Failure: After filling the gap, the market printed an inside weekly candle failure. This action created a bullish order block.
This support zone at 6774 is now your defining Bull/Bear line. If you are listening to doomsday predictions about an AI bubble burst or a recession, understand that those scenarios only become valid if this support zone breaks. As long as we hold above this level, we are building a higher base.
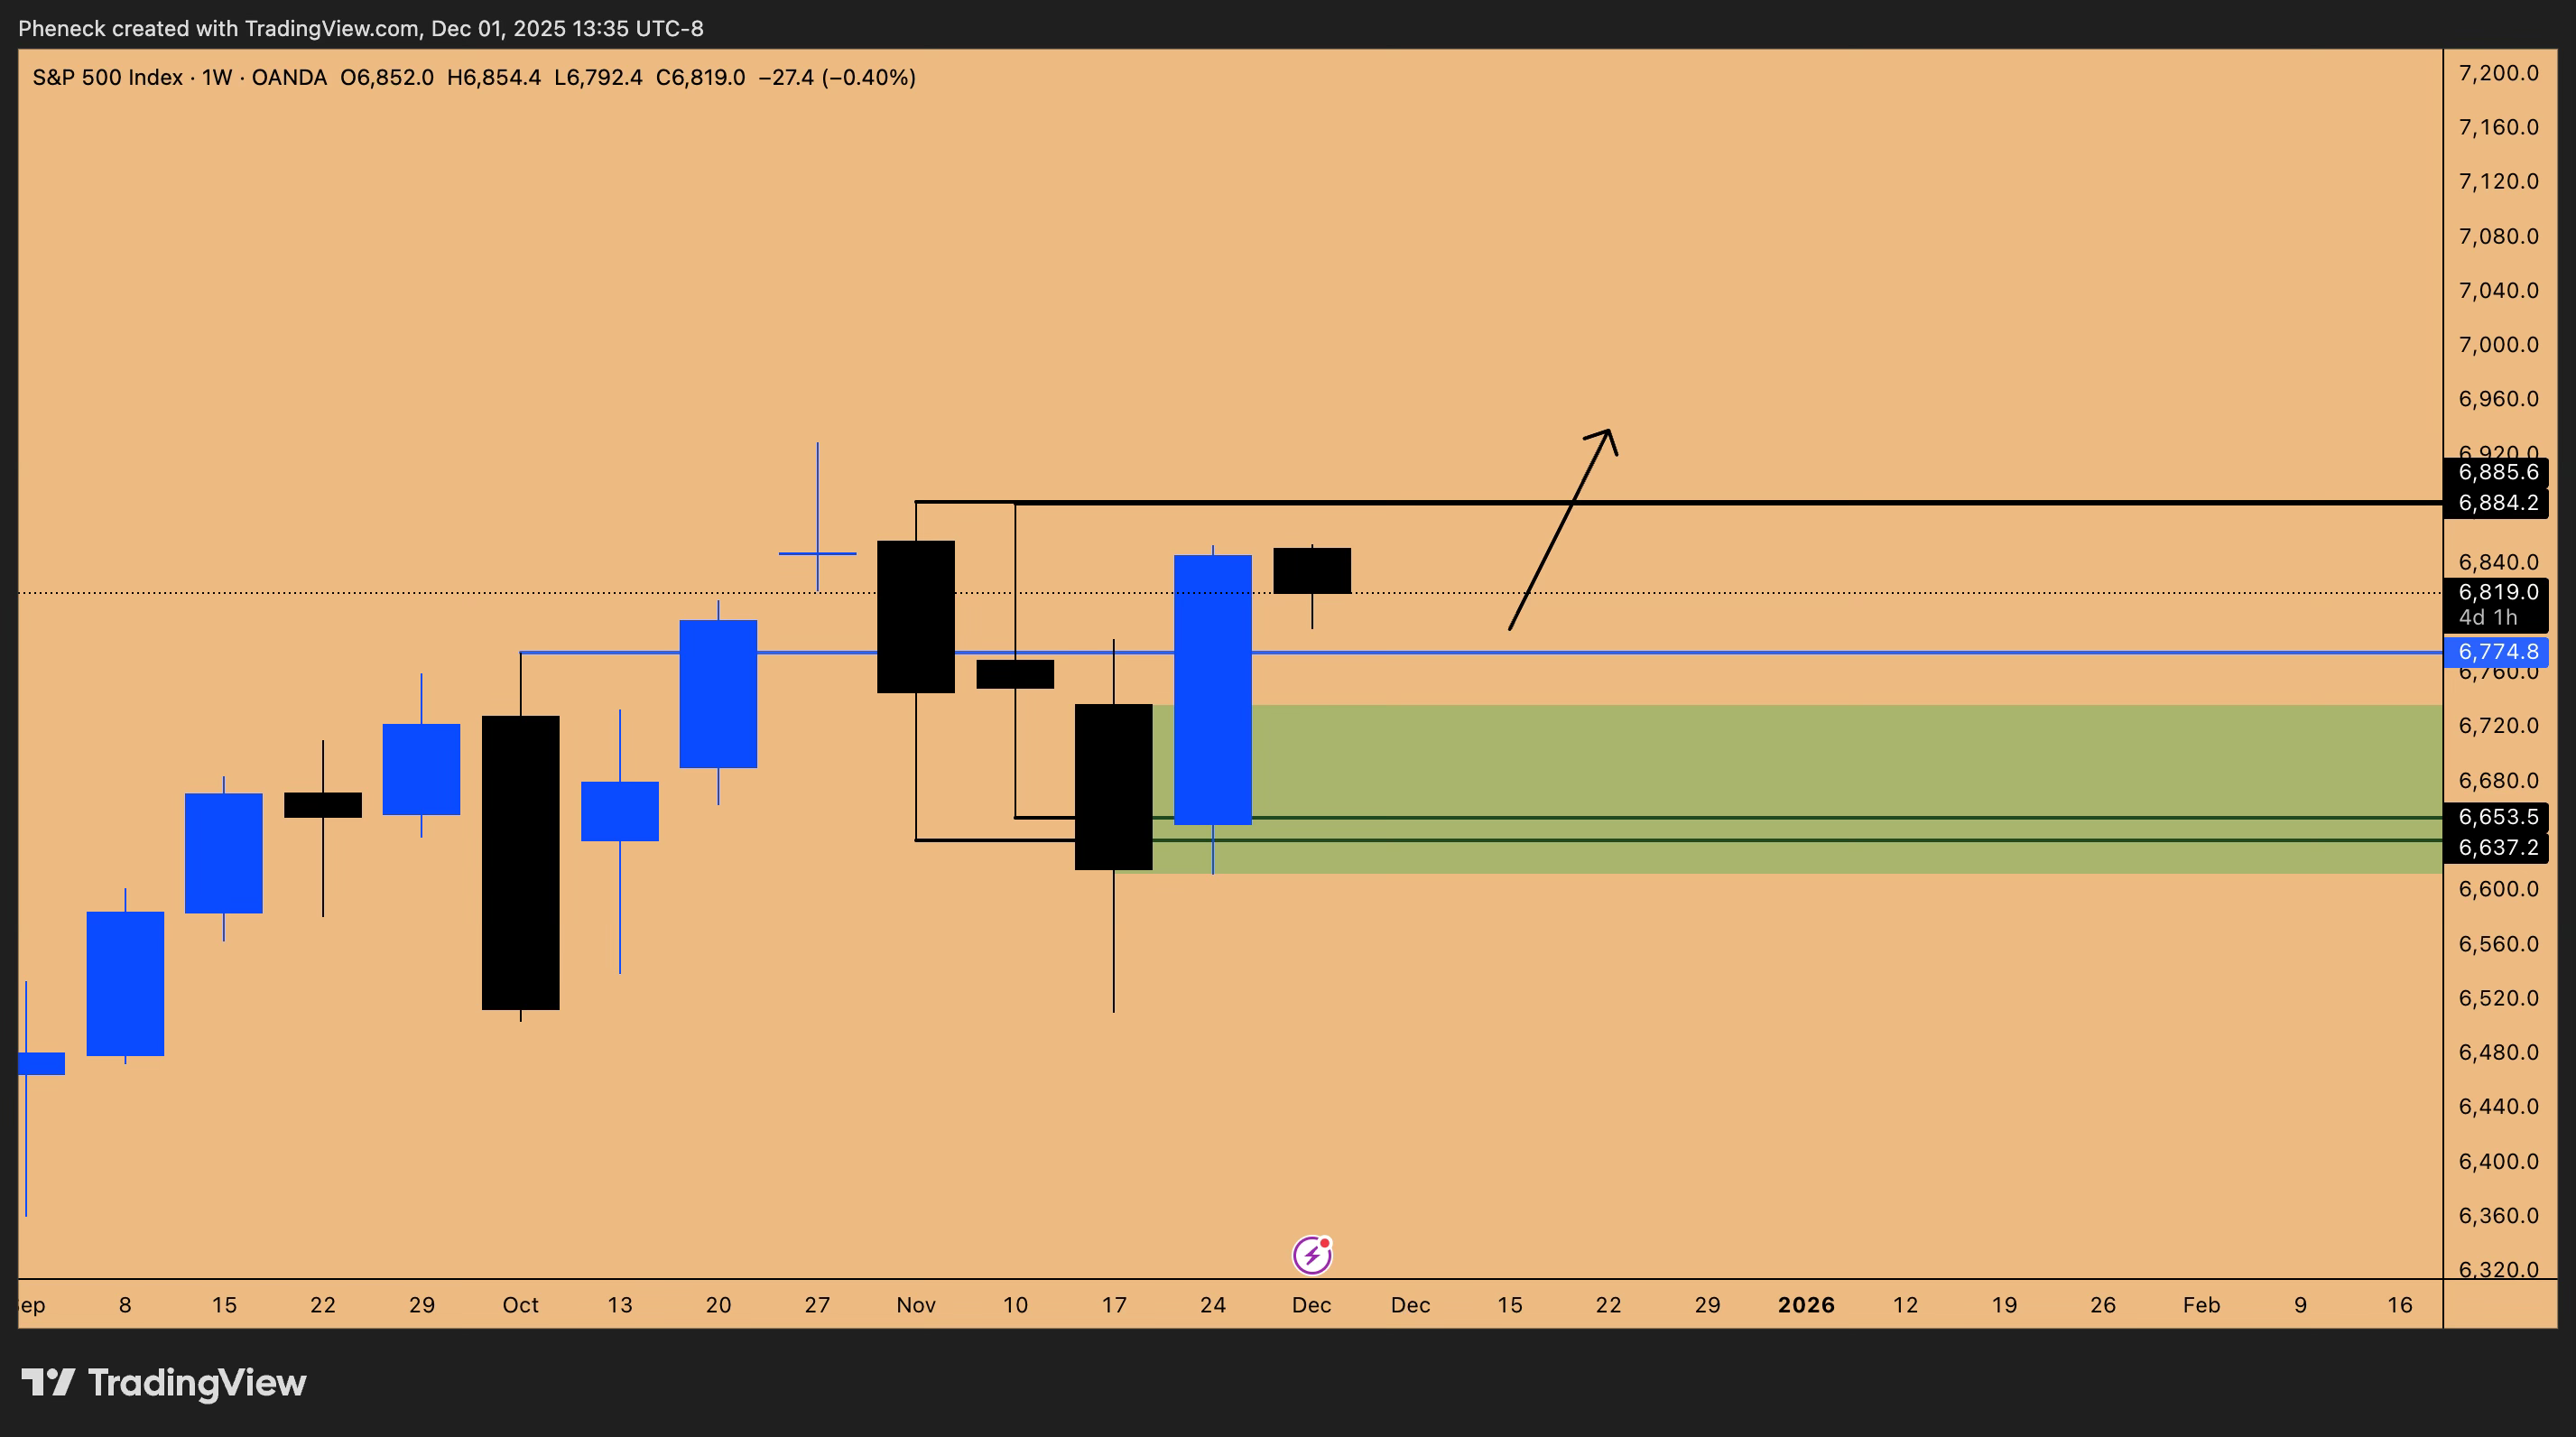
Figure 1: SPX500 outlook for Month of December, 2025
Q1 2026 Implications and Targets
We are currently in a “blue sky breakout” zone. The immediate draw on liquidity is the equal highs at 6885. However, the algorithm will not stop there; it will inevitably target the all-time highs at 6929.
Looking ahead to the first quarter of 2026 (January, February, March), this current quarter’s low—which was put in last week—serves as the reference point. To maintain a sustainable bull trend entering 2026, the market must not breach the previous quarter’s low. Therefore, the 6503 quarterly low is critical. If we see a pullback after making new highs, the re-entry for longs going into 2026 will be at the 6774 support level.
The December Squeeze: Catalysts and Mechanics
Historical Parallels: October 2021
The current price action is mirroring the fractal from October/November 2021.
The Fractal: In September 2021, we saw an initial leg down, a massive bounce, and then a sharp second leg down.
The Reaction: Following that structure, the S&P 500 entered a massive short squeeze.
We are currently in the middle of a similar squeeze. The market has printed four consecutive daily candles to the upside. The key technical trigger here is the breach of the lower high. Once a lower high is breached, market structure shifts bullish, and algorithms begin chasing momentum. This results in a “blow-off top” where the market turns into a rocket ship, overshooting logical targets and ignoring overbought conditions.
I am 70-75% confident we could see the S&P 500 trade at 7,000 by the first week of December.
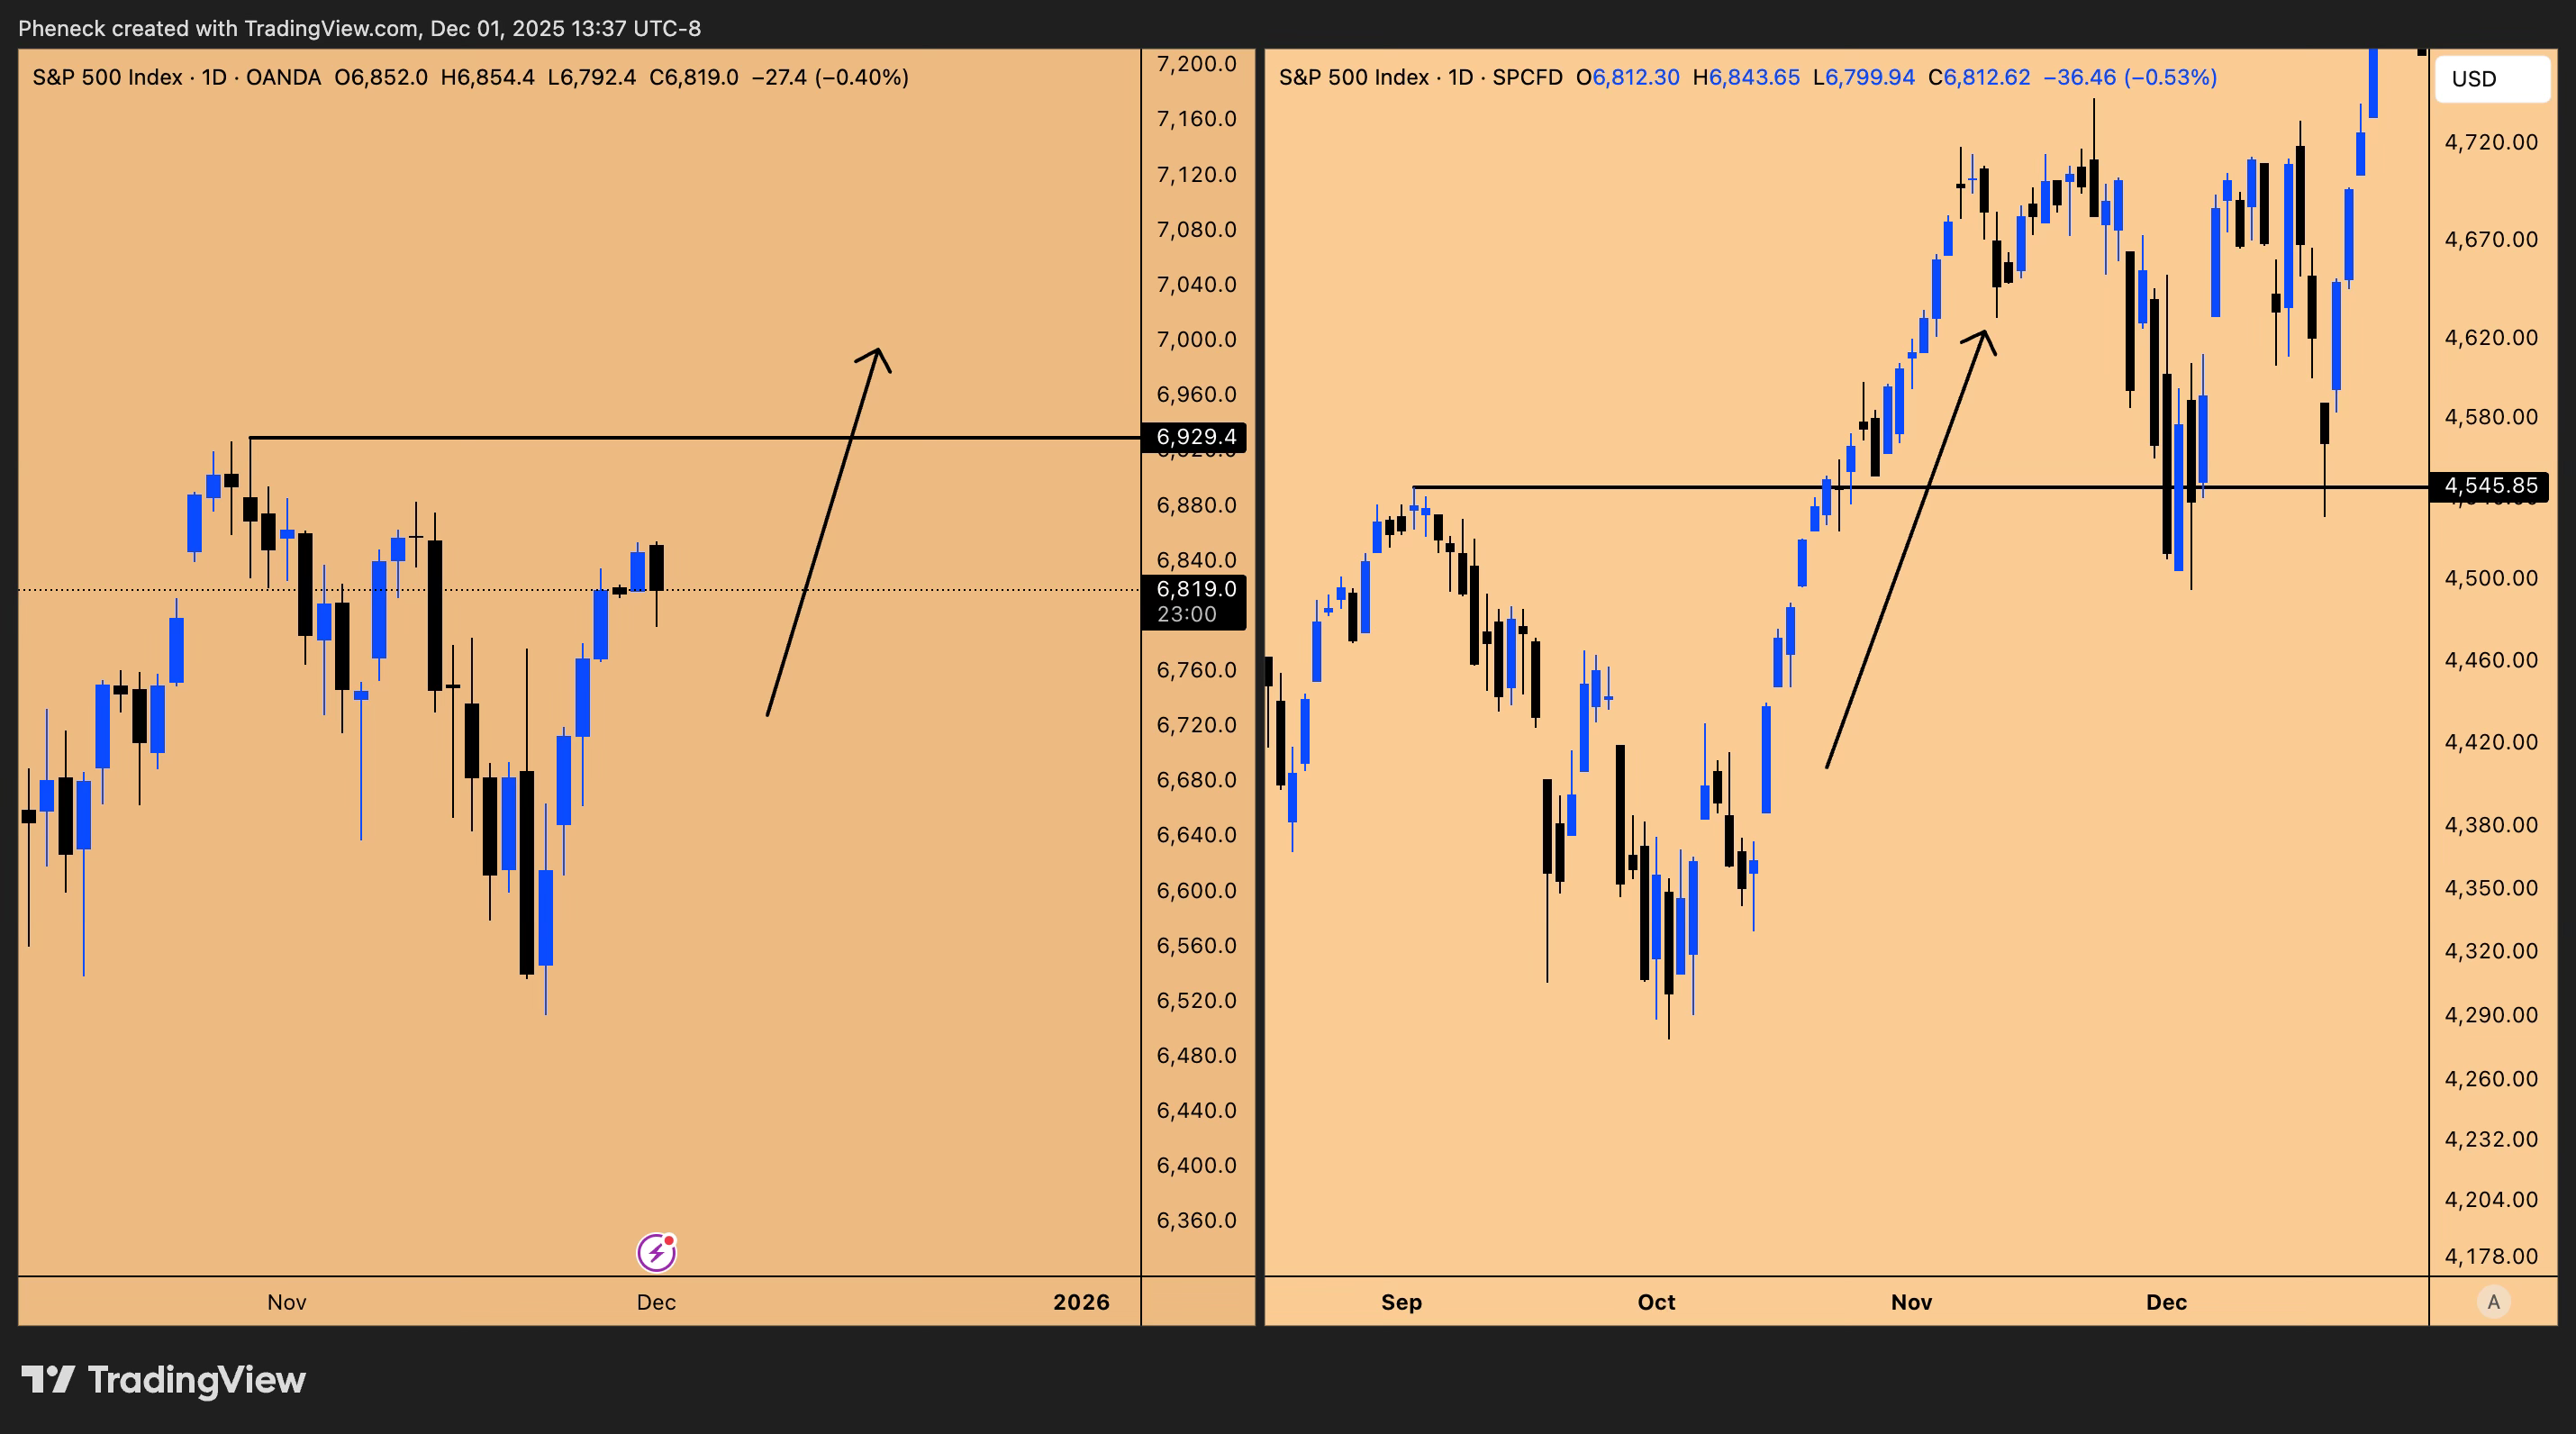
Figure 2: SPX500 (2025) vs SPX500 (2021)
Political Incentives and Seasonality
While seasonality usually calls for weakness in September (which we didn’t get) and strength in Q4, the correction finally arrived in November. Now that it is done, we are entering the “rising phase” of seasonality.
There is a strong political incentive driving this. The S&P 500 is currently sitting at a ~16% return year-to-date (YTD). The current administration is hellbent on ensuring 2025 performs better than the previous year (2024 saw ~24% returns) to secure “brownie points” for upcoming midterm elections. Expect:
Narrative pushes regarding trade deals.
Hints at stimulus (e.g., “$2,000 stimulus checks in Q1”).
Aggressive “juicing” of the markets to close the gap between the current 16% return and last year’s 24%.
Year-End Rebalancing and The “Magnificent Seven”
A massive mechanical flow of capital occurs in December: Year-End Rebalancing.
Pension funds, portfolio managers, and institutions must position themselves for Q1 2026. They will:
Sell assets that underperformed this year.
Load up on assets that overperformed.
Who overperformed? The “Magnificent Seven” (Nvidia, Microsoft, Apple, Amazon, Meta, Google) and heavy hitters like AVGO. As managers crowd into these top 10 NASDAQ companies to show them on their books for the new year, the indices (S&P 500 and NASDAQ) get bid up mechanically. This is why you cannot short the index going into year-end.
Crypto Analysis: The Great Deleveraging
Bitcoin’s Bearish Order Block
Bitcoin is currently flashing a warning signal on the highest timeframes. We are closing the current candle as a Quarterly Bearish Order Block. This is incredibly rare.
Historical Context: The last time we saw a bearish order block on a high timeframe (Monthly), price did not just reverse; it tested resistance, rejected, and trended lower.
Implication: A quarterly signal trumps monthly signals. I do not expect Bitcoin to make a new all-time high anytime soon. It will likely require one or two quarters of sideways accumulation to rinse out leverage.
The MicroStrategy (MSTR) Factor
Bitcoin is undergoing a deleveraging event caused by MicroStrategy (MSTR).
Correlation: MSTR topped on July 25th; Bitcoin topped on July 25th.
The Drag: MSTR has been trending down, and Bitcoin is “catching up” to this downside.
The End Game: For Bitcoin to bottom, MSTR likely needs to be “gutted”—potentially delisted or removed from the institutional complex. Once MSTR is no longer a leverage vehicle, Bitcoin can become a free-floating asset (like Gold), driven by the IBIT ETF rather than leveraged entities.
Spot Buying Zones and Market Structure
Despite the bearish short-term view, the macro is bullish (5 consecutive 6-month bull candles, an 1100-day bull run). We are looking for Spot Long Entries that we will hold for the next 2 years.
The “Buy” Zone: Between 69,000 (2021 Cycle High) and 74,580 (Untested Support).
Bearish Scenario: If we bounce to 98,200 now, it confirms a lower high, and we short.
Bullish Scenario: If we drop to 69k first and bounce, we create a higher low structure. In this future scenario, a return to 98k would be a breakout, not a short.
Microsoft and the 1990s Fractal
The Inside Monthly/Two-Month Failure
Microsoft (MSFT) is presenting one of the highest probability setups in the market, based on a pattern observed during the 1990s dot-com bubble.
The Pattern:
Inside Monthly Candle Failure: Price dips below the previous month’s low but closes back inside the range (SFP).
Double Inside Two-Month Candle: This is the explosive trigger.
Historical Evidence:
November 1997: Microsoft printed an inside two-month candle, ran the stops to the downside (SFP), and then expanded vertically into January 1998.
The Rule: In a strong uptrend, an inside two-month candle failure always results in explosive upside expansion. I have found zero instances where this pattern led to a crash in a bull market.
Current Setup:
Microsoft just closed the monthly candle as an SFP, reclaiming the lows of the inside two-month candle. It also tapped the 468 support (previous cycle high). This reeks of a short squeeze that will take out all-time highs and drag the NASDAQ with it. Expect capital rotation from overextended names (like Google, which has 8 consecutive green months) into Microsoft.
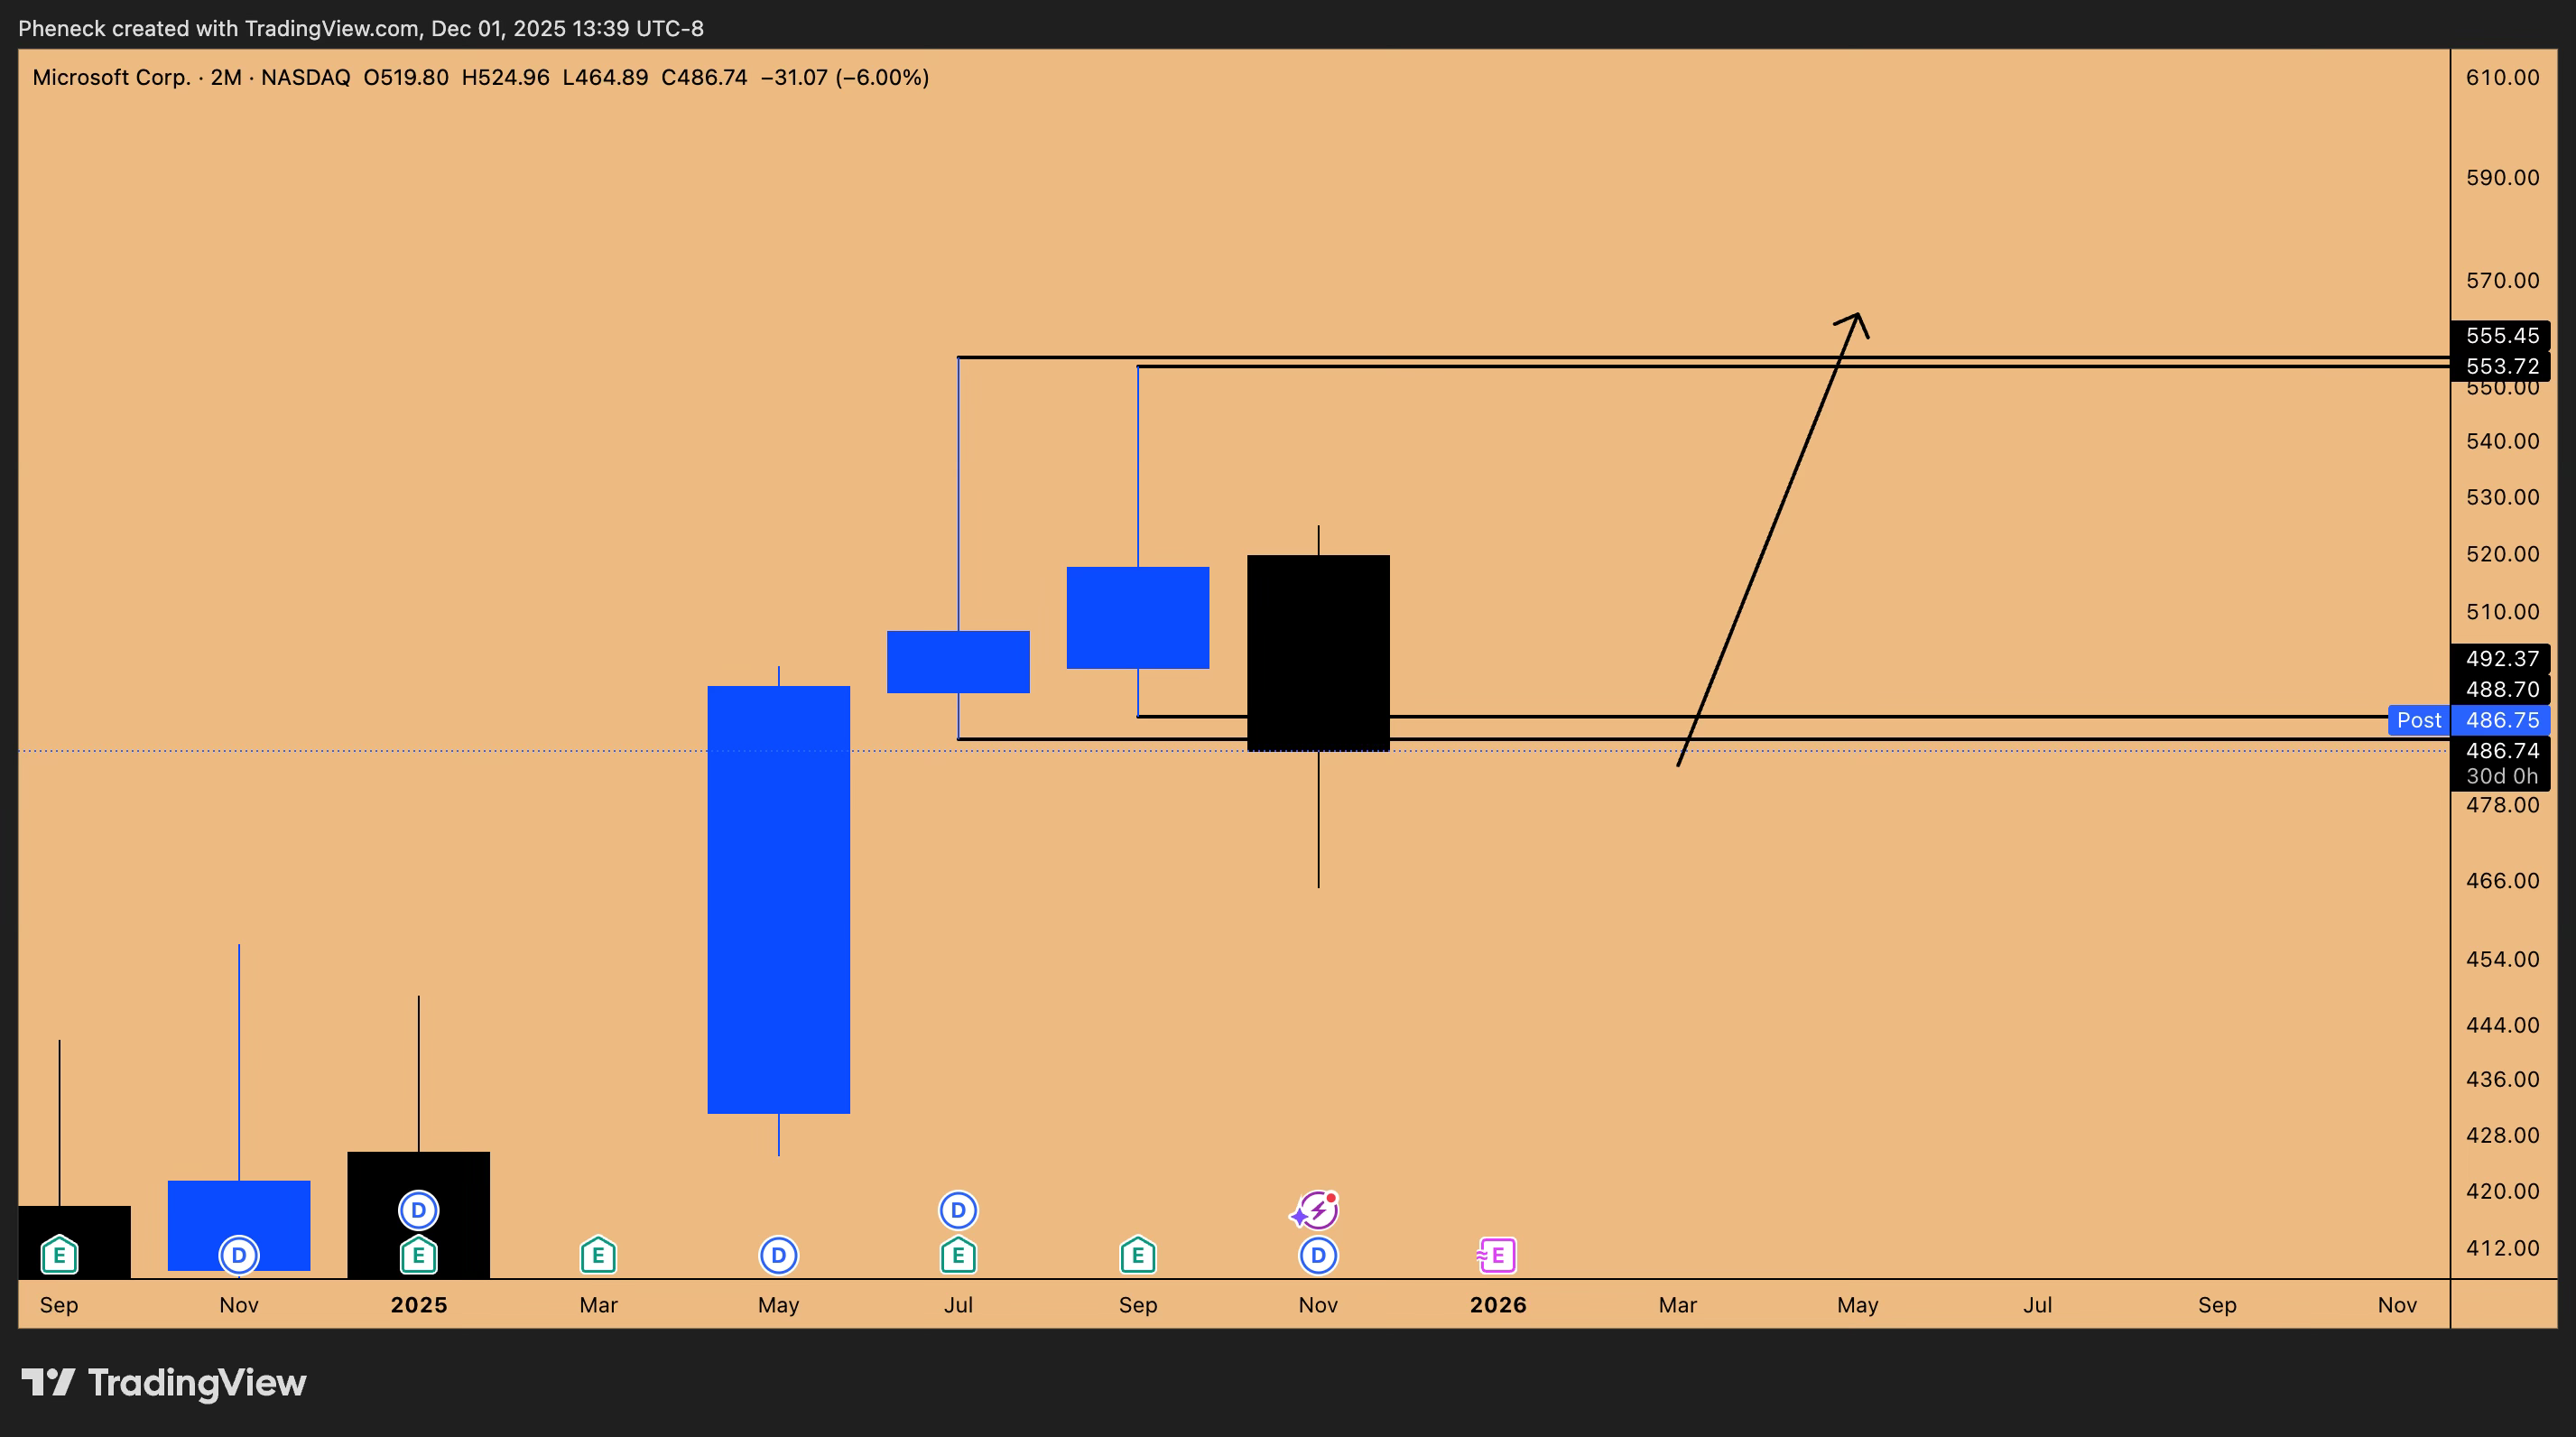
Figure 3: Inside 2-Month Candle Failure pattern in play for MSFT
Commodities and International Markets
The AI Energy Trade: Uranium
Uranium is a standout bull market asset. The thesis is simple: AI data centers are facing an energy bottleneck. Nuclear is the solution, and Uranium is the fuel.
Technical Signal: Uranium printed 7 consecutive bullish candles, followed by 1 bearish candle. This “7-up, 1-down” pattern often precedes a resumption of the trend. It is breaking out of massive consolidation.
Precious Metals and Gas
Silver: Printed a new all-time high last week. This confirms the commodities bull run.
Gold: Currently inside monthly, but given Silver’s breakout, Gold is primed to follow. Hold long positions targeting the 8% swing move.
Natural Gas: Targeting 5.6850. The draw on liquidity is the open gap between 5.99 and 6.41.
Nikkei/NASDAQ Correlation: The Nikkei is printing an inside weekly candle failure. Since Nikkei leads NASDAQ, this confirms the bullish bias for US tech stocks.
Trading Psychology: The December 19th Cutoff
Why You Must Stop Trading
For me, the trading year ends on December 19th, following the December 16th FOMC meeting. From Dec 19 to Jan 1, markets enter a liquidity void characterized by Brownian motion—random movements driven by algorithms with no institutional backing.
If you feel the urge to trade during this holiday period, it stems from three dangerous psychological flaws:
Loneliness: You are substituting family time with screen time. Don’t do it. You cannot buy back time with loved ones.
Desperation: You had a bad year and are trying to “make it back” in two weeks. This mindset will kill your account. Surgically remove this feeling.
Existential Doubt: You are questioning if trading is for you.
The Real Work: The Annual Audit
Instead of trading, spend this time auditing your year. This is how I built my strategy three years ago.
The Process: Review every trade (Scalp, Swing, Investment).
The Questions: Why did I enter? Did I follow my risk management? Did I exit prematurely due to social media panic (e.g., a “Trump nuke” tweet)?
The Goal: Identify if you are executing A+ setups or gambling on B- setups. You cannot learn these lessons while the market is open; you learn them in the silence of the year-end review.
Key Takeaways and Outlook
S&P 500: The bottom is in at 6774. Expect a run to 6929+ driven by VIX deflation and seasonality.
Bitcoin: Exercise caution. Macro is bullish, but Q4 suggests deleveraging. Buy spot at 69k–74k.
Microsoft: The “Sleeper” trade. Inside two-month failure suggests a vertical move to ATH.
Strategy: Swing trading wins. The “day trading” grind often yields less than holding a high-conviction weekly setup (like Gold) for weeks.
Rule: Stop trading on December 19th. Use the time to refine your 2026 battle plan.
What’s your plan for the December squeeze? Are you rotating into Microsoft or riding the index? Share your strategy in the comments below.
Disclaimer: This isn’t financial advice – just market musings from the charts. Always do your own research.
If you enjoyed this deep dive, please share it with fellow traders!