

Market Crossroads: Bitcoin's IBIT Inefficiency, Ethereum's Macro Breakout, NASDAQ Divergences, and the Gold Super Cycle

📝 Executive Summary
This week presents a critical juncture defined by institutional mechanics in crypto, significant divergences in equities, and a major shift in the macroeconomic environment. This analysis provides an exhaustive look into the specific setups and catalysts driving Bitcoin, Ethereum, key altcoins, the NASDAQ, and Gold, offering actionable insights derived directly from the charts. Are we on the cusp of a historic altcoin season, or will equity market weaknesses spill over into risk assets?
The immediate focus is on Bitcoin (BTC), which experienced an highly unusual $6,700 drop over the weekend. This volatility, occurring while the IBIT ETF (the institutional "cash index" for BTC) was closed, has created a massive inefficiency: an Open Gap on IBIT between 67.88 and 69.89. This gap is expected to act as a significant draw on liquidity when the New York session opens. We detail an active long position entered at approximately 110,690, based on a retest of the critical 110,530 SR level and a 3-week bullish order block. This trade targets 120K, with risk managed below the Quarterly Open support at 105,143
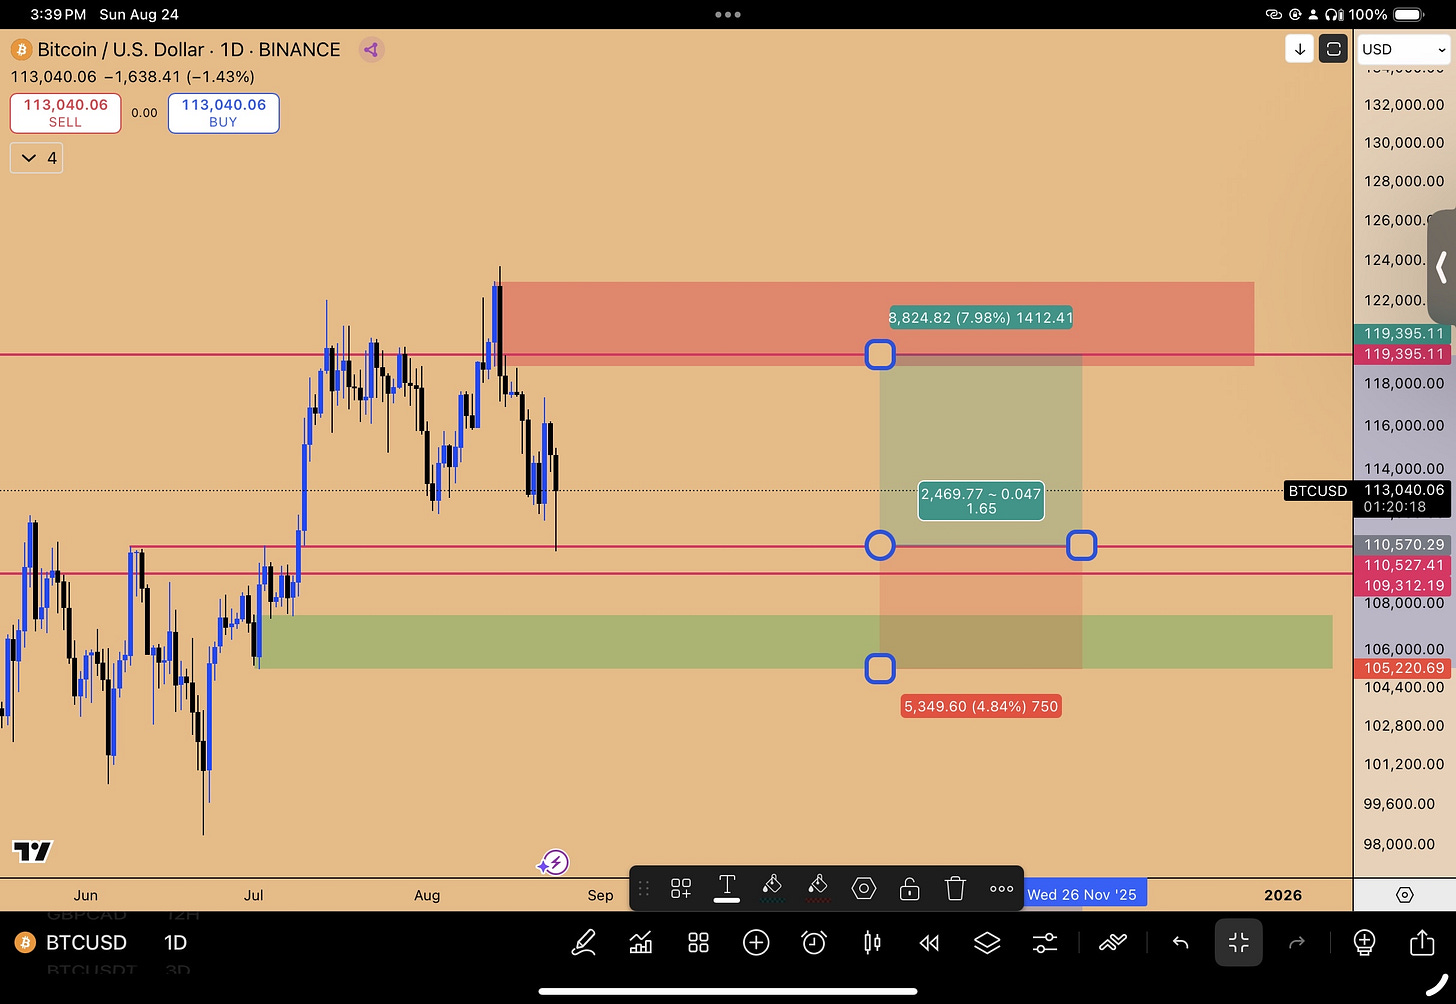
Figure 1: Bitcoin’s Active trade setup
Ethereum (ETH) has decisively broken into an All-Time High, printing its largest quarterly candle in history. This confirms a breakout from a massive, 3.5-year triangle consolidation, mirroring Bitcoin's previous 1000-day consolidation before its historic rally. The pent-up energy suggests severe upside momentum, targeting 5,953, 7,332, and eventually 10K. This strength, particularly in the ETH/BTC ratio, suggests we may be entering an altcoin season that could “put that [2017 altcoin season] to shame.” Solana (SOL) is highlighted as the primary catch-up trade, targeting $400+, with spot positions recommended for long-term holds (up to 2026). We also analyze high-reward setups in XLM (a high-beta proxy for XRP offering a 316% potential gain), AVAX (based on a rare 8-month candle pattern), and Sui.
In equities, significant S&P Divergences demand caution. While the S&P 500 nears all-time highs, the NASDAQ is lagging due to weakness in Microsoft (MSFT), which is correcting despite stellar earnings. According to the "Time Lag Theory," the index (NASDAQ) will eventually catch up to the alpha (Microsoft) with "extreme ferocity." Nvidia's earnings this Wednesday are the key catalyst that will likely resolve this tension. Furthermore, September seasonality historically proves bearish, even in strong bull markets (e.g., 2020, 2021), suggesting a likely pullback before any year-end rally.

Finally, the environment is ripening for a Gold (XAU) Mega Super Cycle. Powell's indication of September rate cuts (stimulative/inflationary) combined with poor jobs data (decelerating growth) creates a textbook Stagflation environment. Gold is exhibiting a rare Double Inside Two-Month Candle pattern, which historically leads to 15-18% rallies immediately following the breakout. We detail a high-conviction options trade via the GLD ETF to capture this move.
Key Takeaways:
Bitcoin: Long initiated at ~110,690$, capitalizing on the IBIT gap inefficiency and 3-week bullish order block support.
Ethereum: Macro breakout confirmed from a 3.5-year consolidation; targets $5,953 and $7,332.
Altcoins: Solana favored for institutional catch-up (target $400+); AVAX presenting high-timeframe spot long (target $65, 156% return).
Indices: Major divergence between NASDAQ and Microsoft signals caution; Nvidia earnings (Wednesday close) are the pivotal event.
Gold: Poised for a super cycle breakout driven by stagflation and a rare historical consolidation pattern.


🏛️ Bitcoin Analysis: Navigating Institutional Mechanics and Weekend Volatility
Bitcoin's recent price action has confirmed bearish signals discussed previously, leading into an unusual weekend event that has brought the market to a critical support confluence. The analysis hinges on the relationship between Bitcoin futures and the IBIT ETF, highlighting significant inefficiencies that dictate the current trading strategy.
The Inside Two-Week Candle Failure and Top Formation
We previously discussed the inside two-week candle failure, a confirmed pattern reinforced by a daily bearish order block. This trigger was identified as a significant indication of a “market top formation and not just some kind of a pullback.”
This pattern is the inverse of the trigger witnessed at the previous market bottom. At that bottom, an inside daily candle SFP (Swing Failure Pattern) took out the low and ran higher, creating a bullish order block, which initiated the long trade that rode to all-time highs. Similarly, the recent short trigger suggested a deeper move down. Consequently, the stance last week was firm: “longs are out of the question.” The short setup played out perfectly, taking out the targeted lows.
The $110,530 SR Level and the Jackson Hole Pivot
The anticipated plan was a move down to the very strong SR level at $110,530, where a long position would be initiated targeting a bounce to 120K. However, the Jackson Hole event made things dicey. The market went sideways, slightly swept liquidity, and then went vertical after Powell announced he is going to cut rates in September.
The premature move highlights the necessity to “always stick to your plan. Never actually just try to chase the market.”
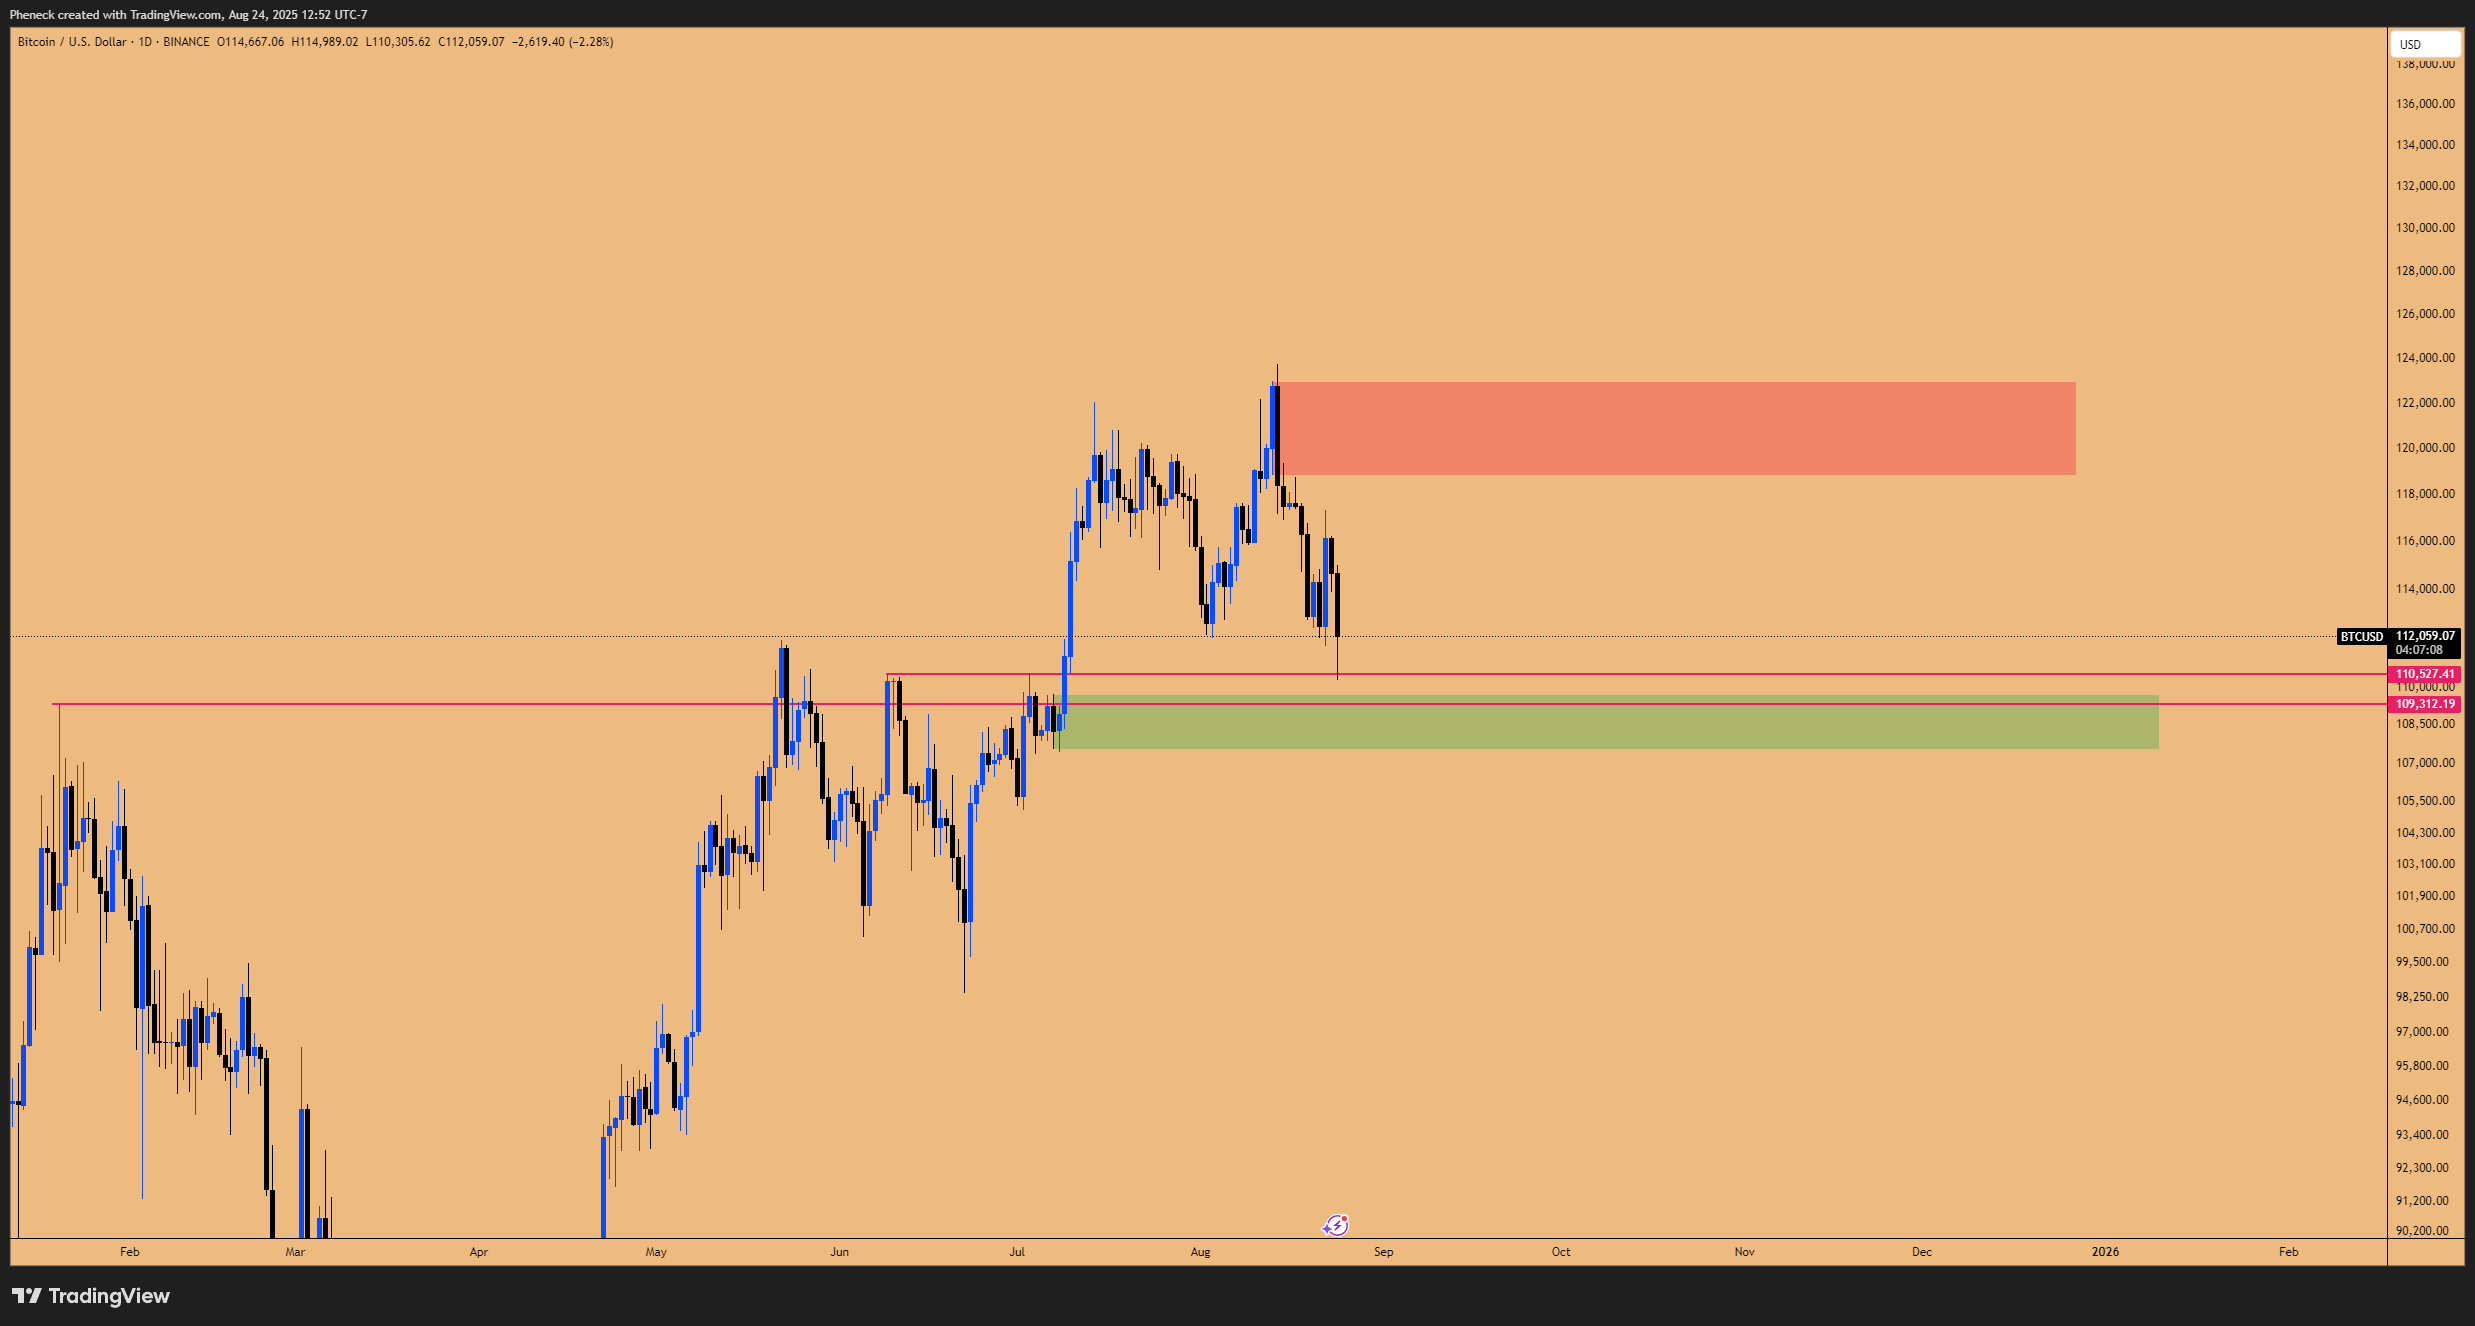
Figure 2: BTCUSD Support zone in play at 110,530$
💥 The Weekend Dump and the IBIT Gap Inefficiency
The weekend brought highly unusual volatility, with Bitcoin dropping approximately $6,700. This rarely occurs, as Bitcoin is now recognized as an institutional asset controlled by Wall Street algorithms.
This unusual movement has created a critical inefficiency. Because the IBIT ETF (which controls the order flow for Bitcoin) was closed during the dump, it will open with a significant gap down. This open gap on the IBIT chart exists between $67.88 and $69.89. This inefficiency will be the primary draw on liquidity when the New York session opens.
Furthermore, we are opening new 3-week candles this week. The weekend dump means IBIT ETF will be opening with a gap down, which is a strong inefficiency in the market.
A gap down on the 3-week chart is a “massive inefficiency which the market is not going to tolerate,” suggesting the market will reverse and go higher to fill that open gap.
The Active Long Trade Setup and Risk Management
The current long position (Figure 1) is predicated on a confluence of strong supports. On the IBIT chart, the price is entering the SR level at $62.79, which is part of a 3-week bullish order block. This is a strong support zone characterized by four distinct SR levels.
On the Bitcoin futures chart, these corresponding SR levels are:
$108,353
$109,588
$110,530
A limit order, placed 18 days prior, was filled at roughly $110,690 during the wick down toward the 110,530 level. When dipping into this bullish order block zone, this is the region to go long, at least for a day trade.
Risk Management Strategy: Stop loss placement is critical. The stop should not be placed just below the immediate SR levels (e.g., $107,520), as a stop-out would occur directly into the next major support zone. This lower zone is a daily bullish order block formed at the Quarterly Open and the Monthly Open (around $105K), making it a very strong support zone. The stop loss must be below this main support zone.
While the R:R is not exceptional, the high probability based on the understanding of SR levels and market structure justifies the position.
Upcoming Catalysts: The major catalyst event this week is Nvidia’s earnings, reported after the market closes on Wednesday. Significant movement in NASDAQ, and consequently Bitcoin, is not expected until Thursday and Friday, when the market responds to the earnings.
Ethereum's Macro Breakout and the Path to $10,000
In a move that was not anticipated this particular month, Ethereum (ETH) decisively broke out to a new All-Time High (ATH). This confirms a higher timeframe breakout with significant implications for future price discovery and the broader altcoin market.
All-Time Highs, Targets, and Key Supports
With the breakout confirmed, the market now has a magnet towards future upside targets at $5,953 and $7,332. It is crucial for the current monthly candle to maintain its strength and close higher; giving out these gains would be concerning, though the current strength suggests this is unlikely.
Prior monthly SR levels, having acted as resistance, are now flipped into future supports. Any pullback presents an opportunity to engage long positions targeting $7,332. A specific high-probability long opportunity exists if the market retraces to the $4,340-$4,341 region. This area represents a "blind opportunity" supported by both a daily and a 3-day bullish order block. The stop loss for this entry would be $4,198.
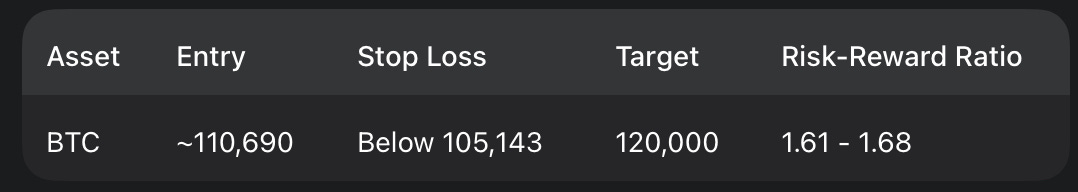
The 3.5-Year Triangle Consolidation and Historical Parallels
The significance of this breakout stems from a massive triangle consolidation pattern. This structure mirrors what Bitcoin exhibited during the 2018 bust before its major bull run.
Bitcoin (Post-2018): Consolidated within a triangle formation for almost 1000 days (roughly 2.5 years) before a decisive breakout.
Ethereum (Current): Has consolidated in a similar massive triangle for even longer—approximately 3.5 years.
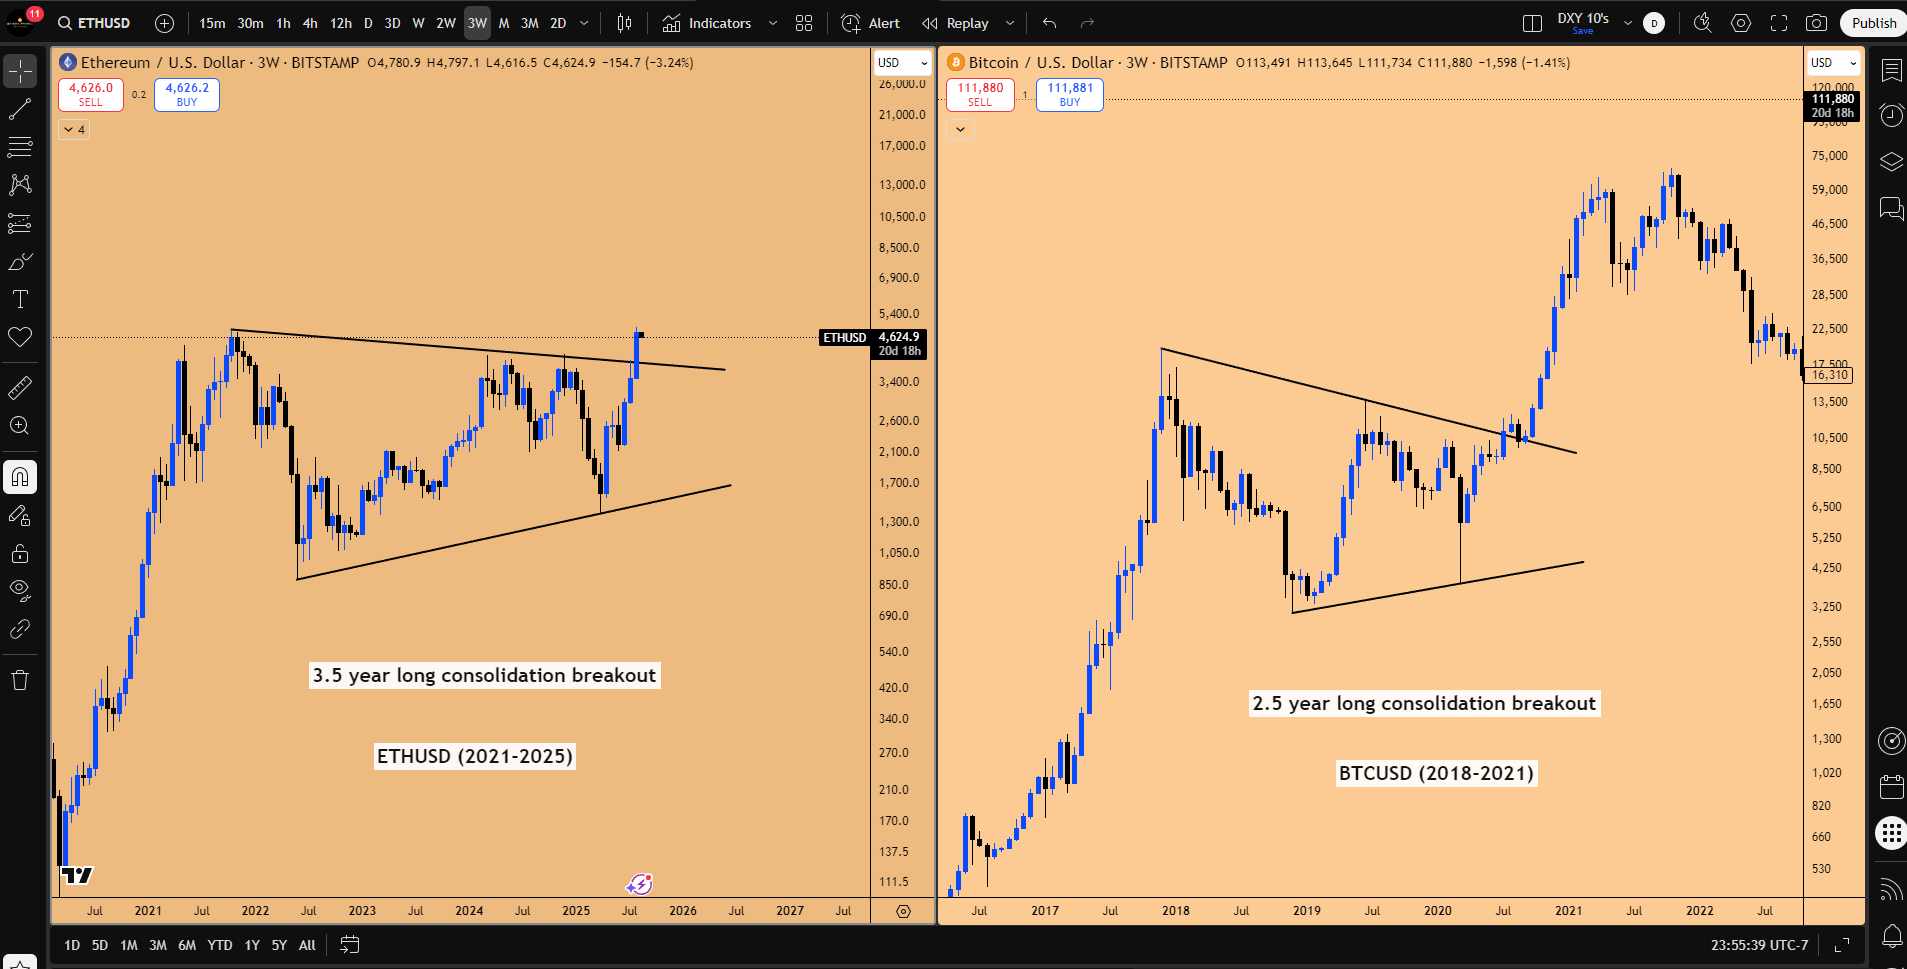
Figure 3: ETHUSD (2021-2025 consolidation) vs BTCUSD (2018-2021 consolidation)
When breaking out of this consolidation with so much pent-up energy, the upside momentum is going to be quite severe, and you don't want to fight that. The follow-through is expected to take Ethereum to at least 10K.
Furthermore, the current Quarterly Candle on Ethereum is the largest quarterly candle size ever witnessed. This unprecedented extension indicates a massive influx of liquidity into the system.
ETH/BTC Dynamics and the Altcoin Season Signal
The ETH/BTC ratio dictates Ethereum's performance and the potential for altcoin outperformance. Current environment is is favoring altcoins as Bitcoin goes sideways to up, whereas “altcoins just go berserk.”
The ETH/BTC target at 0.0414114 has been hit. However, the quarterly candle on the ratio is very strong. This raises a crucial question: What if ETH/BTC has been forming a massive triangle consolidation since 2017?
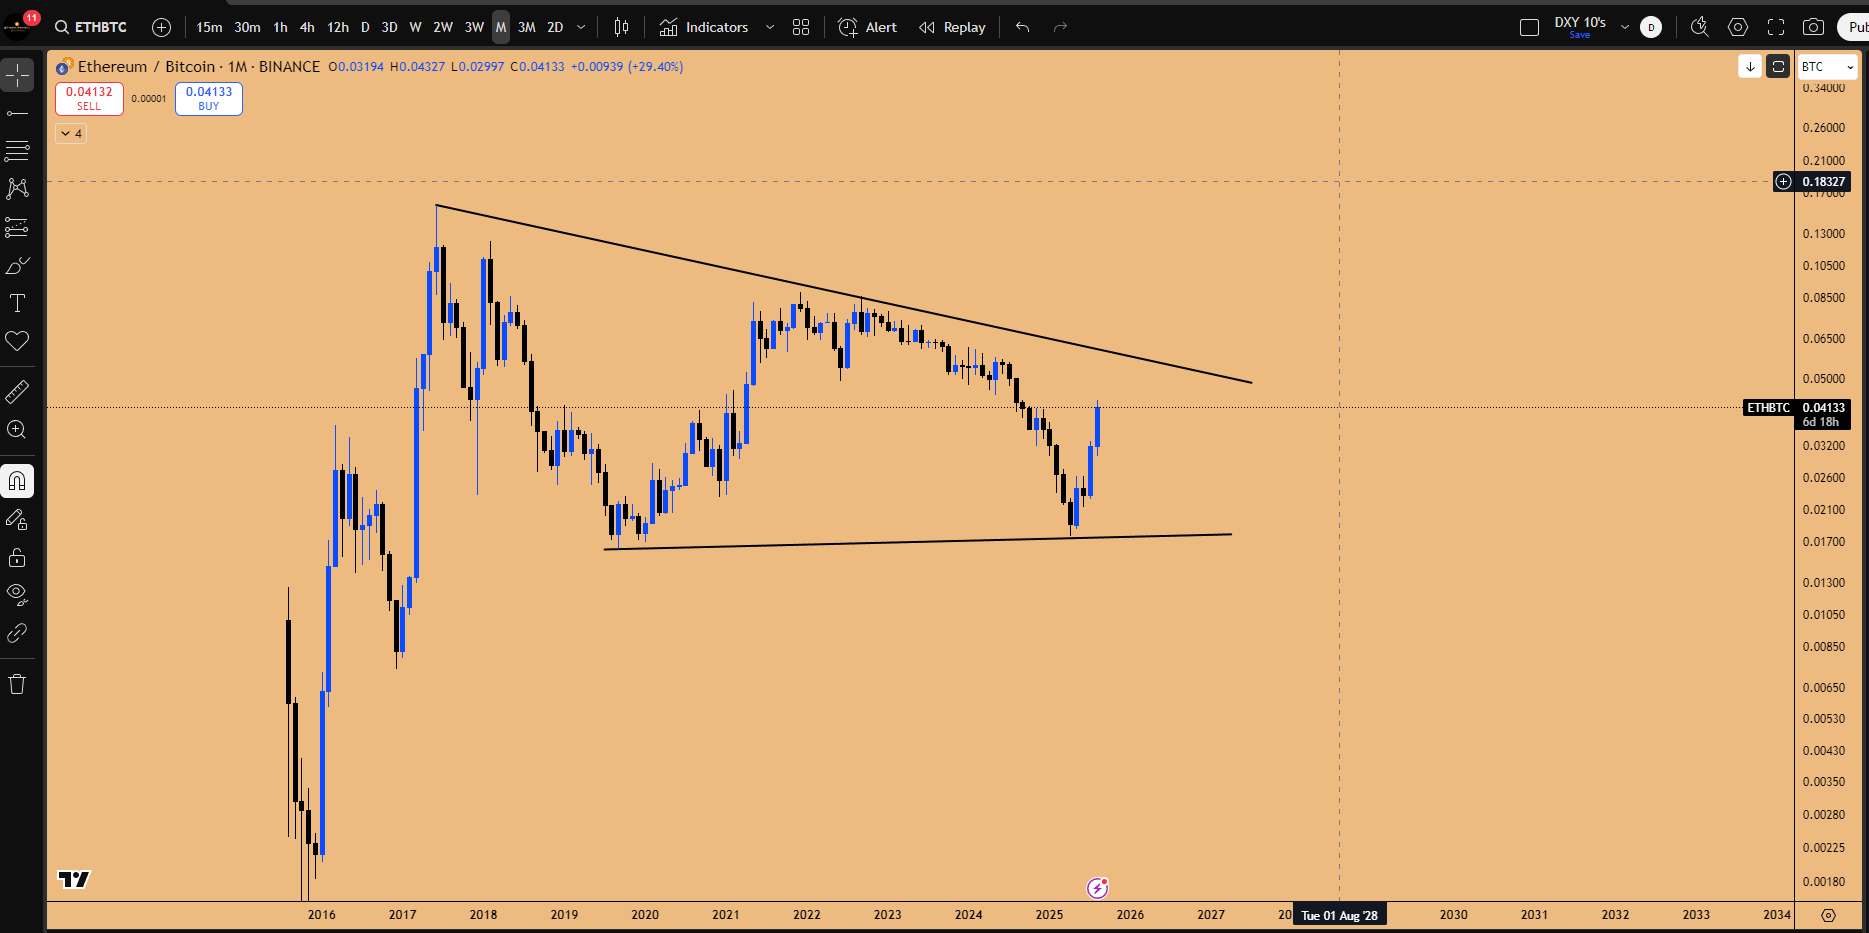
Figure 4: Potential Triangle formation in ETH/BTC pairing, suggesting explosive breakout in formation on higher time frames
If the ratio starts breaking out of this massive consolidation spanning from 2017 to 2025, we are going to have an altcoin season, one that will “put that [2017] old coin season... to shame.” This would signify a period where Ethereum significantly outperforms Bitcoin, leading to massive breakouts in the altcoin market.
Solana (SOL): The Institutional Catch-Up Trade
Solana is identified as the primary asset to start playing catch-up with Ethereum. While Ethereum is super extended, Solana's train hasn't left the station yet, suggesting more upside momentum in comparison.
The institutional and treasury capital flowing into Ethereum is expected to flow into Solana as well. This can happen through its futures chart or via ETFs; notably, ETFs for Solana (eg. SOLZ and SOLT) already exist on the NASDAQ stock exchange.
Technical Analysis and Strategy: Solana is exhibiting a bullish ascending triangle pattern. A strong daily support zone was established on August 21st.
Support Zone: $187.73 (Stop loss below $175).
Targets: $350 (T1), $427 (T2), and at least $400 (T3). The ATH ($294) is expected to be broken upon a revisit.
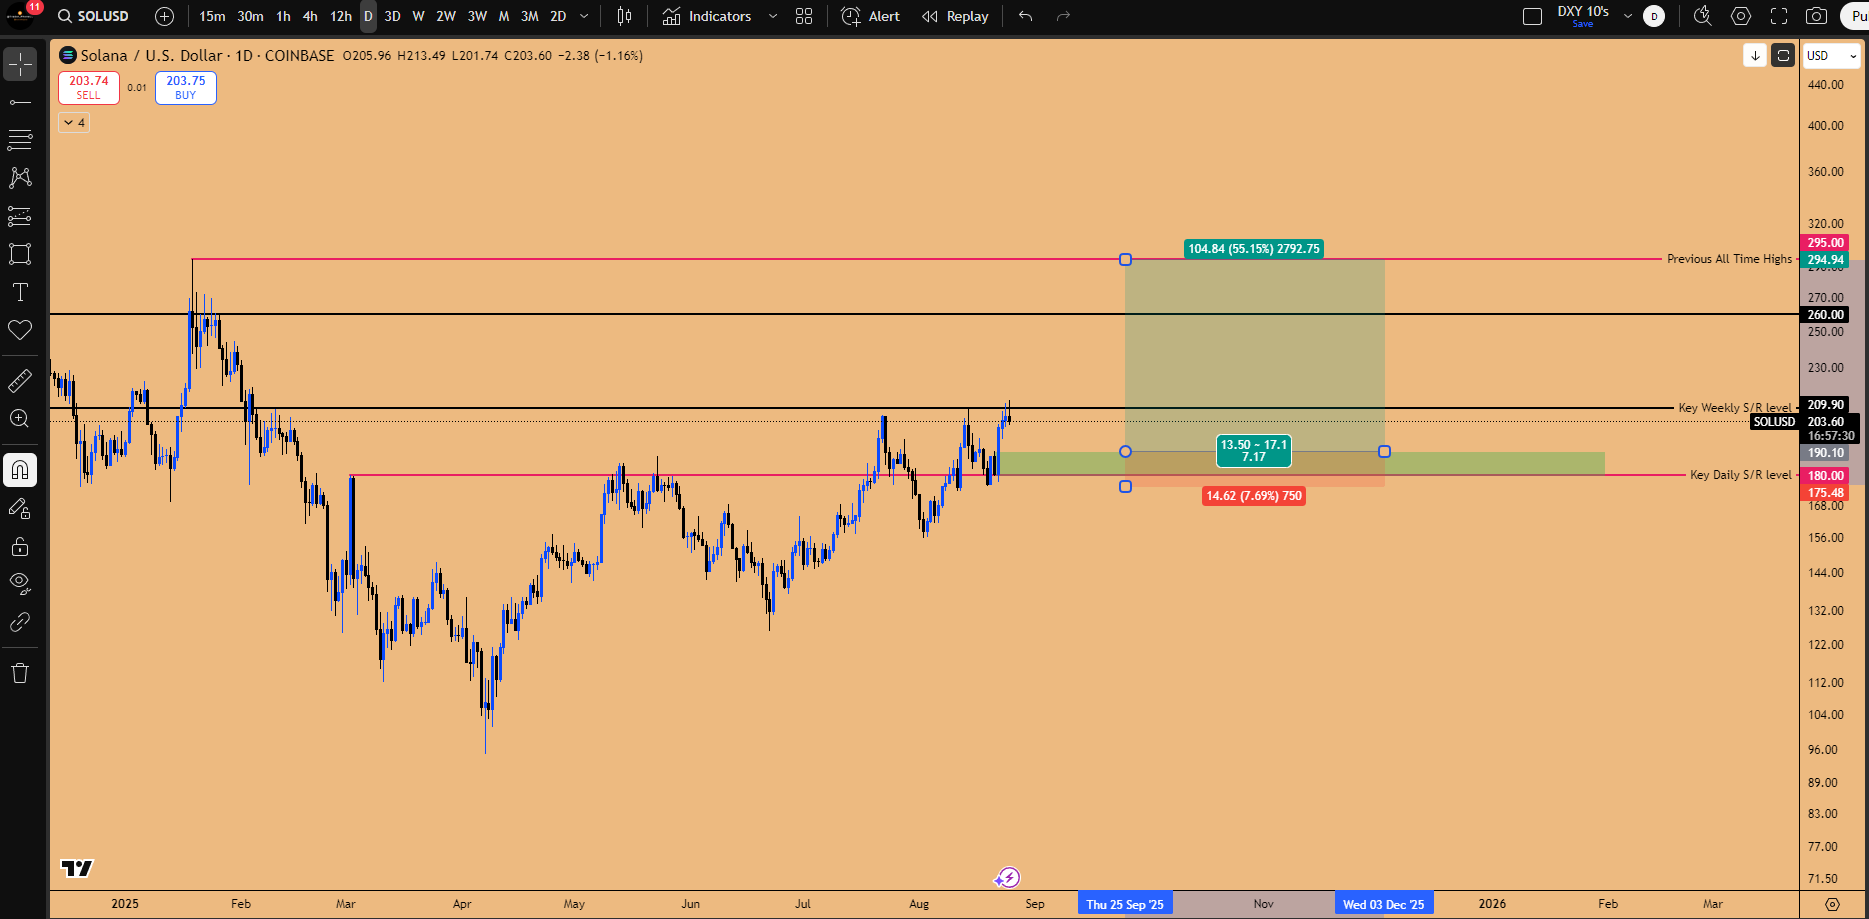
Figure 5: SOLUSD setup in play for New All Time High run up
Given Ethereum's strength, there is hesitation to wait for the pullback. A spot position is warranted now, anticipating the move to the ATH (a 44% return from current levels). There is no resistance between 203.61 and 294, as the market previously moved down in a straight line, leaving a vacuum for upward movement. The strategy is to hold this spot position long-term, up until the end of 2026.
XLM vs. XRP: Leveraging Higher Beta
XRP is showing mixed signals, with an inside 3-week candle forming as an SFP against the previous all-time high, yet exhibiting multiple bullish triggers on lower time frames (e.g., consecutive inside weekly candle SFPs).
The key analysis here is the correlation with Stellar Lumens (XLM). XRP and XLM are mirror images of each other, but XLM has higher beta, outperforming XRP in both directions.
Historical Performance Comparison:
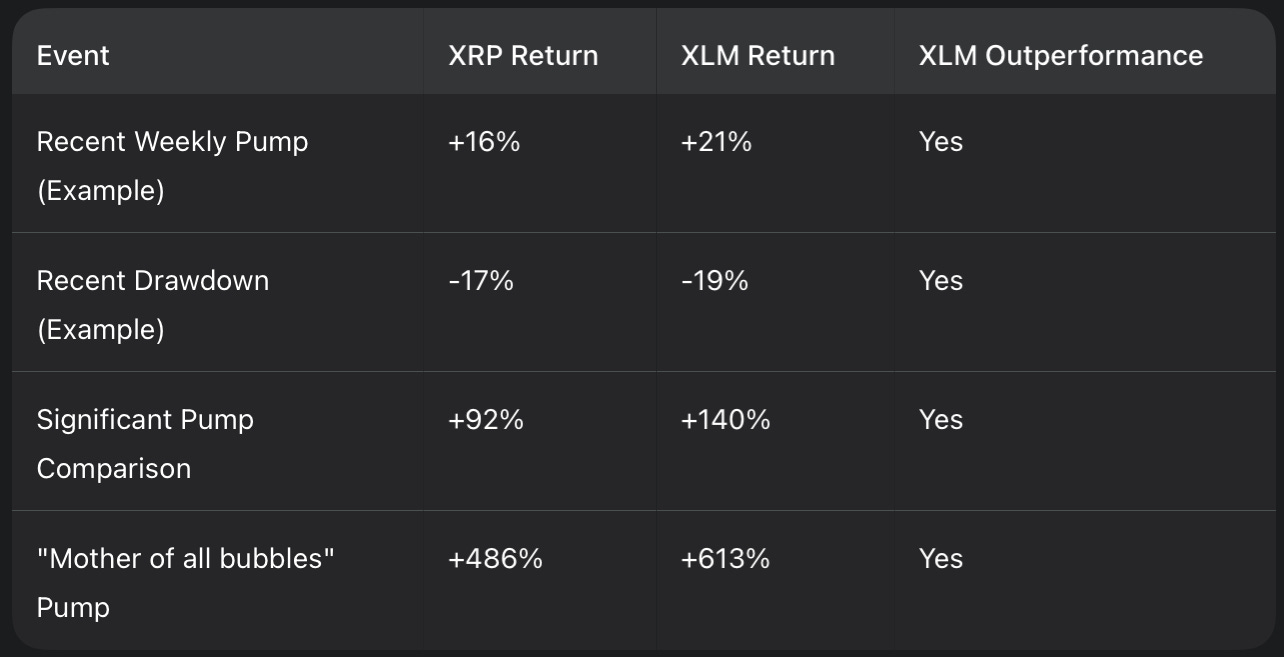
The strategy is to use XRP as the Alpha (the signal generator) and position in XLM (the Beta) for more bang for the buck.
Active XLM Spot Position: A long-term spot position in XLM remains active, entered at 23 cents. The target is $1.00, offering a potential 316% gain. The position is currently at a 70% gain.
Sui and Dogecoin: Identical Setups
Sui (SUI) Analysis: Sui presents a compelling swing trade setup based on an inside two-week candle failure. The market took out the 3.3273 lows (long trigger) and has a daily bullish order block.
Entry: $3.6903
Stop Loss: Below $3.30
Target: $4.44 (new highs)
Risk-Reward Ratio: 1.92
Dogecoin (DOGE) Analysis: Dogecoin is exhibiting the exact same setup: defending higher lows and an inside two-week candle formation. The target is the open gap between 29 cents and 31 cents.
Key Takeaway: The price action between Sui and Doge is highly correlated. Entering long positions in both constitutes double exposure. Traders should pick one, as a stop-out on one will likely mean a stop-out on the other.
Avalanche (AVAX): The 8-Month Accumulation Pattern
AVAX is exhibiting a long-term accumulation pattern, moving sideways for 5-6 months following the drawdown since December 2024. The critical pattern is found on the 8-month chart.
Pattern: Inside 8-month candle (Jan 2024 - Sept 2024).
Trigger: A failure pattern has been forming since January 2025.
Confirmation: The 8-month candle closes in 7 days, confirming the failure. Expansion is expected starting with the September 2025 candle.
AVAX Spot Trade Setup:
Entry: $25.65
Stop Loss: Below $14
Target: $65 (156% return)
Risk-Reward Ratio: 3.5
Timeline: 6-8 months to play out.
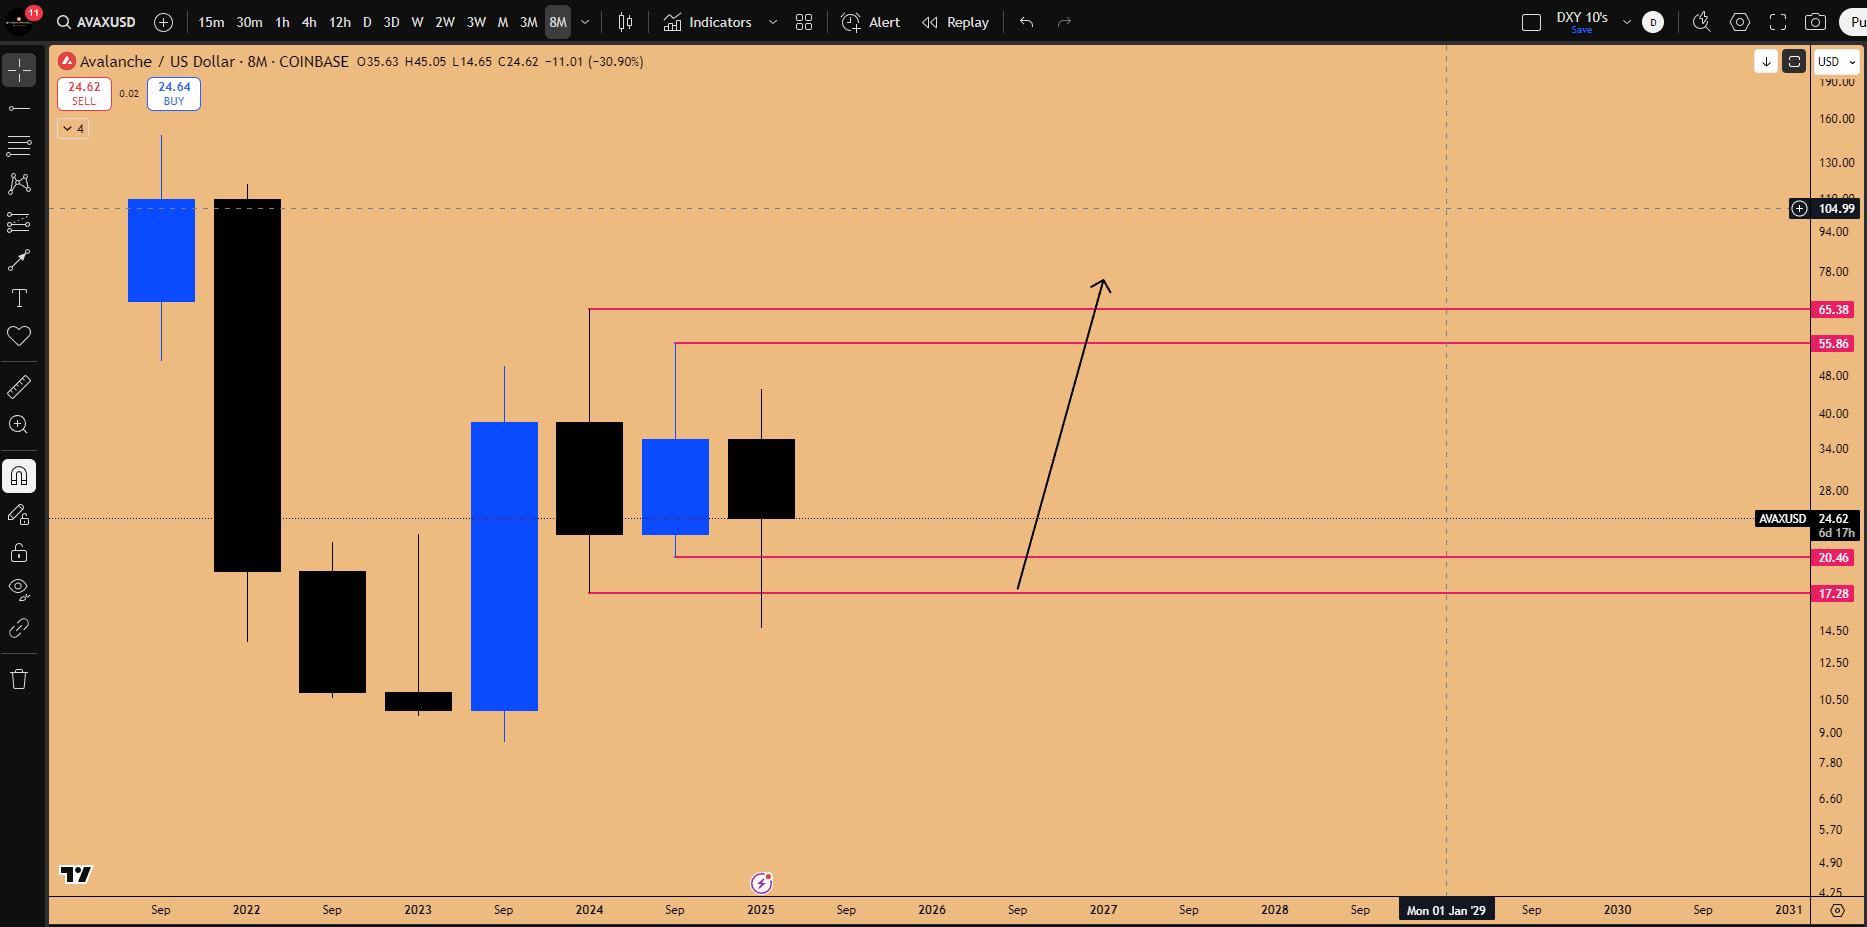
Figure 6: Inside 8 month candle failure in formation, draw on liquidity towards 65.38$
While this is a textbook high timeframe pattern, capital allocation preference remains with Solana due to the higher probability of institutional investment via its ETF.
💻 Indices Analysis: Divergences, Microsoft's Correction, and the Nvidia Catalyst
The US equity indices are currently exhibiting significant discrepancies that often signal caution or precede market tops. The interplay between the NASDAQ, S&P 500, and key components like Microsoft and Nvidia reveals underlying weaknesses, especially with major catalysts and seasonal headwinds approaching.
The NASDAQ/S&P 500 Discrepancy and Microsoft's Role
A concerning discrepancy is evident: the S&P 500 is leading and very close to making an all-time high, while the NASDAQ is visibly lagging behind. Since the NASDAQ is the heartbeat of the US stock indices, this weakness suggests something is wrong underneath the surface.
The investigation points to Microsoft (MSFT). Despite reporting stellar quarterly earnings, the stock is having a down month. This indicates the stellar report was already priced in, leading to profit-taking (sell-off) after the earnings gap up. Microsoft is undergoing a correction phase (likely 1-3 months) after the weekly timeframe hit overbought conditions.
The S&P Divergence and the "Time Lag Theory"
The critical issue is the divergence this creates. While Microsoft printed five consecutive bearish candles and started turning bearish (going for a gap fill), the NASDAQ continued higher and made an all-time high.
This is a proper S&P divergence: Microsoft is making a lower high while the NASDAQ is making a higher high. This demands high alert. When the key driver (Microsoft) is moving lower, the index is being propped up artificially.
The Time Lag Theory: This theory implies that the index will eventually get back in sync with the alpha (Microsoft). When the divergence resolves, it often happens with “extreme ferocity.” The market will use any catalyst as an excuse to bring the index lower.
Historical Example (July 2024): This phenomenon occurred back in July 2024 during the Yen carry trade collapse. Microsoft underwent a downturn until August 2024. While Microsoft bounced and made lower highs, NASDAQ made a new all-time high. This divergence was unsustainable. When Microsoft started going lower and made a new low, NASDAQ immediately followed suit and slid sharply to catch up, taking out its own previous low, even though Microsoft was already down 12% when the trigger occurred.
This historical precedent confirms that NASDAQ always catches up to Microsoft, in both directions. Therefore, no new swing long positions are being opened in the indices, as NASDAQ is likely to stall until a catalyst aligns it with Microsoft.
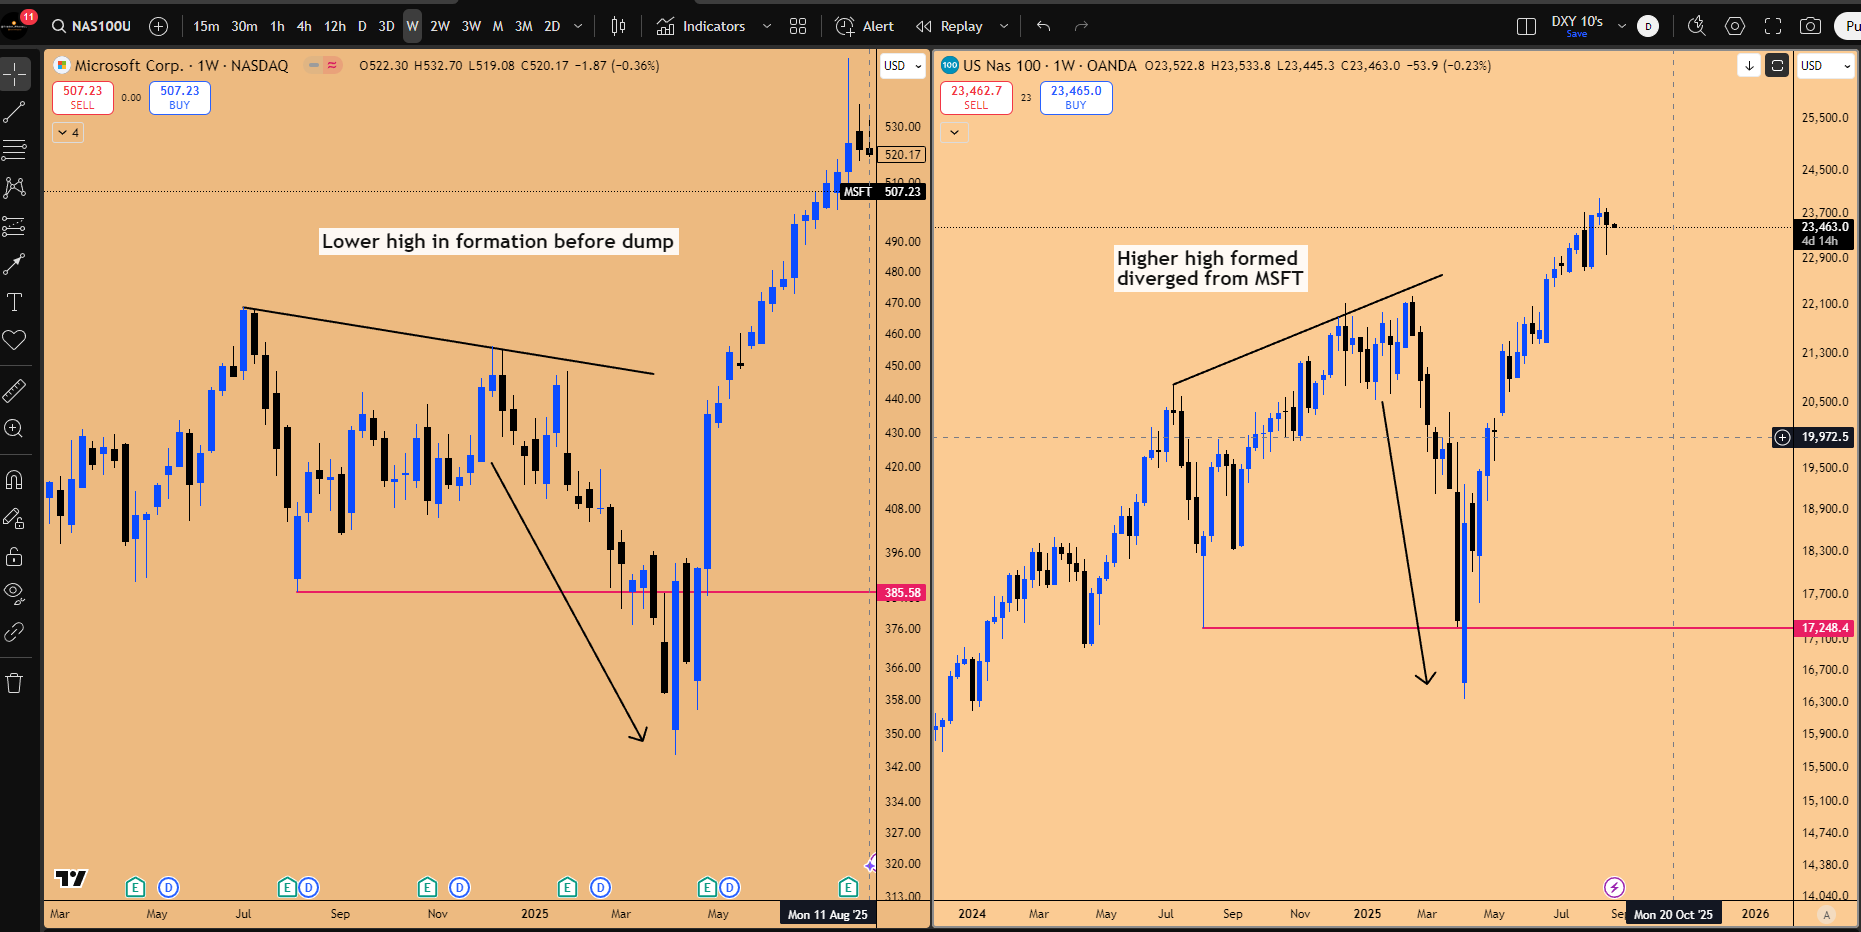
Figure 7: MSFT making lower high, while NAS100 making higher high. NAS100 eventually catches up with MSFT coming down with extreme ferocity
Microsoft's Bullish Inside Monthly Candle: A Long-Term Opportunity
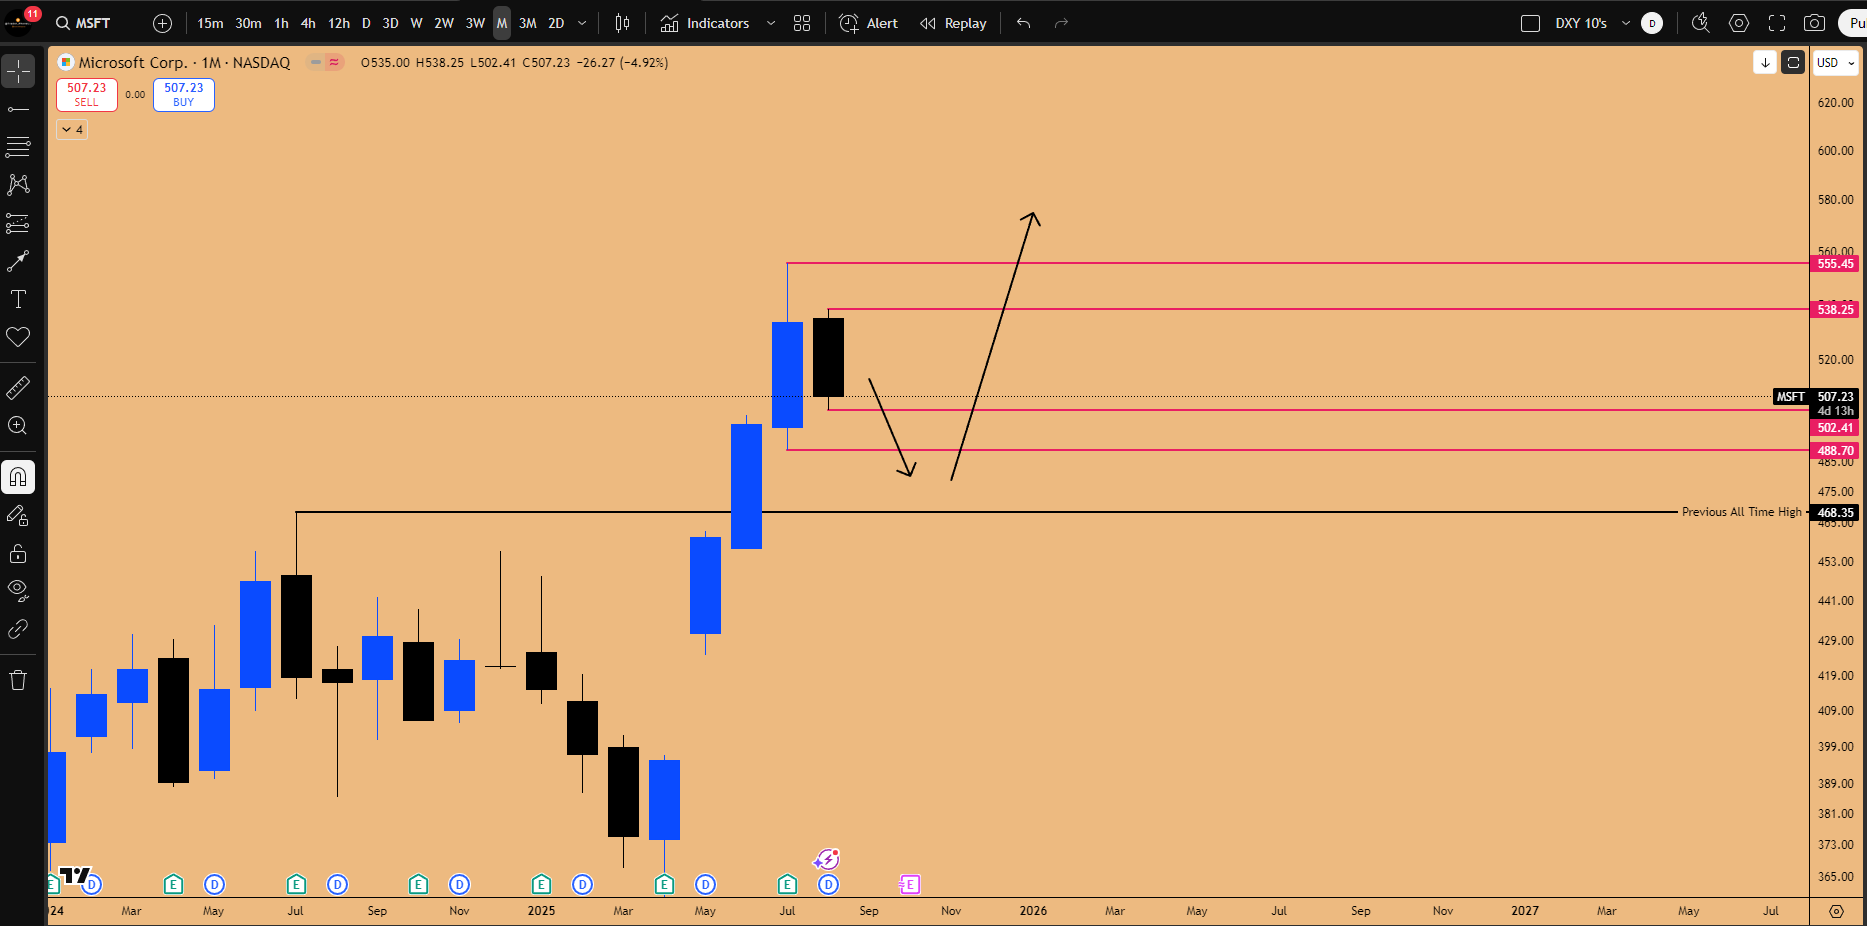
Despite the near-term correction, Microsoft is forming a very rare and significant bullish pattern on the higher timeframe: an Inside Monthly Candle. In a massive uptrend, this pattern is the market's way of establishing a higher low.
Trading Plan for Microsoft's Monthly Pattern:
Wait for the current monthly candle to close as an inside candle (not taking out the low at $488.70).
When the September monthly candle opens, wait for the market to sweep the downside liquidity (the August low).
This sweep will be the trigger to open a new long portfolio intended to be held until July 2026, utilizing option calls with at least eight months of expiration. This positions for the anticipated extremely bullish period from November through June.

Figure 8: Inside Monthly candle pattern in play going into September (Seasonally weak period)
Historical Example (Nvidia 2021): A similar inside monthly candle pattern occurred on Nvidia in 2021. By identifying the triggers (daily SFP at the monthly open support) and buying option calls, the pattern captured a massive 60% return within a short period. Inside monthly candle failures are extremely powerful in trending stocks. Microsoft is expected to go up at least 20% to 30% based on this pattern.
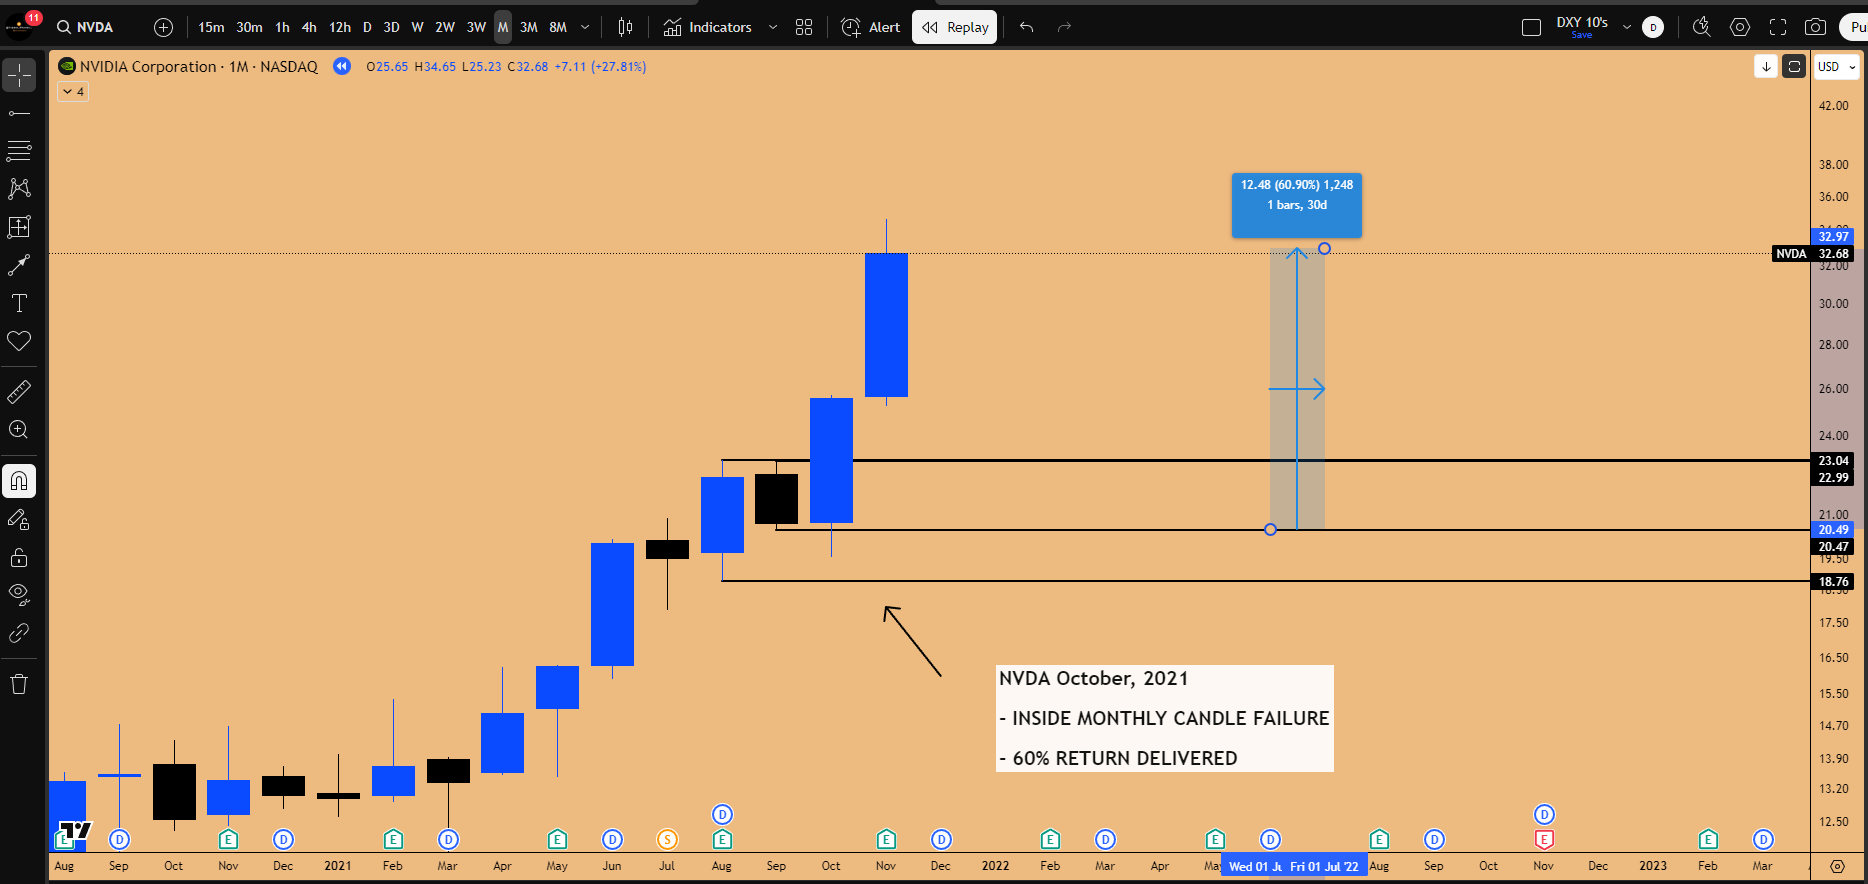
Figure 9: NVDA October 2021 rally initiated via Inside Monthly Candle Failure
Nvidia Earnings and the Immediate Strategy
Currently, Nvidia (NVDA) is the poster child carrying the market higher. Microsoft is moving lower, while Nvidia is holding up, waiting for its earnings catalyst (Wednesday after close).
The critical moment will be Thursday, the day after earnings. The market's reaction upon opening Thursday dictates the trend. If Nvidia gets sold into after the earnings, it will start catching up with Microsoft's downside move, and NASDAQ will follow.
Key Levels and Strategy:
NASDAQ Support: The previous all-time high (Nov 2024/Jan 2025) is at 22,135. A pullback to this level would correspond to a pullback in Nvidia, presenting a long opportunity in both.
NASDAQ Resistance Zone: 23,633 - 23,700.
Strategy: Until Thursday, don’t do anything in the market regarding indices. Focus remains on the Bitcoin long position.
September Seasonality Warning
The market is entering September, seasonally the weakest month of the year. The NASDAQ is overstretched, having mostly gone up in a straight line from the recent bottom on the 6-day chart.
Historical Seasonality Data (September):
2020: Massive summer run followed by a 10-15% correction.
2021: A very bullish year (Yellen pumping liquidity), yet the September-October period was bearish.
2023 & 2024: Both years experienced drops in September.
This historical weakness suggests a volatility spike is likely. We want to see this volatility and a shift towards bearish sentiment. September typically brings fear, leading to a bottom formation in October, followed by the bullish year-end months (November, December, January). We are waiting for this volatility spike to position for the year-end rally.
💸 Gold's Mega Super Cycle and the Stagflation Trade
Gold is poised to outperform significantly due to a shift in the macroeconomic environment and the emergence of a rare technical pattern within an established mega super cycle.
The Stagflationary Catalyst
The current environment is defined by recent developments following Powell's commentary:
Rate Cuts Signaled: Powell signaling that he's going to start dropping rates is stimulative in nature, suggesting future upward pressure on inflation.
Economic Deceleration: Rate cuts are being signaled because jobs data has been extremely bad, indicating the economy is doing poorly and growth is decelerating.
The combination of accelerating inflation and decelerating growth is the definition of Stagflation. In this specific environment, gold is the asset that outshines.
Technical Consolidation and the Mega Super Cycle
Gold has been undergoing a textbook consolidation, moving sideways for four months. This consolidation appears heavily controlled. A critical line in the sand has been established: going below 3,311 is unlikely moving forward.
Zooming out reveals a Mega Super Cycle. On the two-month chart, ever since breaking out of its massive previous consolidation, Gold has consistently printed higher lows, never breaching any previous two-month candle lows.
🧐 The Rare Double Inside Two-Month Candle
The key technical pattern is the Inside Double Two-Month Candle. This pattern is extremely rare; extensive backtesting dating back to 1970 reveals only a few occurrences.
Historical Backtesting and Implications: The significance of this pattern depends on the dominant trend. In a downtrend, the breakout follows the trend to the downside. However, in an established uptrend (like the current scenario), this pattern represents consolidation and compression before a massive breakout.
Historical Examples in Uptrends:
One historical instance (though slightly imperfect as it took out the high by a tiny sliver) led to a rally that went up 80% in 60 days.
Another classic instance resulted in a 15% return on the next two-month candle.
A third instance, exactly mirroring the current setup (massive run-up followed by consolidation), resulted in an 18% rally.
This is a consolidation pattern, not a failure pattern. The strategy is to position long on the next two-month candle (September-October) and capture the upside expansion.
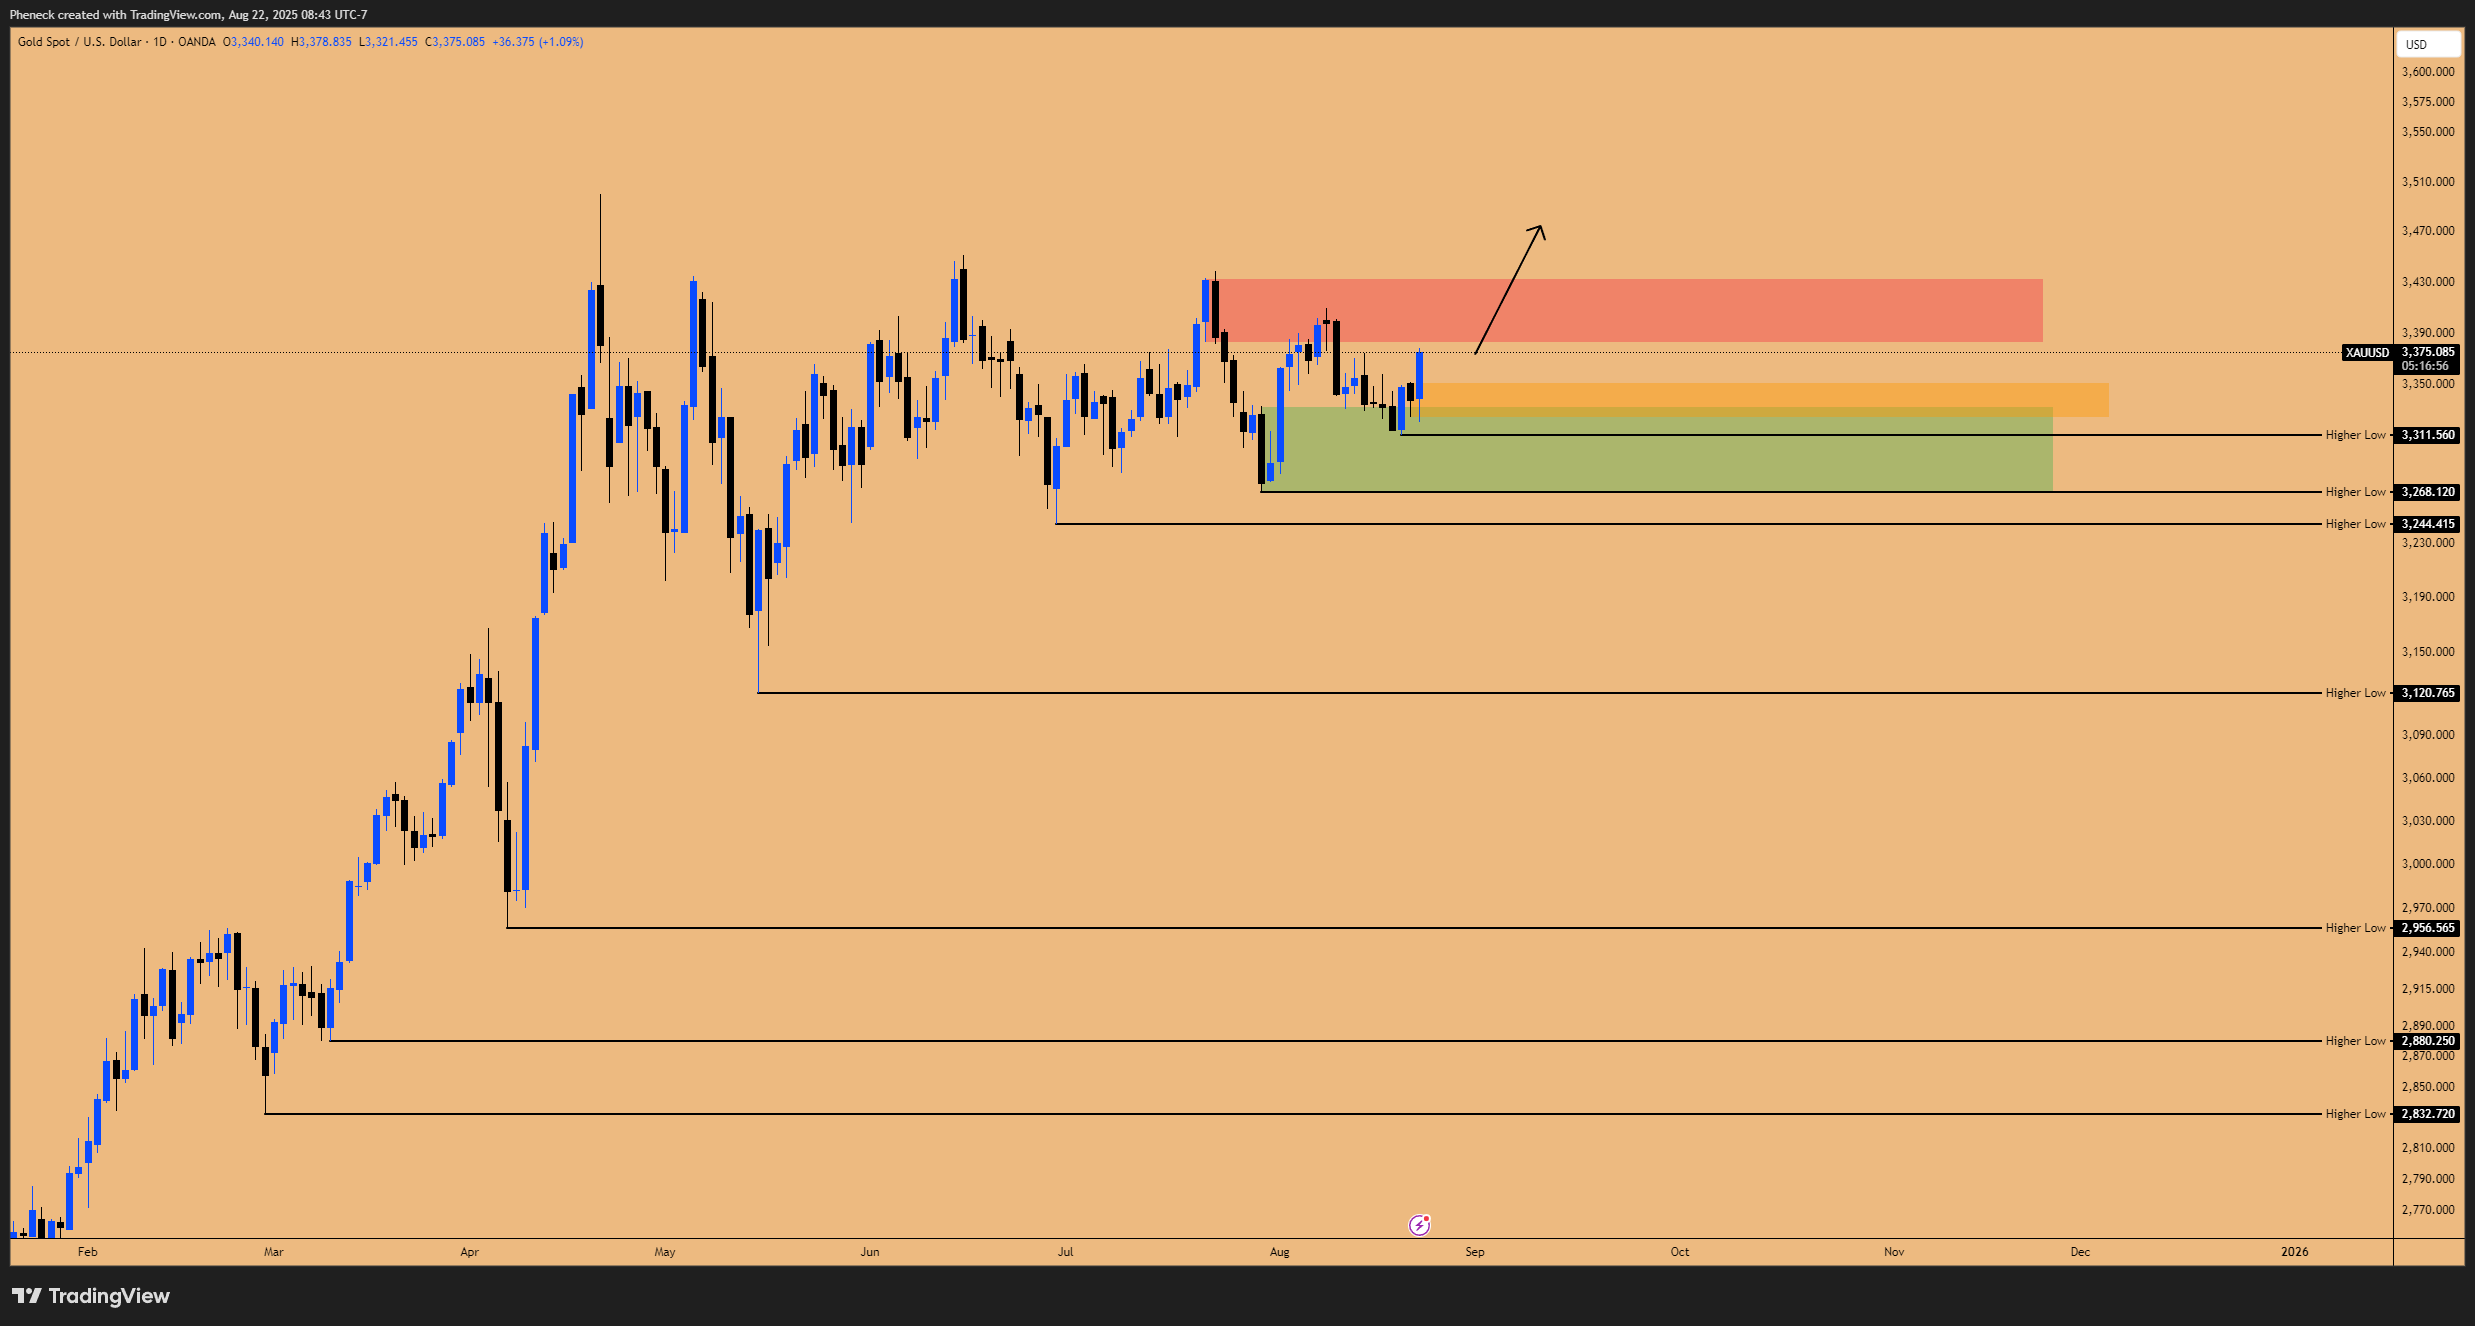
Figure 9: Gold Consolidation threatening Breakout to New All Time Highs and beyond.
GDX Correlation and Trade Setup
The correlation between Gold (GLD) and Gold Miners (GDX) provides further confluence. While Gold has been consolidating, GDX has no consolidation. GDX has been going higher and breaking out since August 4th.
This indicates that GDX is leading Gold. Gold has significant catching up to do with GDX.
Gold (GLD) Option Trade Setup: The best way to hold this position for the next two months is via option calls on the GLD ETF.
Instrument: GLD Option Calls
Strike Price: $320
Expiration: December 16th or December 31st.
Stop Loss: 300 on GLD (if the current two-month candle, closing in 4 days, closes below this level).
Target (Gold Futures): The next yearly pivot at 3,754.
The risk is minimal, but the reward is very high. If Gold rallies 15% as historical data suggests, the option position is likely to print 100%.
🔮 Key Takeaways and Outlook
Our work is cut out for this week, with clear focus areas and defined game plans across different asset classes. The market environment is complex, characterized by significant divergences in equities, institutional mechanics in crypto, and macroeconomic shifts favoring precious metals.
Summary of Focus Areas and Active Positions:
Nvidia Earnings (Wednesday Close): This is the major catalyst. The market reaction on Thursday will dictate the direction for the NASDAQ and broader risk assets. We remain sidelined on indices until this event passes.
Bitcoin Long: The position entered at ~110,690 is active, targeting the IBIT gap fill and a move toward 120K, defending the critical support confluence down to 105,143.
Gold Breakout: Positioned long via GLD options ($320 strike, Dec expiry) for the anticipated breakout from the double inside two-month candle, targeting the 3,754 yearly pivot in a stagflation environment.
Equity Divergences: We continue to monitor the significant divergence between NASDAQ and Microsoft. The "Time Lag Theory" suggests the NASDAQ is vulnerable to catching up to Microsoft's weakness, potentially exacerbated by bearish September seasonality.
Altcoin Positioning: Ethereum's macro breakout confirms the bullish bias. Focus is on spot positioning in Solana (the preferred catch-up trade) and AVAX (based on the 8-month candle failure), alongside existing positions in XLM.
As we navigate the last days of summer and head into a seasonally volatile period, focusing on these key areas Nvidia earnings, the indices game plan, Bitcoin long, Gold, and the divergences will be crucial.
What's your take on these setups? Are you prioritizing the Gold super cycle or cautious on the NASDAQ divergence? Share in the comments—let's discuss strategies. Subscribe for more market breakdowns!
Disclaimer: This isn't financial advice – just market musings from the charts. Always do your own research.
If you enjoyed this deep dive, please share it with fellow traders!