

Market Situation Report: Bubble Territory Unleashed
AI Mania and Bitcoin’s Silent Accumulation

Executive Summary
What happens when the most powerful bull mania in a generation collides with daily RSI readings of 83, quarterly RSI tags of 87, and a chip sector so vertical that even seasoned traders begin whispering the dreaded word: bubble? Welcome to Global Melt UP, where the tape is screaming “full tilt” and the temptation to fade the move has never been more dangerous. The instinct to short an overextended market is wired deep into every trader’s psyche, but as we are about to dissect in painful detail, that instinct is precisely the trap that has burned every short seller who tried to call the top of an inflating bubble. MU is pushing RSI 81 (overbought) on the daily. LRCX is hitting the same quarterly RSI 87 reading that has historically marked bubble peaks. NASDAQ has been overbought on the quarterly time frame since October 2024. And yet, the market refuses to break.
Why? Because bubbles do not pop on overbought readings alone. They pop on confirmed market structure breaks. Until the 3-week candle low at 26,944 on NASDAQ breaks down, this bubble remains untouchable, undefeatable, and almost certainly headed higher. The lesson from BTC 2017, when traders confidently shorted at $3,000 only to watch price catapult another 600% to $20,000, is etched into the playbook. You do not fight a bubble. You ride it with disciplined trade management until the structure tells you otherwise.
But here is where the story sharpens into a blade. While everyone is mesmerized by the chip sector vertical, a quieter, more consequential setup is forming beneath the surface. Bitcoin is accumulating in a stubborn, deliberate range, closing its first higher time frame candle above the $74,500/$73,700 supply zone in nine grinding weeks. Apple has triggered an inside two-week candle reclaim that nobody is discussing. Goldman Sachs is holding the only pattern capable of dragging the lone laggard index, US30, to fresh all-time highs. Eli Lilly and UNH are quietly painting bottoming patterns in the healthcare sector that look like coiled springs. And then there is the algorithmic relationship between a Japanese behemoth and the largest company in the world that almost nobody is talking about: SoftBank.
Yet none of these setups, as compelling as they are, represent the climax of this episode. There is one trade. One window. One ten-to-twelve-day event horizon where three independent factors of confluence stack together into what may be the most asymmetric setup of the year. We will get there, but we are going to earn it.
Here is what you need to internalize before we go deeper:
Bubble territory is confirmed across multiple barometers, but overbought RSI alone is not a short signal; market structure remains intact and bullish.
3-week candle lows are the only valid invalidation points for swing positioning; NASDAQ’s sits at 26,944 and BTC’s at 73,724.
Bitcoin’s silent accumulation above the $73,700 SR level is the bottoming formation of a generation, and the explosion phase is imminent but not yet.
SoftBank is acting as a one-day leading indicator for Nvidia, with both stocks moving in nearly identical lockstep on the same inside two-month candle failure pattern.
Apple, Amazon, AVGO, Goldman Sachs, Eli Lilly, and UNH all carry distinct higher time frame patterns with measurable invalidation and targets.
The corrective window is most likely August through November, with seasonal weakness and midterm election positioning offering the next great dip-buying opportunity.
One trade in particular, tied to a single earnings event ten to twelve days out, combines historical precedent, seasonal skew, and a yearly pivot magnet into a setup that could deliver double-digit returns in a compressed window. We will save the punchline for the final act.
Strap in. This is not a market for the timid, and it is certainly not a market for the contrarian. It is a market that rewards trend following with surgical risk management, and punishes anyone who confuses overextension with reversal.
The Anatomy of a Bubble: Why Overbought Does Not Mean Over
Let us begin with the most uncomfortable truth in trading: the market does not care about your RSI. It does not care about your indicators, your divergences, or your gut feeling that “this has gone too far.” Bubbles are defined not by exhaustion but by the absence of structural failure, and the current tape is the cleanest illustration of that principle we have seen in years.
MU’s daily RSI is pushing 81. That is a reading we have not witnessed across most charts in recent memory, and yes, it can push further to 86 if momentum compounds. But here is the critical distinction: bubble territory and bubble peaks are not the same thing. Bubble territory begins when weekly or quarterly RSI tags 80 to 90. Bubble peaks only confirm when higher time frame structure breaks.
The 2017 Bitcoin Lesson Etched in Stone
Back in August 2017, Bitcoin’s RSI was sitting at 89 with price trading above the previous all-time high of $3,000. Every retail trader on the planet was screaming bubble. And technically, they were right. It was a bubble. The mistake was thinking that being right about the diagnosis meant being right about the timing.
Shorting an inflating bubble is the single stupidest trade you can make. Bitcoin went on to print $20,000 from that $3,000 base. A 600% rally above what every textbook would call “overbought.” That is what happens when overbought RSI meets intact market structure.
The first legitimate market structure break in BTC came when an inside 3-week candle failure pattern printed and confirmed. Only then did RSI begin its descent. Only then did the bubble actually pop. The structural rule is non-negotiable.
LRCX as the Quarterly Bubble Barometer
If you want a single chart that tells you when bubble territory is fully engaged on the higher time frames, look at LRCX. Why? Because since 1993, this name has cycled through four distinct bubble phases: the dotcom mania, the 2007 housing bubble adjacent semiconductor cycle, the 2021 post-rate-cut blow-off, and now the AI semiconductor boom. The common denominator across all four? Quarterly RSI tagged 87 at the peak.
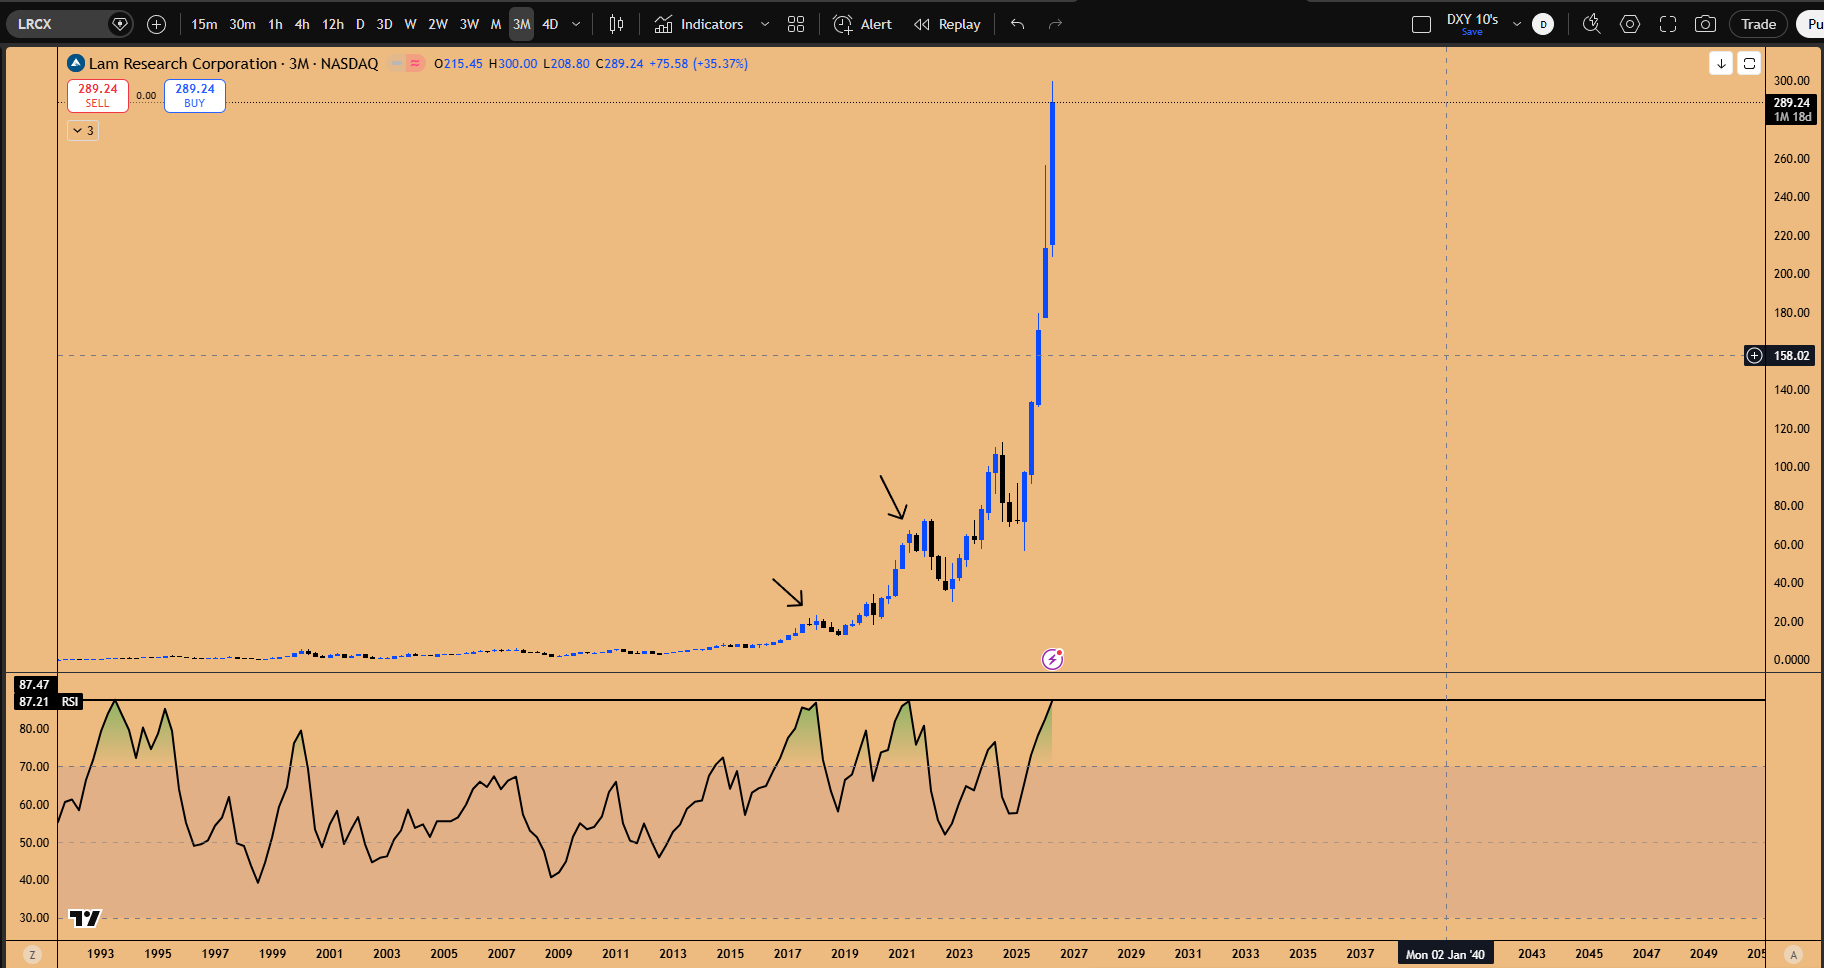
Figure 1: Peak Bubble formation in LRCX
LRCX is sitting at quarterly RSI 87 right now. That is the warning shot. But notice the historical pattern: when the prior cycles tagged 87, the actual top printed three to four quarters later, and the subsequent corrections were savage. The 2018 correction logged roughly 47%. The 2021 correction logged roughly 58%. The earlier dotcom-era unwind cut the stock by 88%.
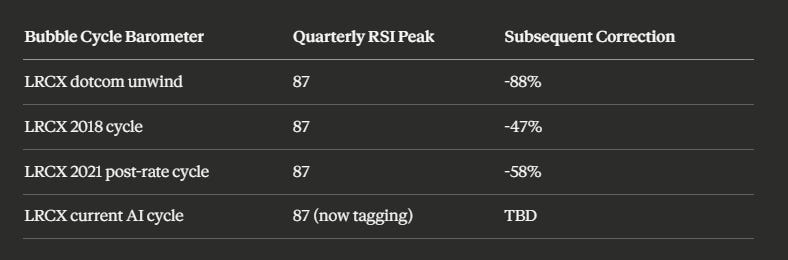
The message is layered: yes, we are in bubble territory. No, that does not mean we top tomorrow. Semiconductors behave like commodities, ripping 1,000% to 1,500% in expansion phases before unwinding violently. We are still in the expansion phase, but the warning lights are flashing.
Why You Cannot Short and Cannot Stop Riding
Here is the structural truth that governs every position right now: NASDAQ has been overbought on its quarterly time frame since October 2024. We are now in April 2026. That is roughly a year and a half of continuous quarterly overbought conditions, and the index has only accelerated. The takeaway is brutal in its simplicity. Overbought is a state, not a signal.
