

Market Situation Report: Gold’s Breakout, NASDAQ’s Breakdown, and Nvidia’s Date with Destiny

Executive Summary
Something extraordinary is happening beneath the surface of global markets this week and most traders are looking in the wrong direction. While the financial media fixates on headline indices hovering near all-time highs (We all watched Pam Bondi’s testimony referring to Dow and SPX500) and the relentless optimism surrounding artificial intelligence, a seismic divergence is forming that could define portfolios for the next six to nine weeks. Gold has been leading one of the most aggressive breakout sequences in recent memory on monthly time frames, shrugging off overbought conditions like they don’t exist. Meanwhile, NASDAQ has quietly confirmed a bearish pattern on the three-week timeframe that hasn’t fired since December 2024 and the last time it did, the index bled lower for the next 9-12 weeks. At the center of this storm sits Nvidia, whose February 25th earnings report threatens to become the single most consequential catalyst in the entire market ecosystem.
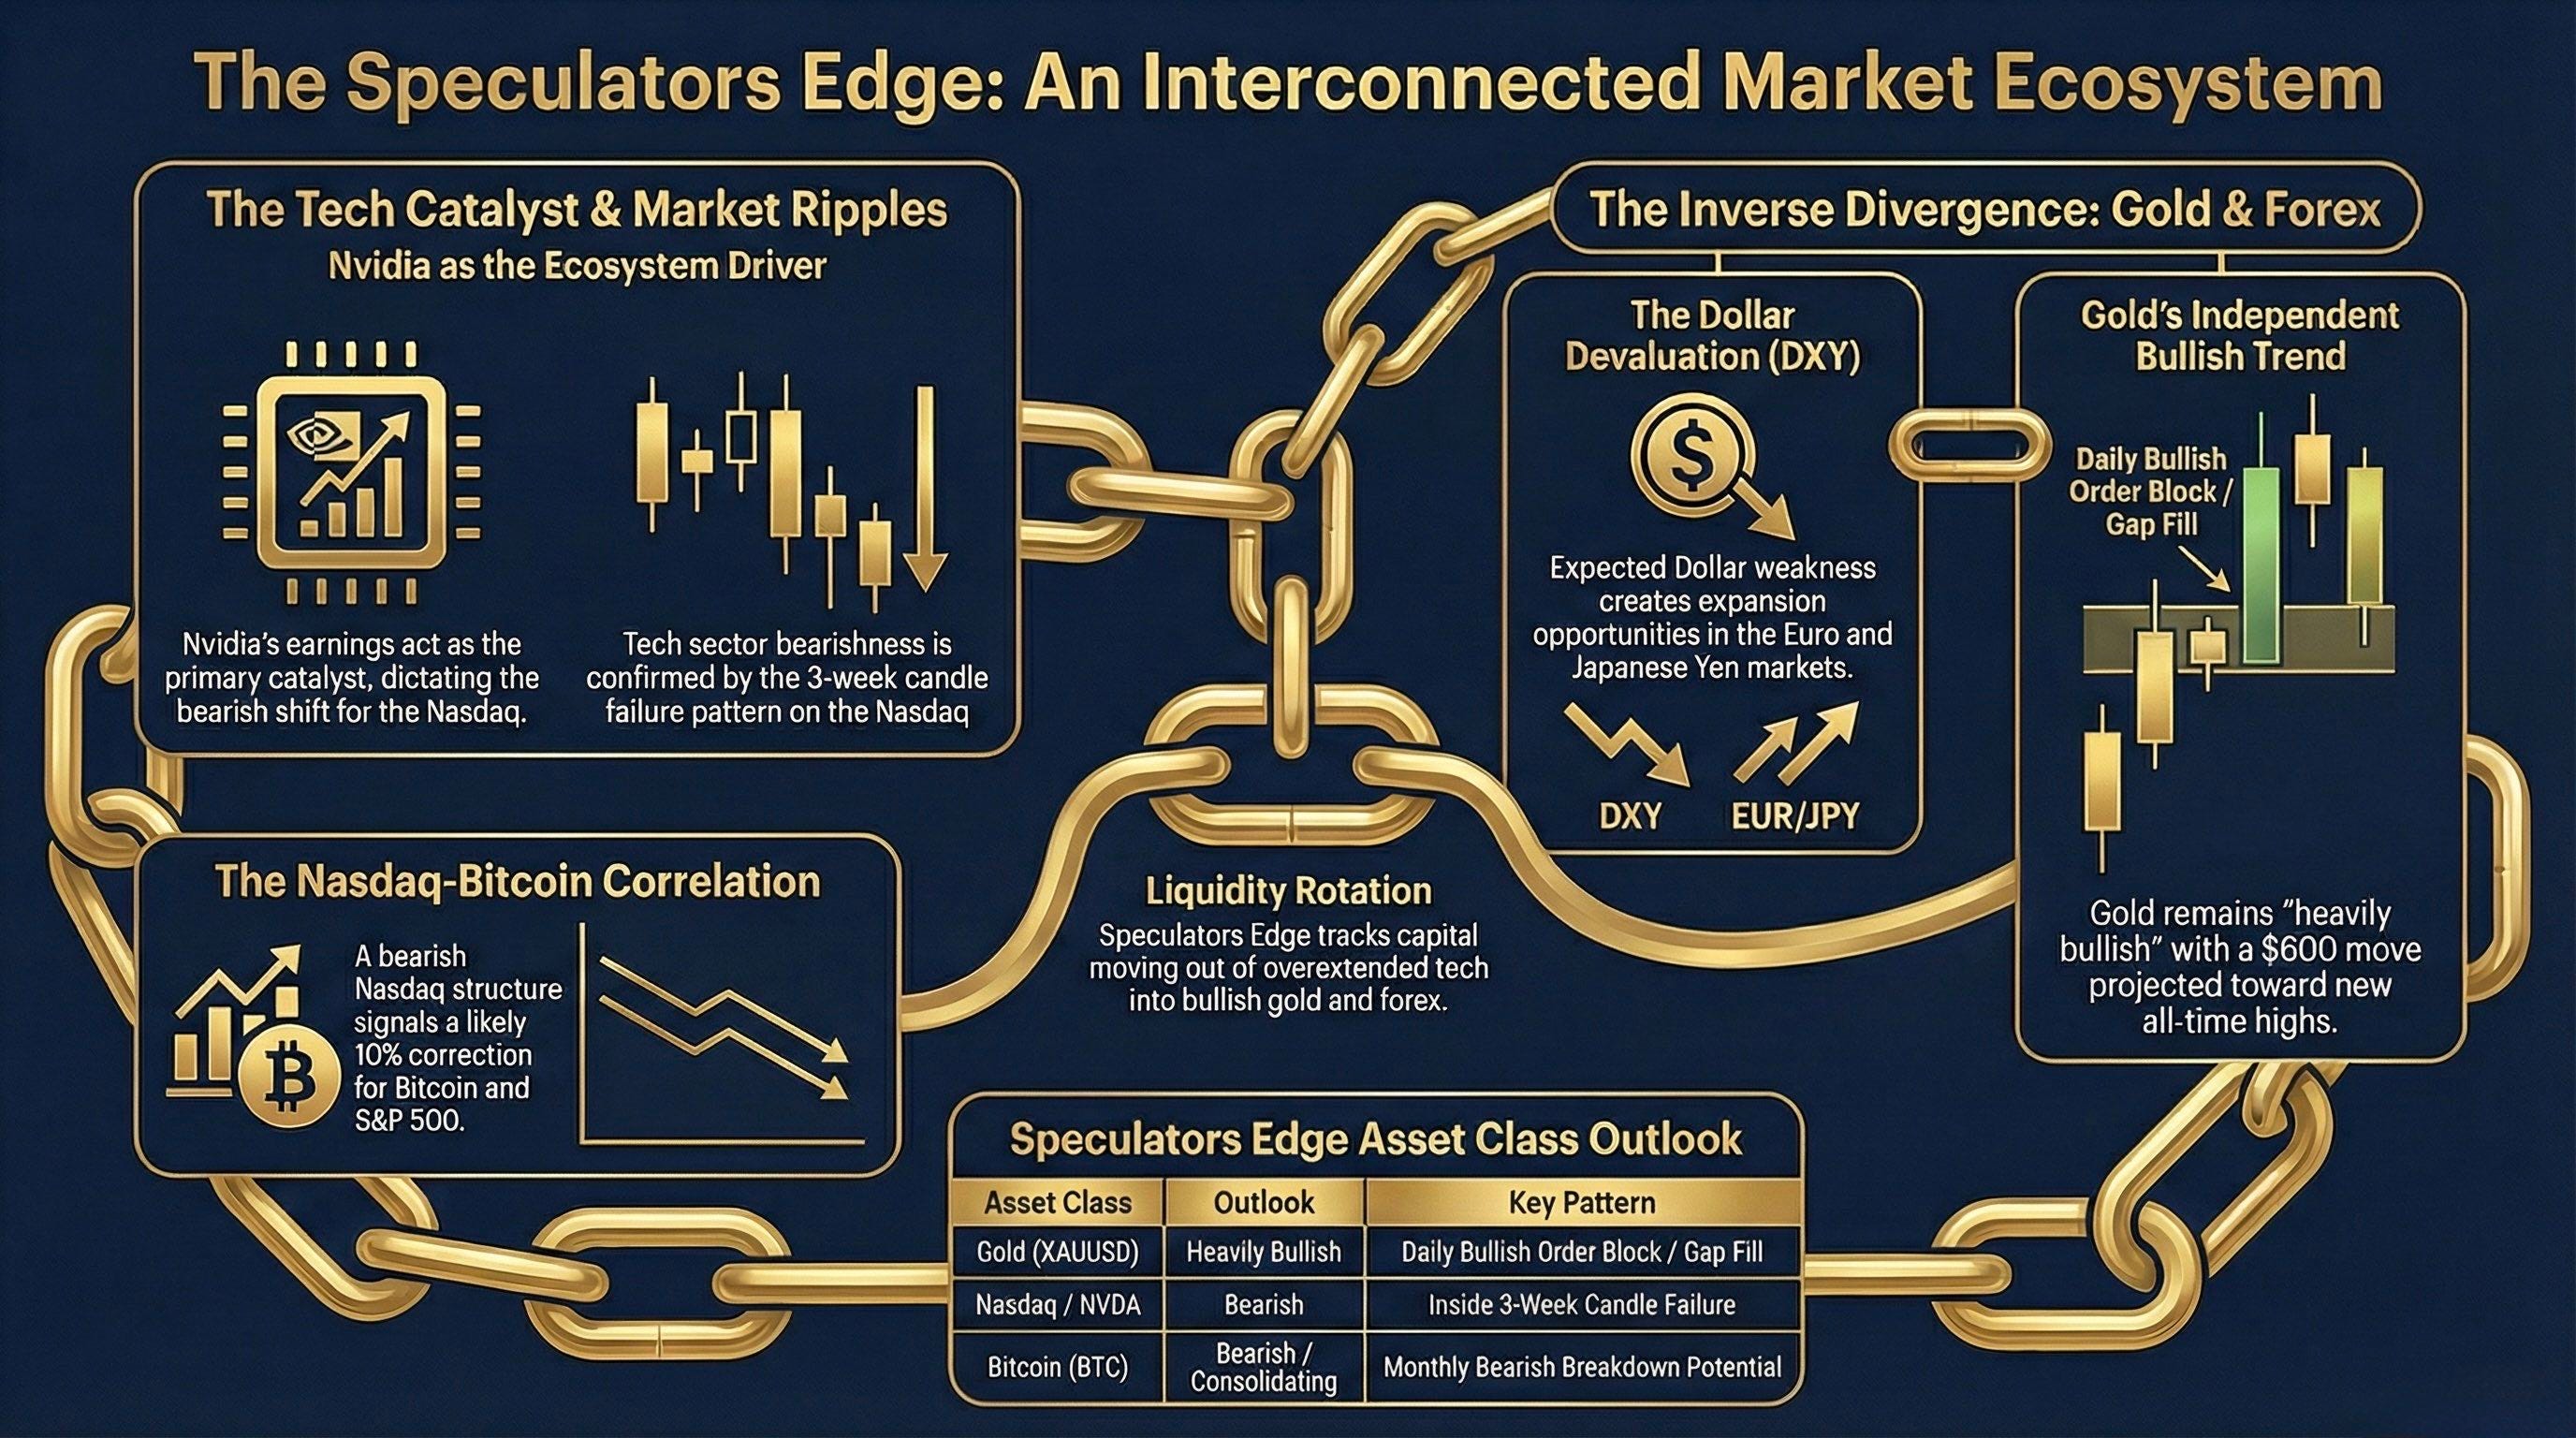
The question every trader should be asking right now isn’t whether a correction is coming, it’s whether they’ll be positioned on the right side of it when the dominoes start falling. S&P 500 sits in a precarious consolidation, trapped inside a weekly candle pattern with a rising wedge formation lurking underneath like a ticking time bomb. Bitcoin is caught between monthly timeframe breakdown levels and a potential fakeout that could send it to $49,000 or spark an unexpected reversal. The U.S. Dollar Index is flashing signals of imminent devaluation, which is fueling bullish setups in EUR/USD and sending USD/JPY cascading lower. Even the German DAX, which has been an unstoppable force, has an unfilled inefficiency that must be resolved before gravity takes over.
What looks like a calm market on the surface is actually a coiled spring of confluences, each one reinforcing the others in ways that most participants haven’t connected yet. The inside bar indicator is firing across multiple asset classes simultaneously, and the levels it’s mapping out are creating a roadmap that is almost too clean to ignore. The generational setup isn’t in the asset everyone’s watching, it’s in the chain reaction that happens when one domino tips the rest.
Here’s what you need to know heading into one of the most pivotal weeks of 2025:
Gold is targeting a 7.6% rally to fill an open gap at $5,426 on the GLD ETF, with all-time highs at $5,620 representing an 11% move from current levels.
NASDAQ has confirmed an inside three-week candle failure: a pattern that historically precedes six to nine weeks of sustained downside.
S&P 500 is neutral but fragile, with a rising wedge and a daily bullish order block at 6,766–6,794 acting as the last line of defense before a potential 6–10% correction.
Nvidia is printing bearish failures on daily, three-week, AND monthly timeframes, with downside liquidity at $169–$170 as the draw heading into earnings.
EUR/USD is poised for expansion higher as Dollar Index weakness accelerates, confirmed by USD/JPY’s three-week candle failure to the downside.
Bitcoin’s monthly close is the most important candle of the year: A Monthly close below $73,777 confirms a breakdown targeting $49,000.
VIX could spike to 28–29 on the monthly timeframe if the correction materializes, amplifying the pain across every risk asset.
The single highest-conviction trade of this cycle is forming right now—and it all converges on one earnings date.
Gold: The Unstoppable Breakout That Defies Gravity
A Bullish Trend That Refuses to Quit
Gold’s recent price action is nothing short of extraordinary and frankly, mind-boggling. Despite sitting at deeply overbought levels on virtually every momentum indicator, the metal stubbornly refuses to break its bullish structure. This is a phenomenon that speaks to the sheer force of institutional demand flowing into the safe-haven asset, and it should command the attention of every serious portfolio manager. The breakout originated from a double inside bar pattern on the higher timeframes, a consolidation structure that compressed price energy like a coiled spring before releasing it into a pure expansion mode with no signs of exhaustion anywhere on the chart.
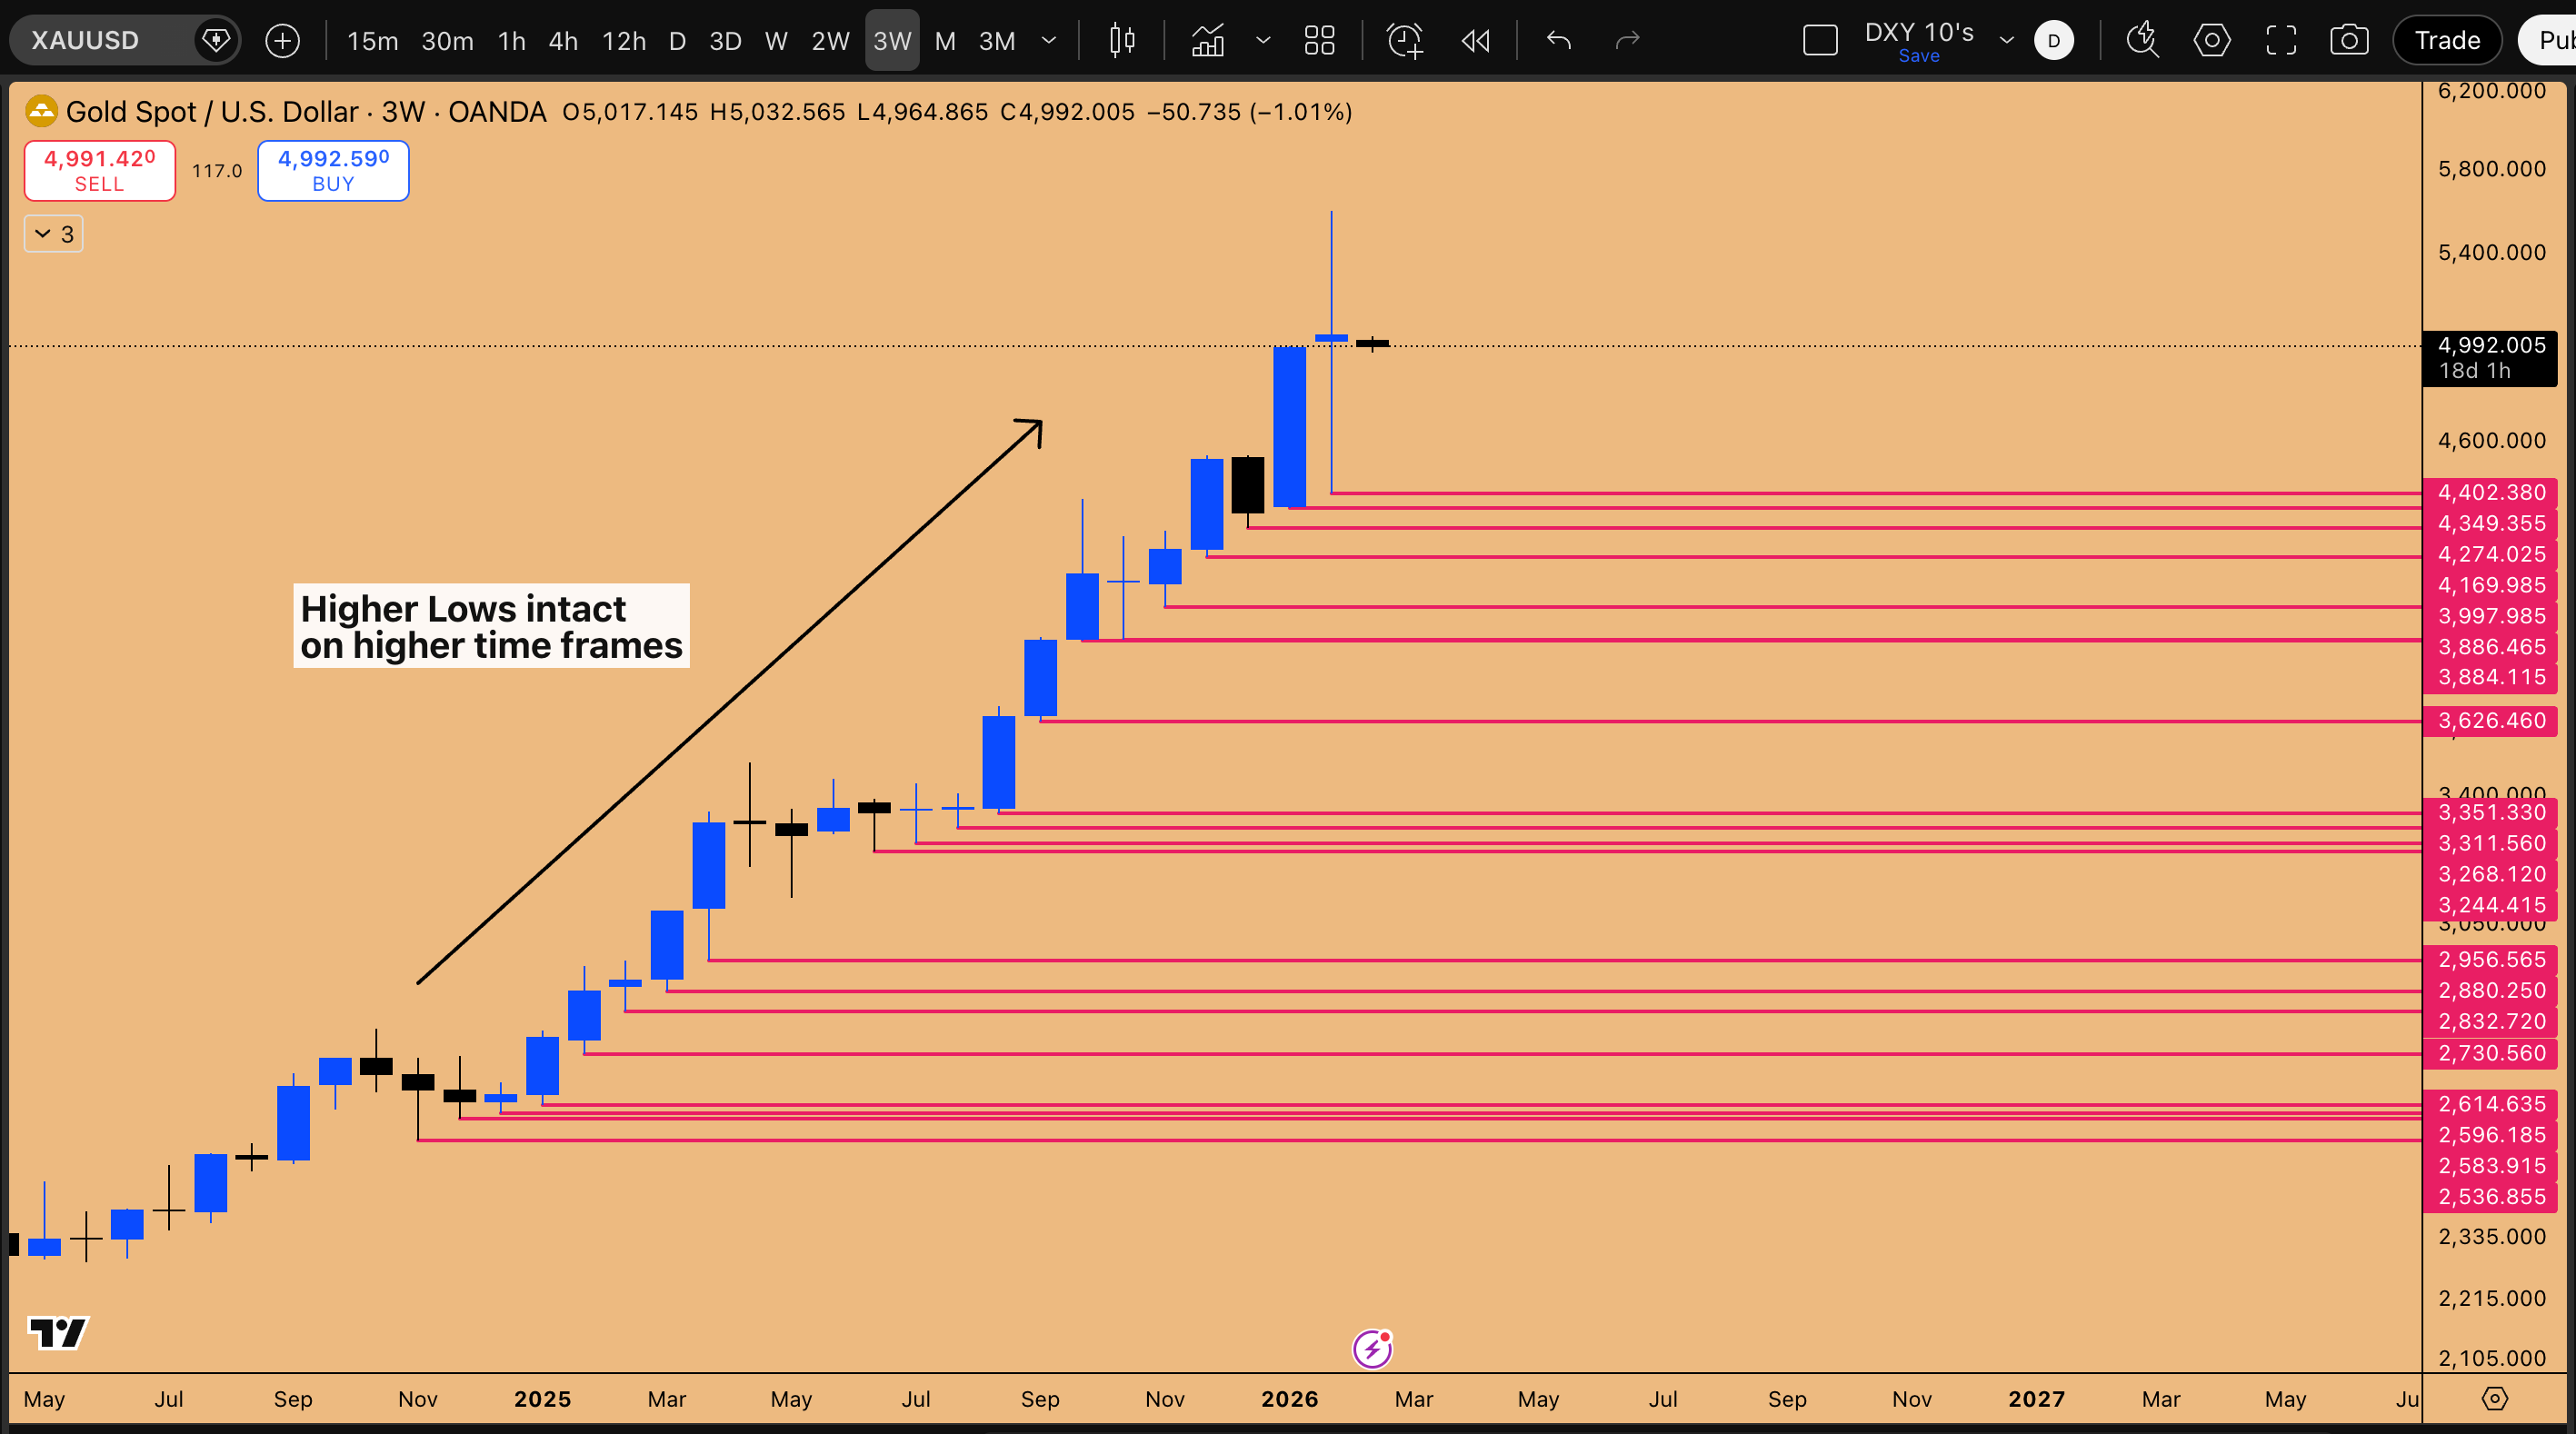
Figure 1 : Gold’s Higher low pattern remain’s intact on Higher Time frame, bullish parabola is still intact
