

Market Situation Report: NVDA Concentration Risk, a COVID-Era Seasonality Curse, and the Generational Short Setting Up in Plain Sight


Executive Summary
Something is deeply wrong beneath the surface of this market and most participants are too busy chasing the rally to notice.
On the surface, the S&P 500 is flirting with all-time highs. NASDAQ sits within striking distance of its own records. The mood is euphoric, the dip-buyers emboldened, and the FOMO palpable. But strip away the veneer of strength and a single, uncomfortable truth emerges: one company is holding the entire house of cards together. Nvidia: fresh off a 7% single-session surge that single-handedly dragged the S&P 500 higher, has become the sole load-bearing pillar of the U.S. equity market. Meanwhile, Amazon has cratered 12% on earnings, Microsoft is mired in a proper bear market down roughly 30% from its highs, Meta sits 14% below its all-time highs and is not performing, Oracle is drawing comparisons to the 2000 tech bust with a drawdown that has reached 50–60% from its top, and the Magnificent 7 ETF (MAGS) has already broken below its previous two-month low while NASDAQ has not. Apple is providing marginal support but it too is drifting lower. The divergence is screaming, and the market’s refusal to acknowledge it is precisely the kind of complacency that precedes violent repricing events.
And yet, the clock is ticking toward a singular catalyst event that could detonate it all: Nvidia’s earnings on February 25th. That is roughly 13 to 14 trading days away and the market is behaving exactly the way it does before a seismic reversal. Volatile whipsaws, emotional price action, liquidity hunts to the upside, this is the playbook of a market luring participants in before pulling the rug. Consider the precedent: the last time Nvidia topped out, it did not quietly roll over. It broke out of consolidation, executed a violent spike that drew in every momentum chaser and then delivered three consecutive weeks of devastating downside. The Nikkei recently exhibited the same dynamic going into Japan’s federal elections: a rally into the catalyst, a sharp gap up, then immediate profit-taking that morphed into a topping formation.
What makes this setup so extraordinary and so dangerous, is the sheer number of independent signals converging on the same conclusion. A COVID-era seasonality anomaly has caused mid-February through mid-March to deliver punishing drawdowns in every single year since 2020. Silver, which has been quietly controlling global liquidity flows, has printed a textbook five-wave impulsive decline on the Elliott Wave framework: confirming its cycle top is in. Bitcoin, historically a leading indicator for NASDAQ, has already broken below its tariff-crash low while NASDAQ remains near highs, a pattern that mirrors almost exactly the divergence witnessed before the devastating 2022 bear market. USD/JPY is building a case for a sharp decline toward the 147–149 gap, which would trigger a risk-off cascade through the Nikkei and into U.S. indices. And the Dow Jones has printed 10 consecutive green monthly candles a stretch not seen since January 2018, just before the reverse repo market blowup sent equities spiraling.
What looks like strength today is setting the stage for something far more violent. But the payoff, the upcoming trade requires patience, precision, and an understanding of exactly where the dominoes are lined up. That is what this analysis delivers.
Nvidia is the sole driver of the S&P 500 and NASDAQ rally; every other mega-cap has decoupled and broken down
An SMT divergence is forming: the S&P500 nearing all-time highs while NASDAQ lags, a pattern historically seen only at major tops.
SMH’s quarterly chart contains a wickless open gap that signals extreme fragility in the semiconductor rally
COVID-era seasonality has produced mid-February to mid-March selloffs in every year from 2020 to 2024 and Nvidia’s earnings fall directly in the kill zone
Bitcoin is flashing the same warning it flashed before the 2022 collapse: breaking down months before NASDAQ catches up
Silver’s Elliott Wave structure confirms a cycle top, with implications for global liquidity withdrawal
USD/JPY is set to fill a gap at 147–149, threatening a Nikkei-led risk-off cascade
A specific, high-conviction put option strategy is being staged for execution once the final liquidity sweep completes
The S&P 500 Illusion: Gap Dynamics and a U-Turn Built on Sand
The Friday Reversal and the Unfilled Gap
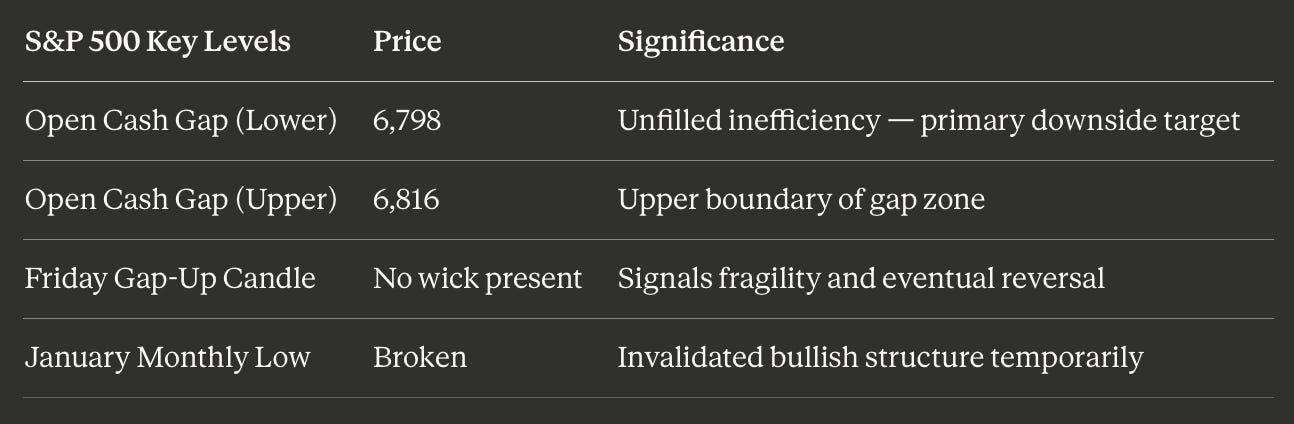
Friday’s price action in the S&P 500 delivered one of those moments that separates disciplined analysts from reactive traders. Nvidia’s explosive 7% rally dragged the index higher in a dramatic U-turn reversal, without ever filling the open gap on the cash index. That gap, sitting between 6,798 and 6,816, remains conspicuously open. And the nature of the gap-up candle on Friday is telling: there is no wick present, meaning the squeeze that propelled the market higher left behind a significant inefficiency.
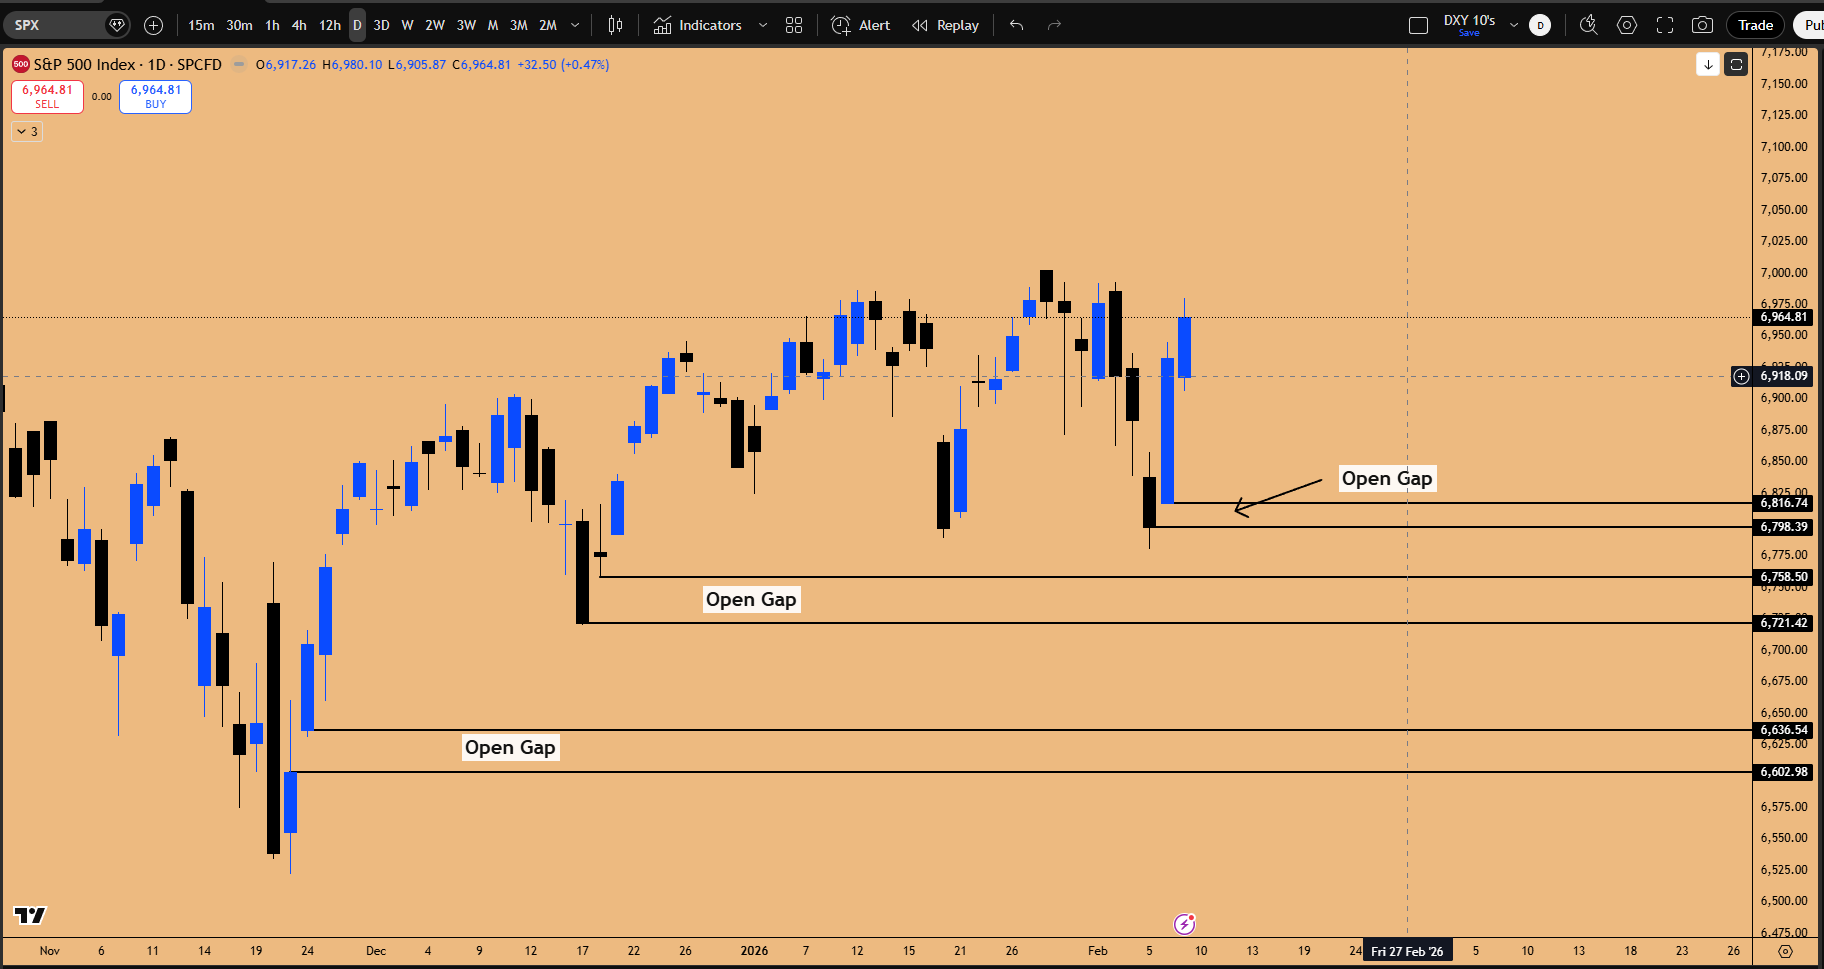
Figure 1 : Open gap’s left on the downside as SPX500 Cash Index chugs higher, market will revisit all these open inefficiencies
When this squeeze tops out and the market begins retracing, it is not going to just consolidate. It is going to be a full U-turn reversal targeting that open inefficiency at 6,798 to 6,816.
The natural emotional response here is FOMO: the frustration of watching a move happen without being positioned for it. But this was one of those moments where the market had to show its hand first. January’s monthly low had been taken out, and once a monthly low breaks, the probability framework shifts dramatically. The higher-probability outcome was further downside to fill the gap, not a V-shaped reversal. Some things simply cannot be predicted in advance; you work with the aftermath.
NASDAQ and the Dangerous Divergence
Why the S&P Is Lying About Market Health
Here is the divergence that should have every institutional desk on high alert: the S&P 500 is positioning to make a new all-time high, but NASDAQ is nowhere close. This pattern where the broader index stretches toward records while the tech-heavy benchmark lags is called an SMT divergence, and it is only formed near topping-out patterns.
