Market Situation Report: S&P 500 Breakouts, the NASDAQ Catch-Up, and the AI-Energy Revolution

Executive Summary: Mapping the Path to 7,100
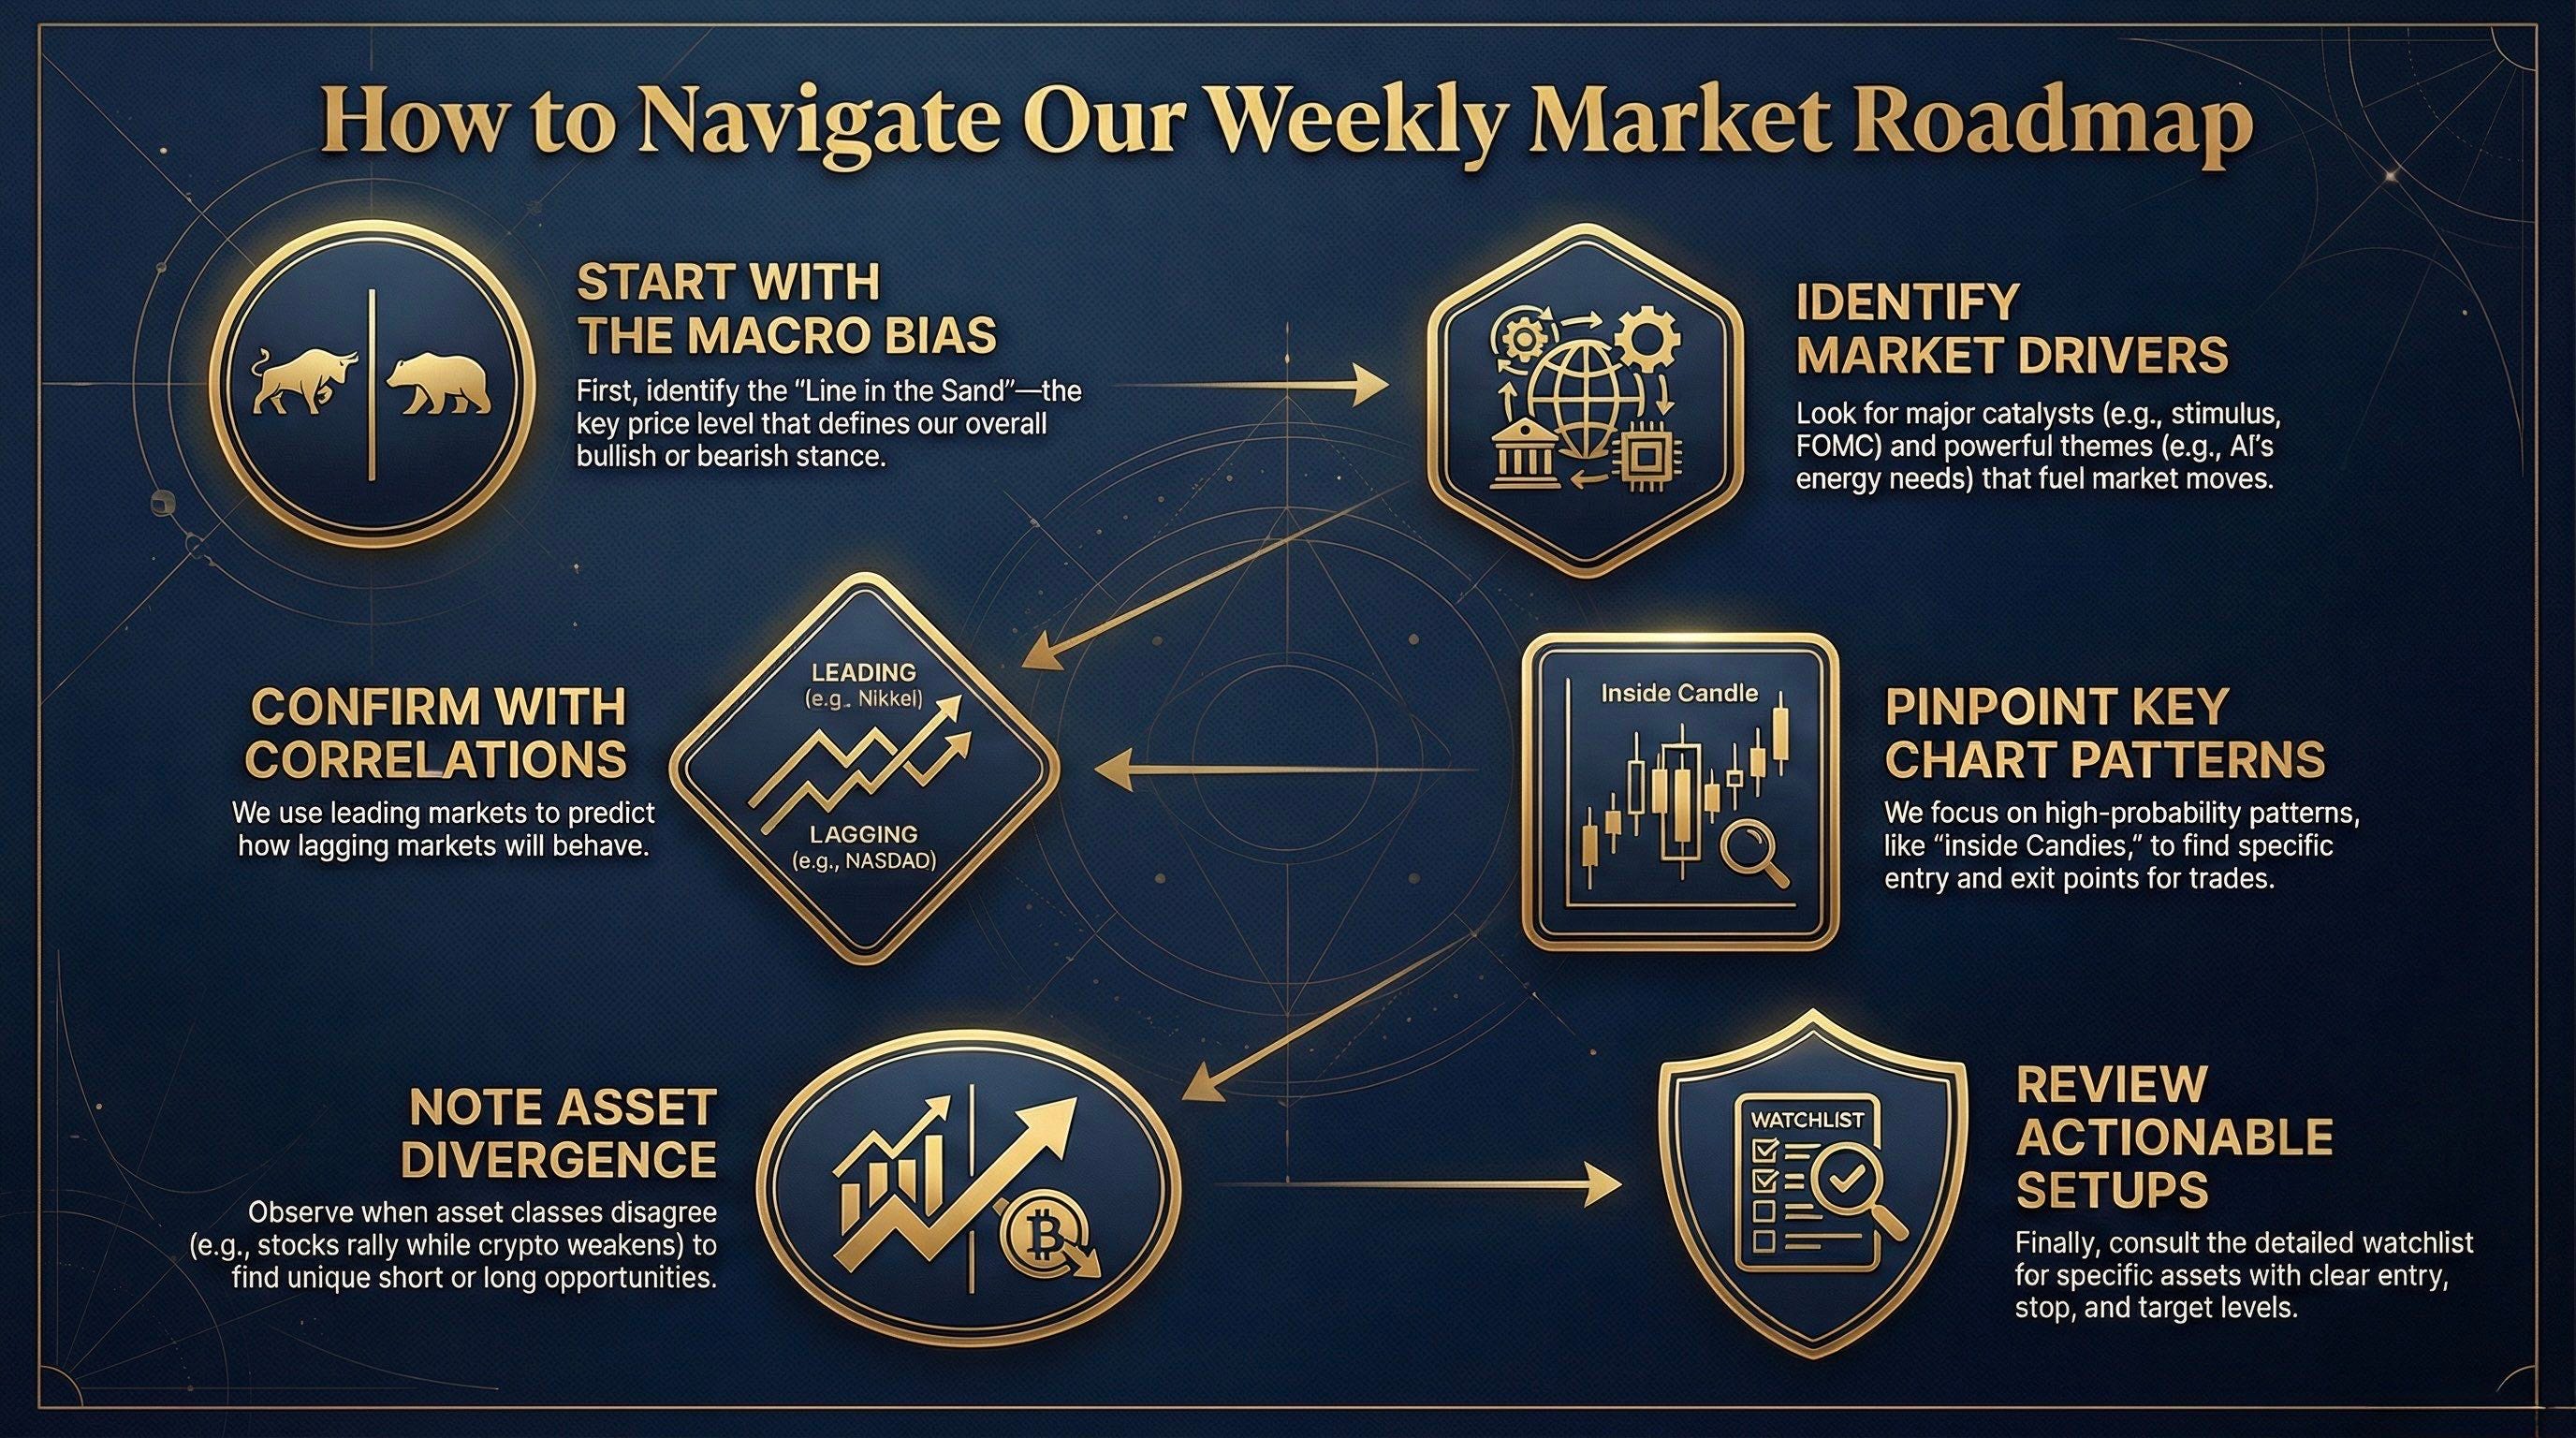
Welcome to the first weekly briefing report of 2026. If you’ve been following our quarterly outlook, you know the stage was set for a massive kickstart to the year. The markets didn’t just open; they fired off with precision. We began the year with a core long position on the S&P 500, a trade predicated on a very specific technical inefficiency: the weekly open gap. The market moved with algorithmic certainty to fill that gap, tagging the 6513 level to the tick before reversing into a violent rally toward new all-time highs.
But why does this matter for your portfolio now? We are currently witnessing a bullish market structure that many are mistaking for a “top.” Let’s be clear: as long as the market remains above our “Line in the Sand” at 6831, the bias is strictly long. We are seeing a structural repetition of the 2021 Post-COVID rally, characterized by vertical expansions and shallow, sideways consolidations. While the NASDAQ has lagged behind the S&P 500, history and index correlation (specifically the Nikkei-NASDAQ link) suggest a massive catch-up trade is imminent.
What does this mean for your portfolio? It means that fading this move because “it’s gone up too far” is a recipe for disaster. We are looking at a market driven by a unique confluence of institutional positioning and impending retail liquidity. Key themes for the coming weeks include:
The IRS Stimulus Catalyst: A massive liquidity injection in the form of tax rebates ($2,000–$3,000 per household) is slated for March, providing a floor for retail-heavy stocks like Robinhood (HOOD).
The AI Energy Bottleneck: We are shifting focus from software to the “physical frontier” of AI. Companies like Bloom Energy (BE) and Fluence (FLNC) are behaving like “equity altcoins,” posting 40-50% gains as data centers scramble for power.
Crypto’s Tactical Pause: Unlike the equity markets, Bitcoin and Ethereum are showing signs of liquidity exhaustion. We are tracking a short setup at $98,200 for BTC and a potential re-entry at the $80,600 quarterly low sweep.
This post breaks down every major and minor asset class discussed in our latest session, from USD/JPY’s double inside 3-week candle breakout to the robotics revolution at Amazon. If you are looking for the “Alpha Edge” in a market that seems to go up every week, you’ll find the roadmap below.