

Market Situation Report: The Structure Has Flipped. Is Volmageddon Next?


Executive Summary: When Every Timeframe Aligns Bearish, the Real Fear Hasn’t Even Started
Something seismic is happening beneath the surface of financial markets and almost nobody is paying attention.
For three consecutive weeks, this publication tracked a single pattern with surgical precision: the inside monthly candle failure on the S&P 500. Week after week, we outlined the thesis. Week after week, the market inched closer to confirmation. And now, the verdict is in. The pattern has played out exactly as projected, driving the index down to the long-standing target of 6,510 the open liquidity pool that had been sitting untouched on the higher timeframe chart like a gravitational inevitability. Every downside liquidity pool has been cleared following the FOMC announcement and quad witching expiration.

But here’s where the story takes a darker turn. This wasn’t just a routine pullback. The S&P 500 has flipped its market structure on the monthly timeframe. Monthly lows have been breached. And when you zoom out to the quarterly chart, the picture becomes even more ominous: the previous quarter’s low has also been taken out. Weekly, three-week, monthly, three-month every macro timeframe is now aligned bearishly. In over a decade of tracking algorithmic price action, this level of multi-timeframe bearish confluence is exceedingly rare, and it carries a singular implication: a volatility event is building that has not yet arrived.
What makes this moment so treacherous is the illusion of calm. The VIX has actually been declining alongside the S&P 500 over the past two weeks a textbook signature of complacency, not capitulation. The market is falling, yet fear is absent. That disconnect is not reassuring; it is a warning siren. If market structure is breaking down across every timeframe while the VIX trends lower, the logical conclusion is that the real spike in volatility is still ahead, not behind us.
Meanwhile, the NASDAQ sits in a precarious state of denial, propped up almost entirely by Nvidia while Microsoft has already broken quarterly support. The semiconductor sector the last line of defense is showing the same counter-trend rally patterns that preceded the 2018 Bitcoin bear market. US 10-year yields are surging, the dollar index is coiling for a breakout, and the forex complex is offering swing setups with risk-reward ratios exceeding 5:1.
And yet, buried within all this bearish confluence lies the ultimate contrarian opportunity: the Volmageddon event that will precede the next central bank intervention and the generational bottom it will create. The question is whether you’re positioned to survive the storm and capitalize on the other side.
Here’s what we’re breaking down this week:
S&P 500 inside monthly failure has completed: 6,510 liquidity pool cleared, and the market has flipped bearish on four timeframes simultaneously
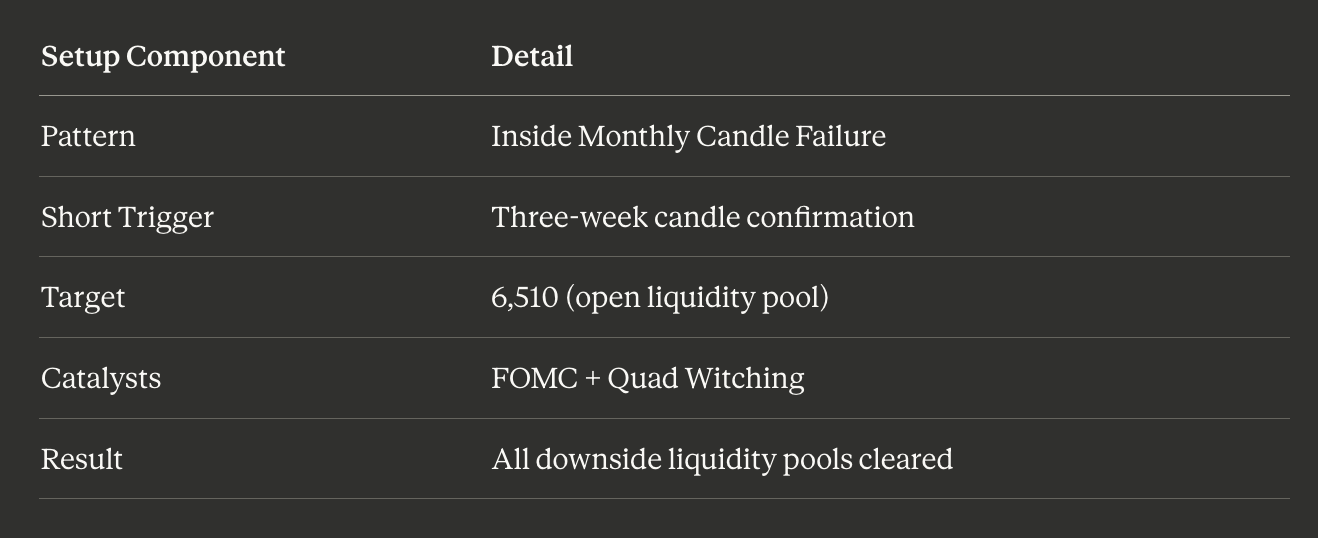
VIX complacency signals the real volatility spike is ahead, with quarterly targets between 59 and 66
NASDAQ divergence is unsustainable as Microsoft breaches quarterly support and a massive gap between 19,312 and 24,000 awaits
Semiconductor cracks in LRCX and MU mirror the counter-trend rally that preceded Bitcoin’s 70% crash in 2018
US 10-year yields are targeting 4.46–4.63, confirming a bullish dollar thesis that forces global risk assets lower
AUDUSD and GBPUSD swing shorts offer 5.59 and 2.9 risk-reward ratios respectively
Bitcoin has already priced in much of its correction with a 52% drawdown, likely entering a multi-month range between 60,000 and 74,000
A coming Volmageddon flush will set the stage for the central bank’s money-printing bazooka and the generational buying opportunity that follows
The S&P 500 Verdict: Three Weeks of Patience, One Decisive Breakdown
Inside Monthly Failure: Mission Accomplished
The setup that has dominated the past three episodes has reached its conclusion. The inside monthly candle failure on the S&P 500 first identified as a structural short trigger three weeks ago has driven the index to its target at 6,510. This was not a speculative projection. It was a mapped liquidity pool on the larger timeframe chart, an algorithmic magnet that the market was destined to test once the failure pattern was confirmed.
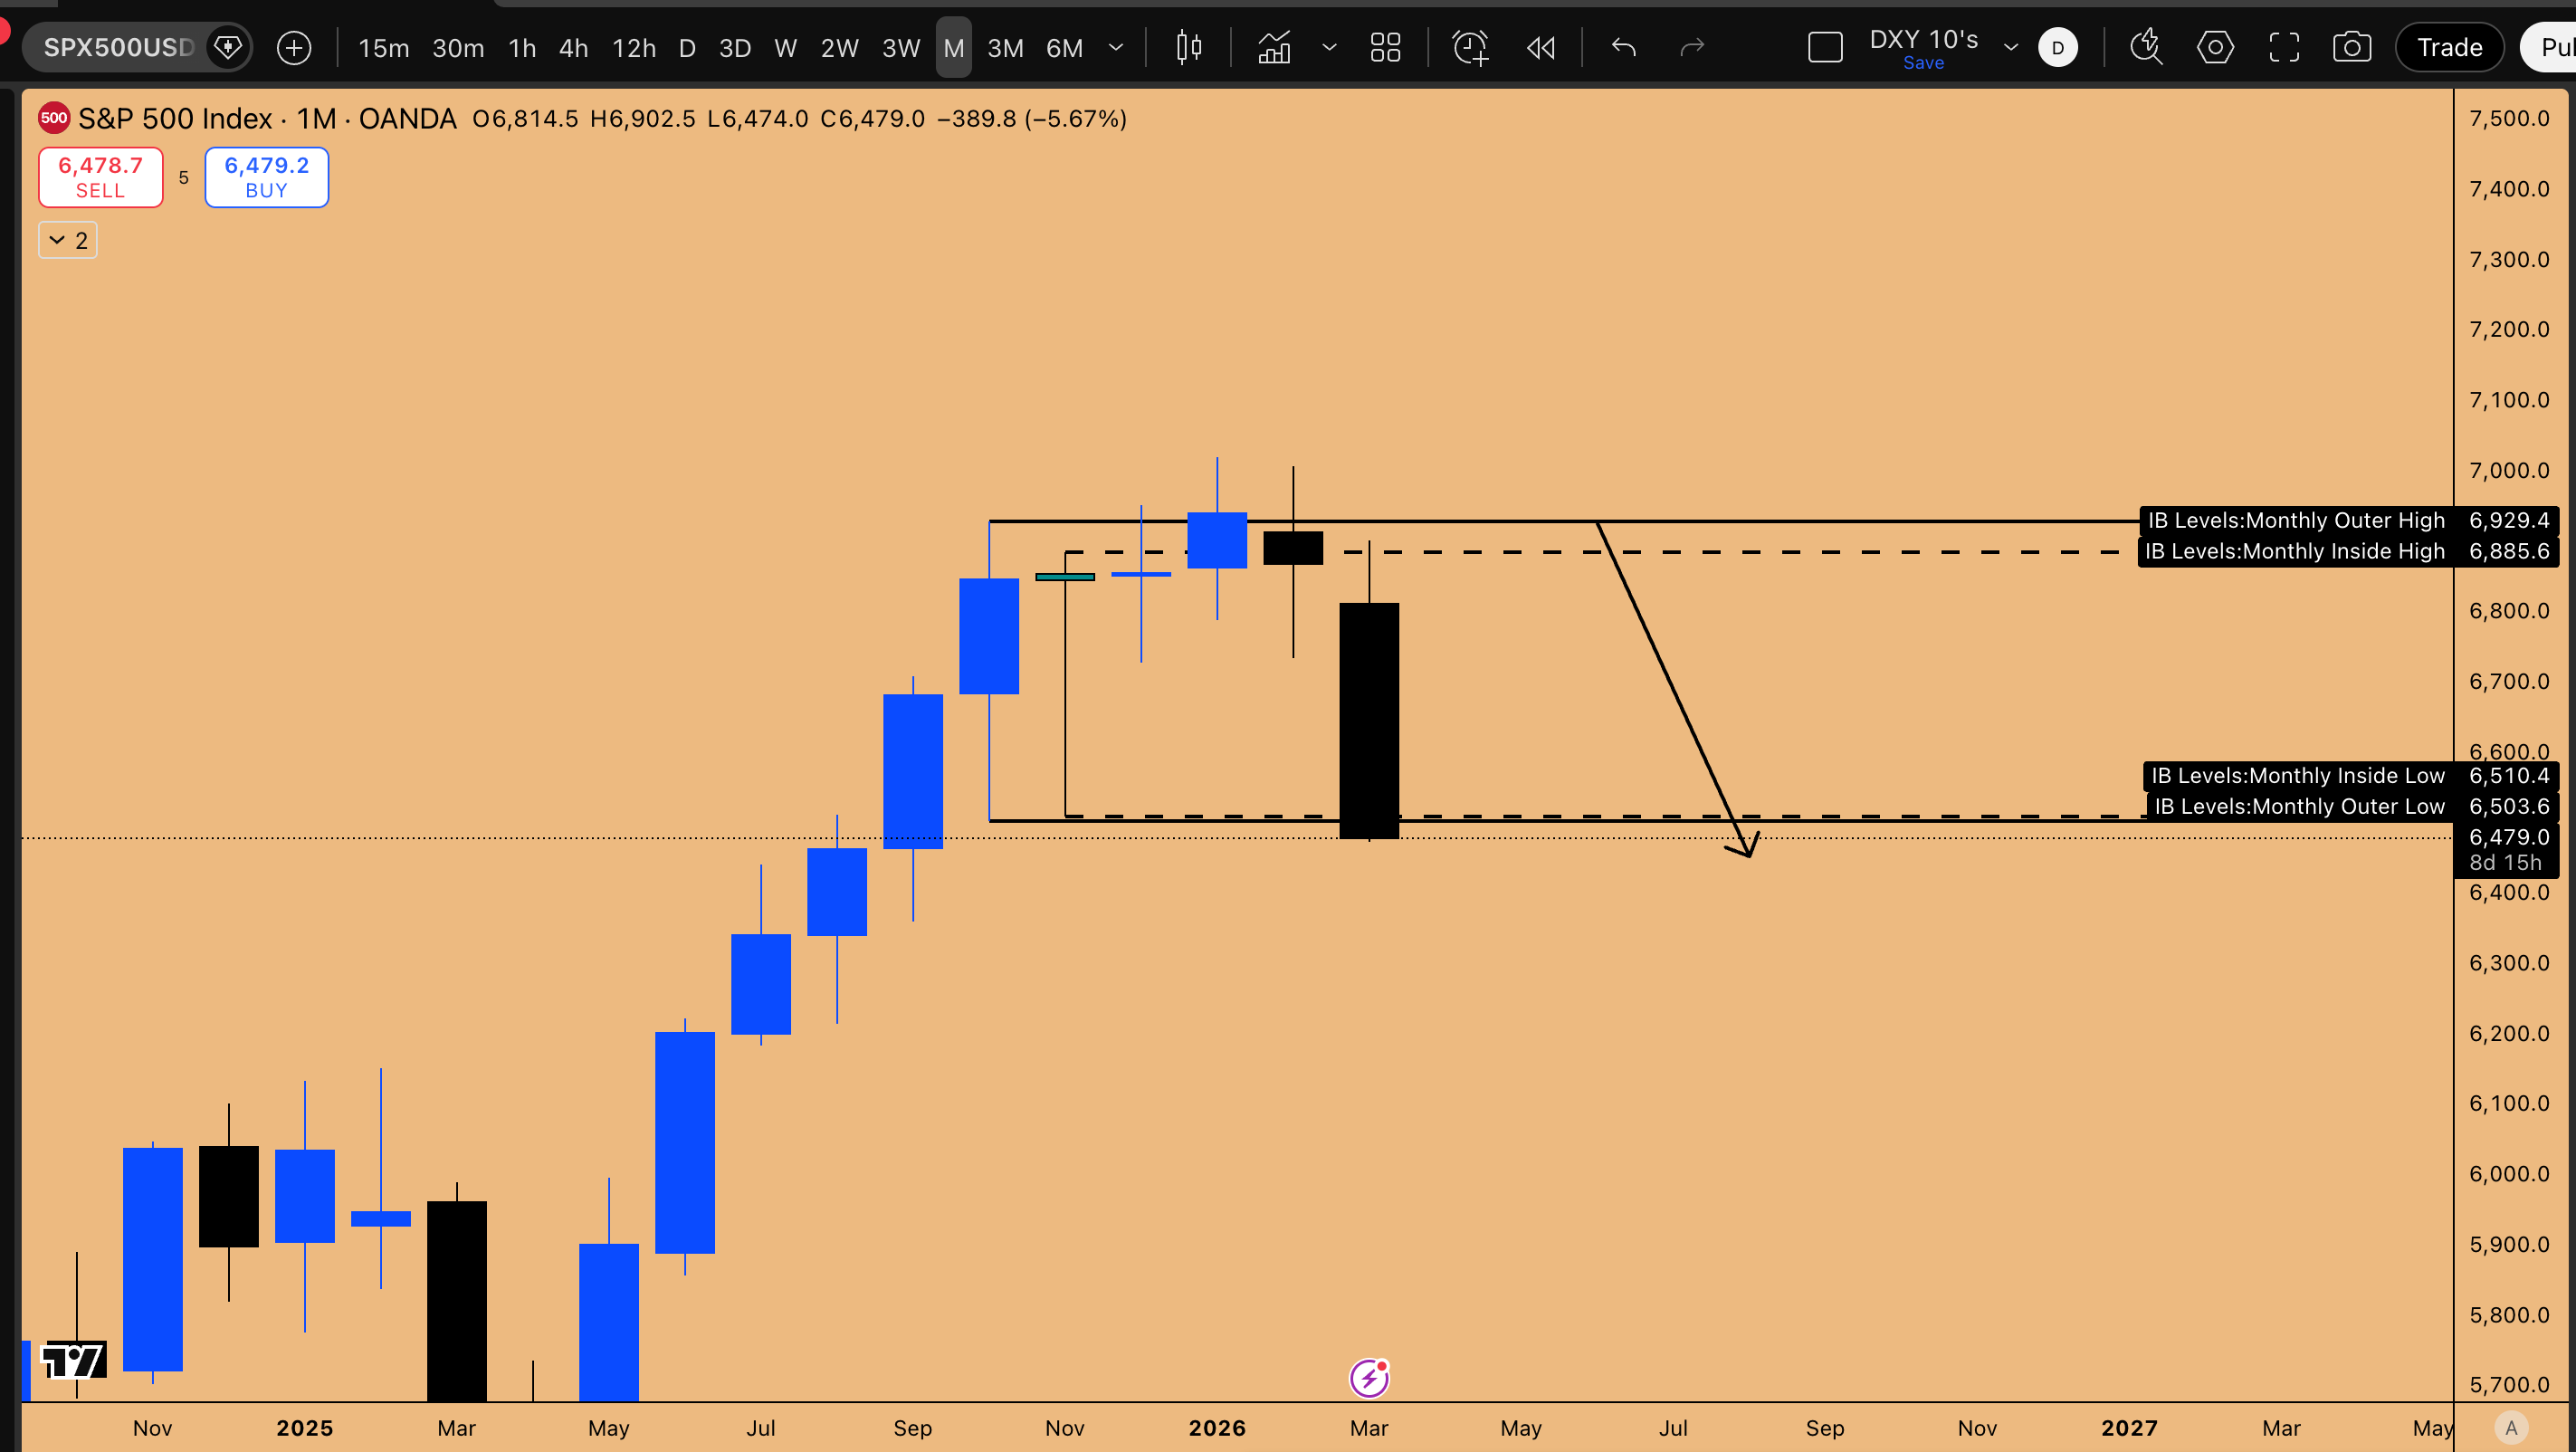
Figure 1: Inside Monthly Candle Failure played out on SPX500
The FOMC decision and quad witching served as the catalytic events that accelerated the move, flushing out every remaining downside liquidity pool in the process. What took weeks to set up resolved in a matter of sessions. The significance of this completion cannot be overstated 6,510 was not an arbitrary level but a long-standing target derived from the larger timeframe pattern. The algorithm found its liquidity, consumed it, and now the question shifts from where is the market going? to what does the structure look like after it got there?
The Quarterly Flip: A Rare and Dangerous Signal
But the implications extend far beyond a single completed trade. The S&P 500 has now flipped its market structure on the monthly timeframe, and the quarterly chart has confirmed the same signal: the previous quarter’s low has been breached.
When the previous quarter’s low is taken out, that is not a signal to go long on everything in the market. It is a signal for the algorithm that we are shifting the market structure to the bearish side on the macro timeframe.
This multi-timeframe alignment: weekly, three-week, monthly, and quarterly all bearish is the kind of structural convergence that historically precedes significant volatility events, not routine corrections. The algorithm is not pulling back to refresh. It is restructuring.
The VIX Deception: Why Complacency Is the Real Danger
Declining Together: The Worst Possible Signal
The most dangerous narrative in the market right now is the assumption that peak fear has already occurred. Two weeks ago, the VIX spiked as the S&P 500 took out its inside weekly and monthly candle highs on the wicks during the geopolitical conflict involving Iran. Many interpreted that as the climax.
It was not.
Consider the evidence: at the time of that VIX spike, the S&P 500 was sitting considerably higher than its current level. Over the ensuing two weeks, the index has trended lower and the VIX has trended lower alongside it. When the market declines and volatility declines simultaneously, that is not resolution. That is complacency embedded within a structural breakdown.
The NASDAQ’s Achilles Heel: When Nvidia Can’t Hold the Line Alone
Microsoft Has Already Broken: NASDAQ Hasn’t Noticed
The divergence between the S&P 500 and the NASDAQ over the past two weeks tells a revealing story. The S&P has been notably weaker, dragged down by the Dow Jones, which has been selling off more aggressively. The NASDAQ, meanwhile, has displayed relative resilience. But that resilience is an illusion built on the narrowest of foundations: Nvidia.
The price action on Nvidia and the NASDAQ is virtually identical. The index isn’t showing bearishness because Nvidia hasn’t broken down yet. It is a single-stock support beam for the entire structure. Meanwhile, Microsoft, the name that drove the NASDAQ higher from the 2022 bottom has already shattered quarterly support. The quarterly candle formations of Microsoft and the NASDAQ have tracked almost identically since the 2022 lows. That correlation has now diverged, with Microsoft trading at levels equivalent to where the NASDAQ sat at 19,255.
Component Status Nvidia Still supporting NASDAQ price action nearly identical Microsoft Broken quarterly support; trading at NASDAQ-equivalent 19,255 NASDAQ Open Gap 19,312 to 24,000 Expected Resolution Coming quarter NASDAQ plays catch-up with Microsoft
There is a massive open gap between 20,061 and 20,613 in the NASDAQ that mirrors what Microsoft has already shown. It is difficult to imagine a scenario where the NASDAQ continues higher while Microsoft continues to decline. Once Microsoft’s quarterly close confirms this breach, the macro thesis can no longer be classified as bullish.
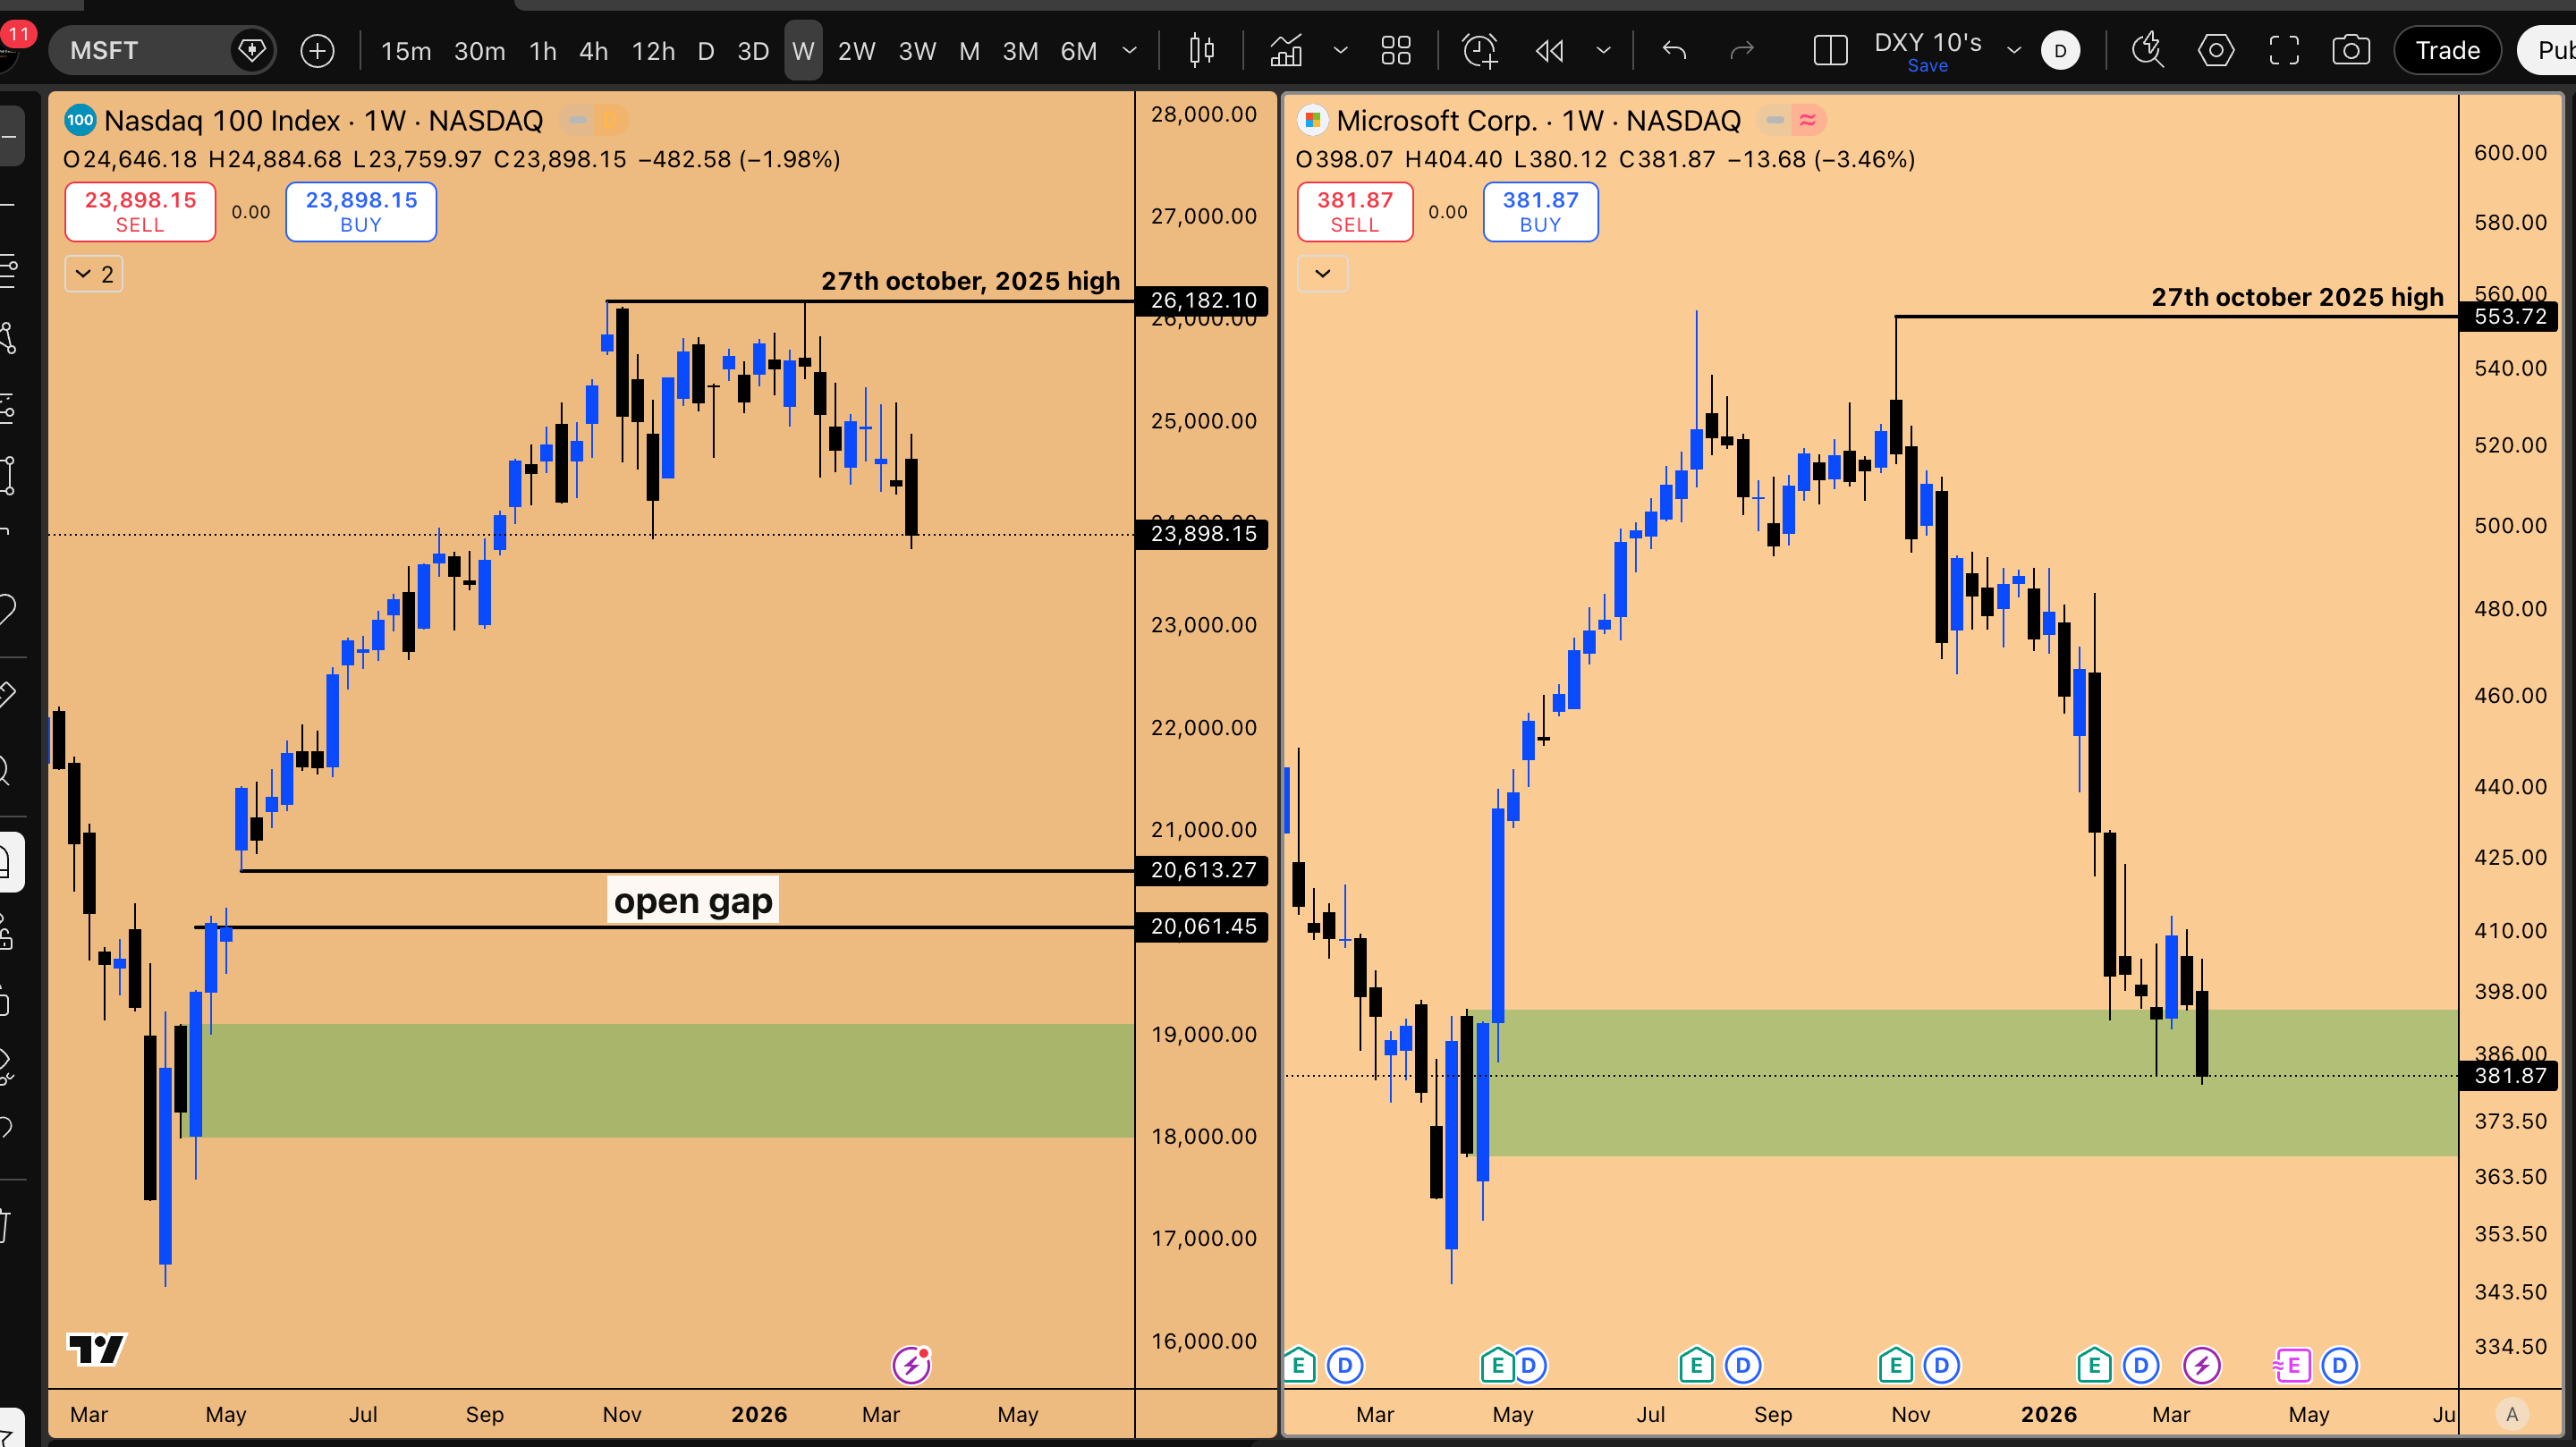
Figure 2: NDX vs MSFT
The timeline is important here. In the next nine days, as the current quarter closes, further aggressive downside expansion is unlikely absent an extraordinary catalyst. The market may chop sideways or produce a counter-trend rally. But when the new quarter opens, the resolution begins. If Microsoft closes at these levels, breaching quarterly support, the structural message to the NASDAQ is unambiguous: follow or be dragged. The real expansion to the downside will commence with the opening of the next quarter, and the NASDAQ will be forced to play catch-up with the damage Microsoft has already priced in.
Semiconductor Sector: The Counter-Trend Rally That Mirrors 2018 Bitcoin
LRCX, Micron, and the False Rally Flag
The SMH semiconductor ETF is a primary reason the NASDAQ remains at its current level. This divergence is heavily influenced by LRCX, which carries significant sector weight. But even LRCX has broken its market structure by taking out the previous month’s low. What’s occurring now is a counter-trend bounce that is likely nearing exhaustion.
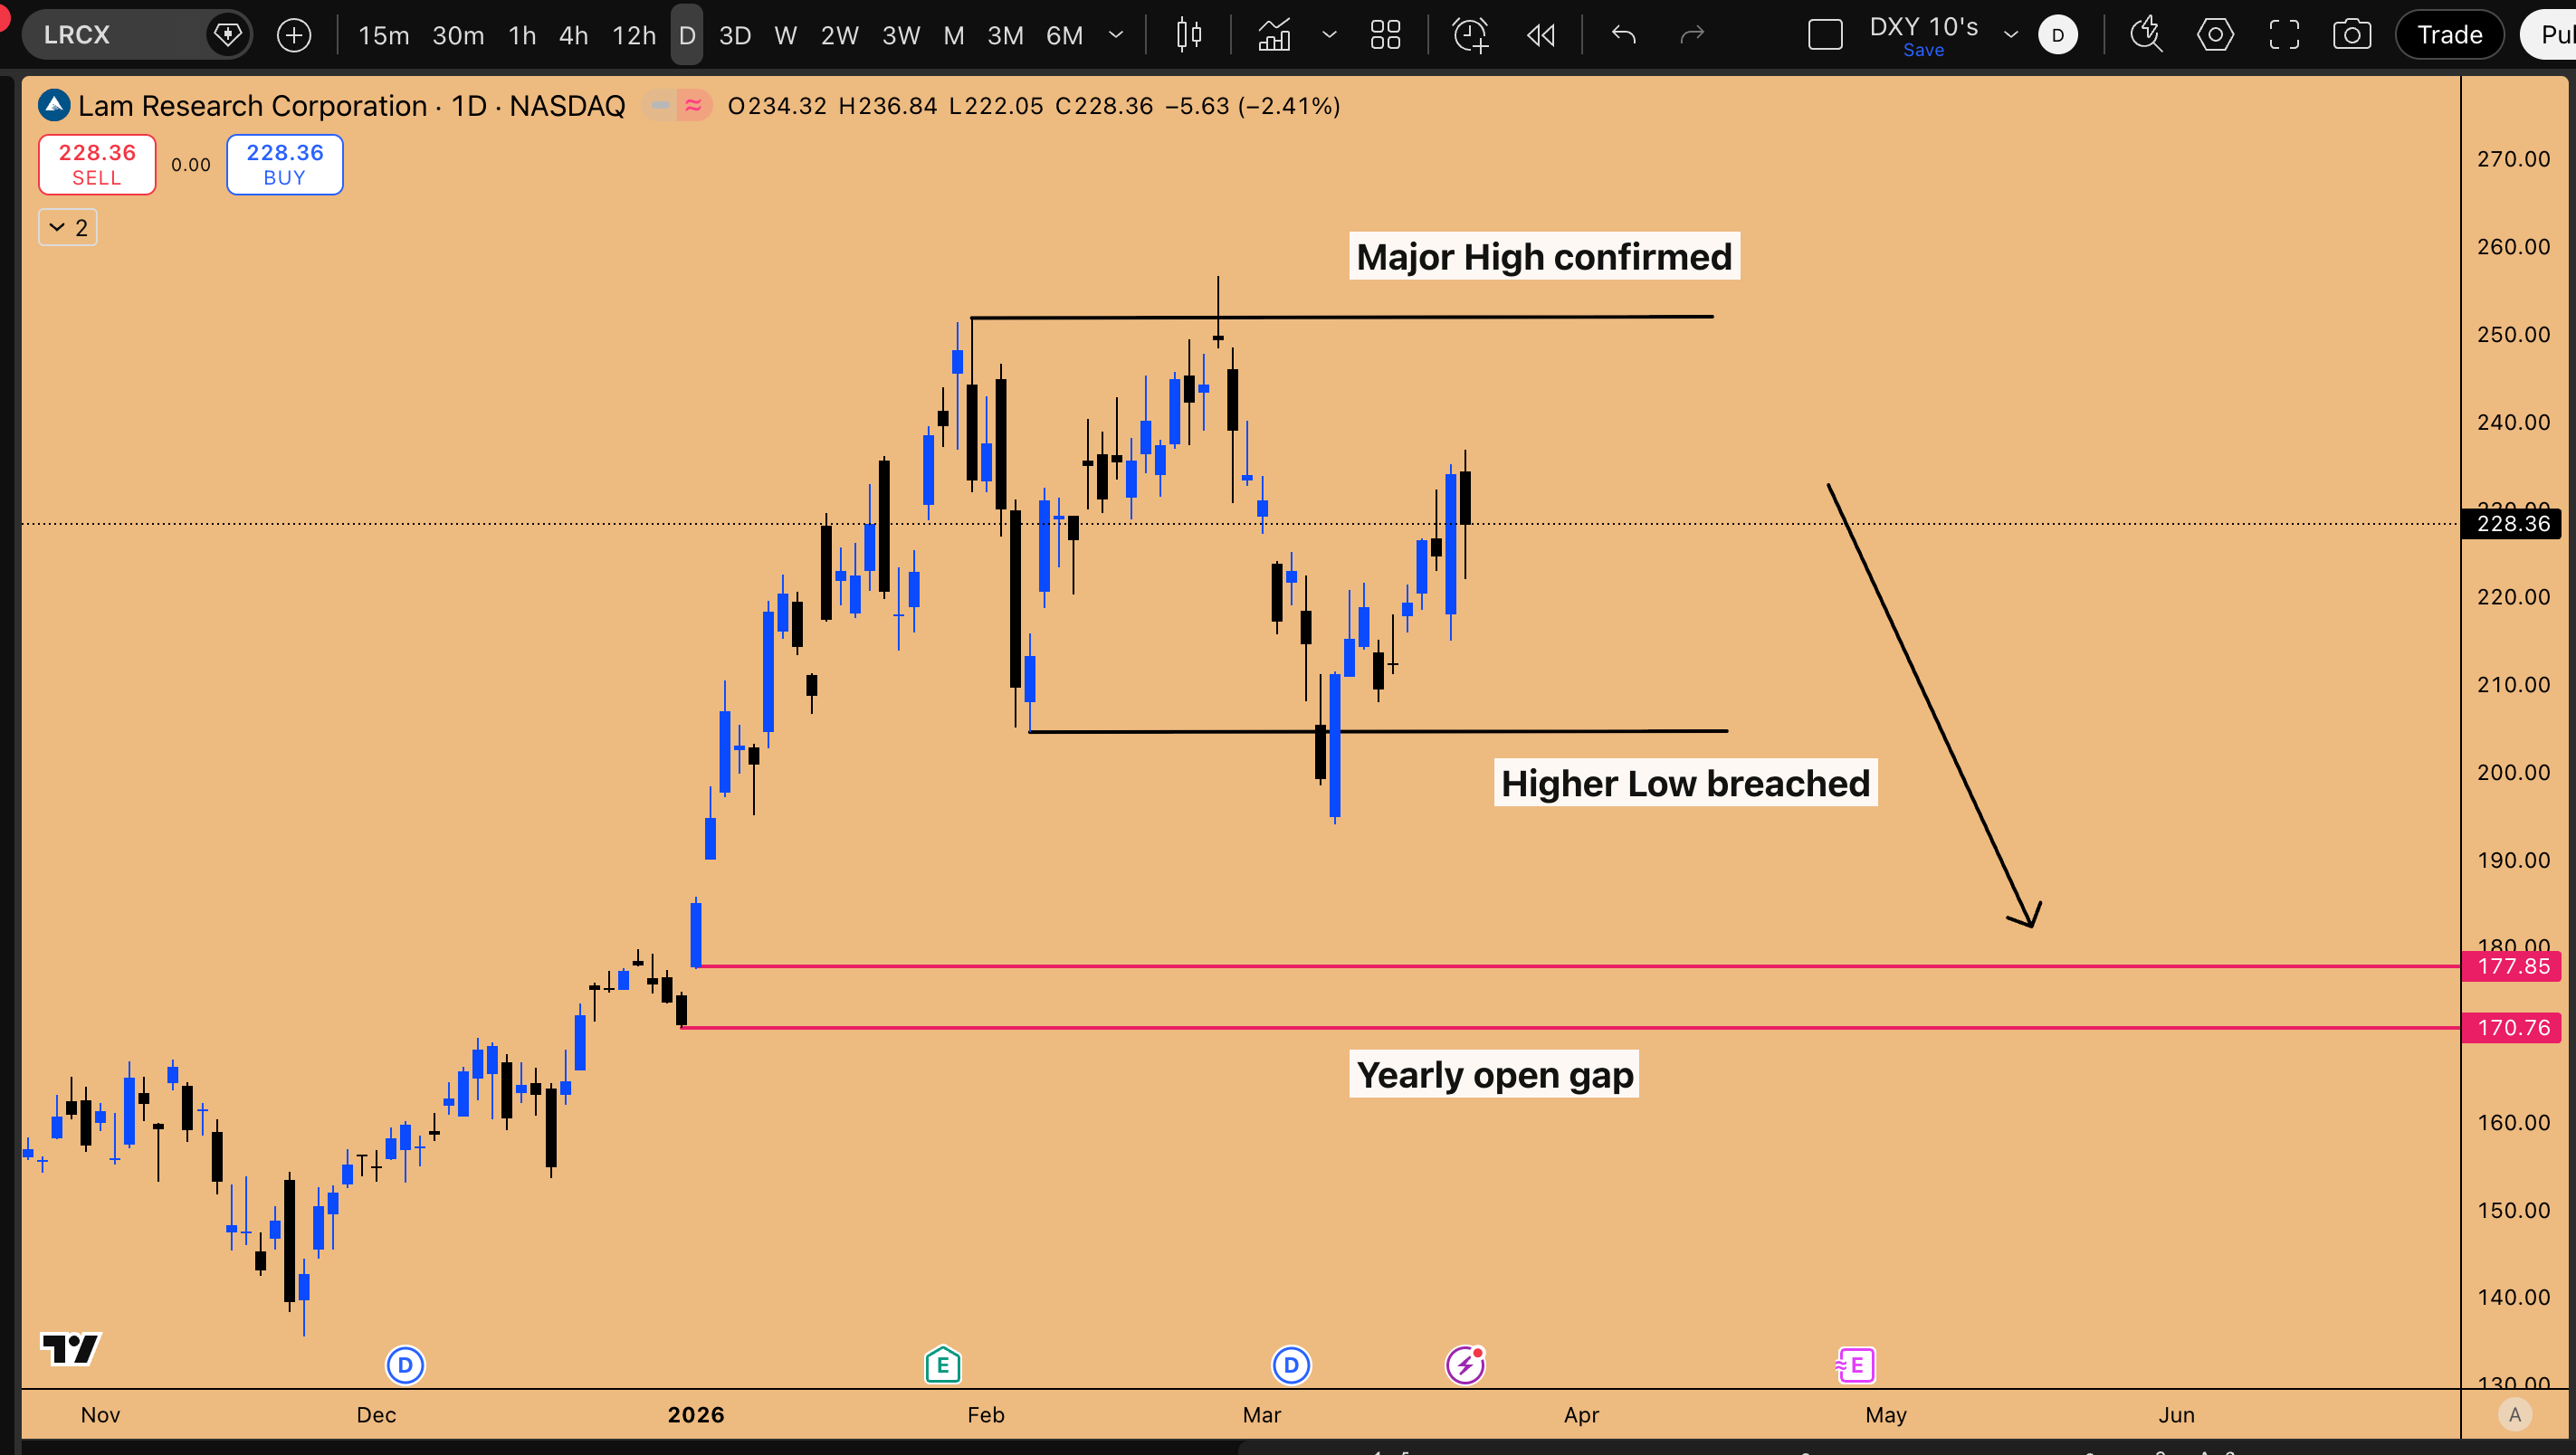
Figure 3: LRCX Pathway moving forward
I have seen this price action frequently during peak euphoria, any dip is immediately bought back up. Once the dip is bought but there is no follow through, the market rolls over. Open liquidity pools where stop losses have accumulated then get triggered, leading to a waterfall moment.
This pattern is a direct echo of Bitcoin between December 2017 and February 2018. After the high at 20,000, BTC breached its most recent higher low, produced a counter-trend rally, printed a lower high, and then that lower high was shorted to take out the lows. Once BTC started declining after that rally, it did not stop at the previous low. A prolonged bear market followed, dropping approximately 70% before the market even acknowledged it was in a bear phase.
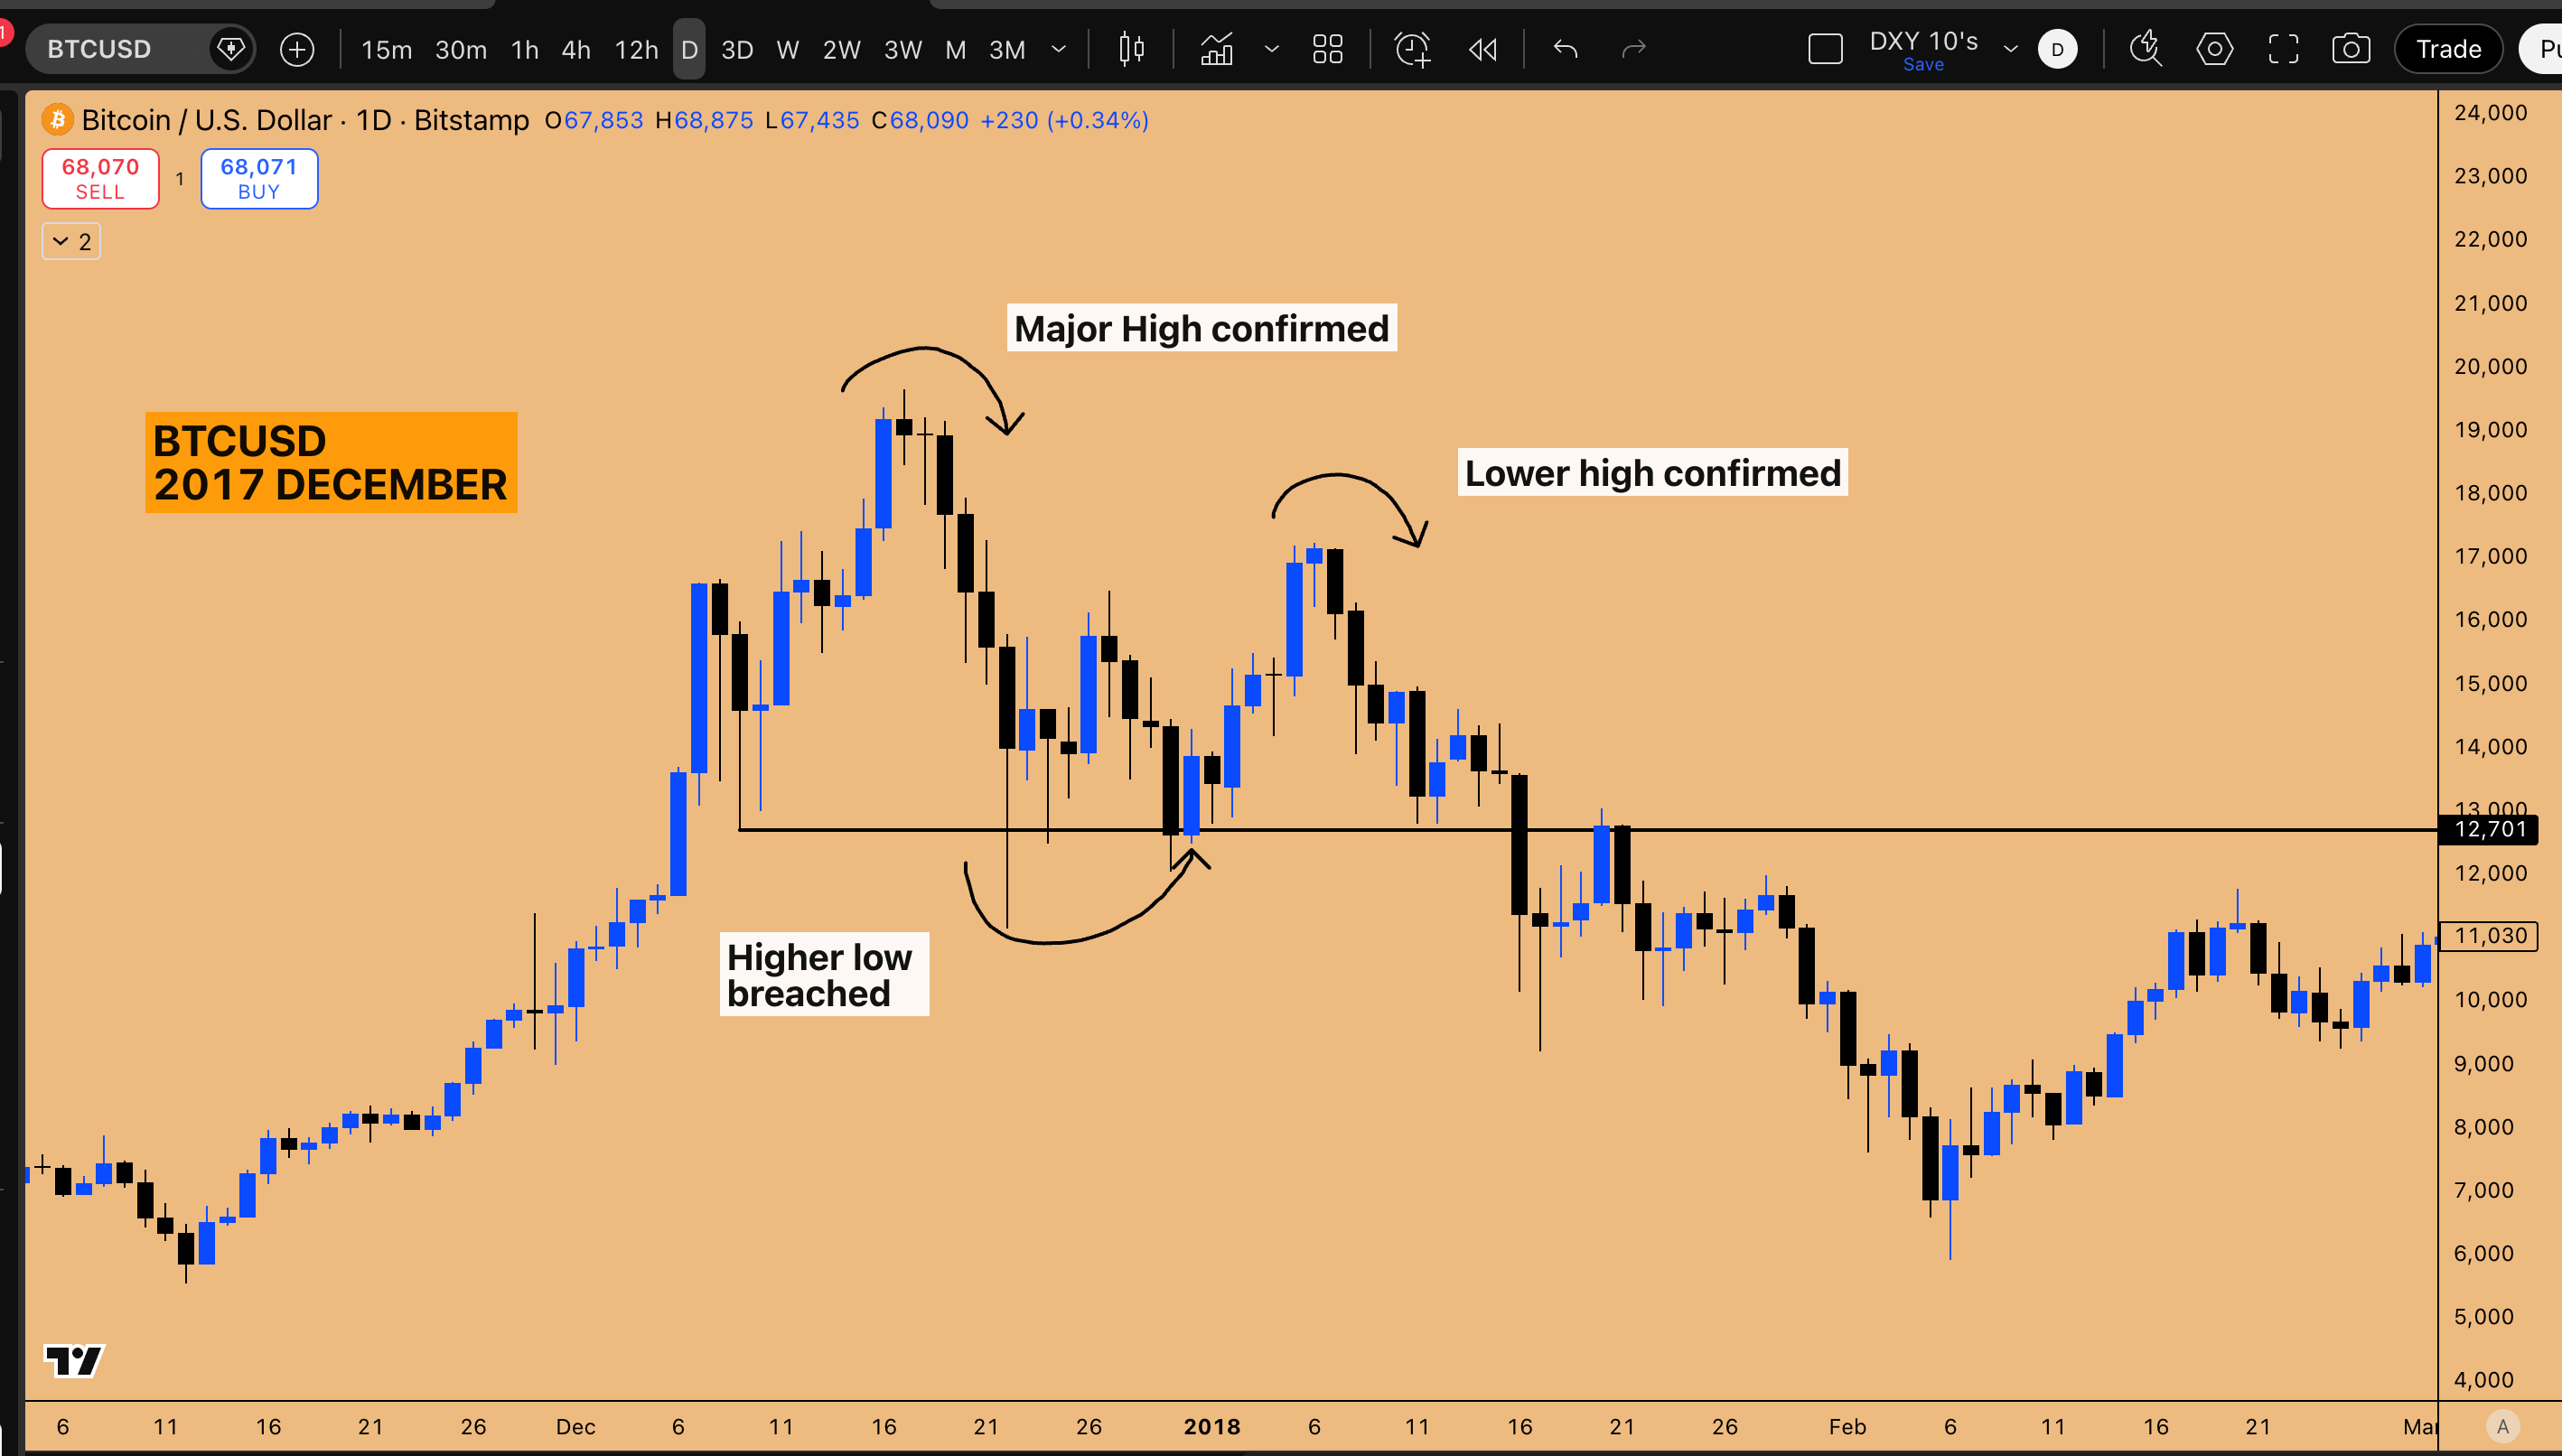
Figure 4: Market structure shift mechanism depicted in BTCUSD on December 2017
Micron’s Earnings Trap
Micron (MU) reinforces this thesis with a textbook sell-the-news event. A double inside weekly candle pattern saw MU take out downside liquidity, then sweep the upside and monthly highs. Despite reporting strong profit margins and positive forward guidance, the stock declined investors had already priced in the positive news. The gap down below the inside weekly and monthly candle highs constitutes a false breakout that may confirm as a failure within the next nine days.
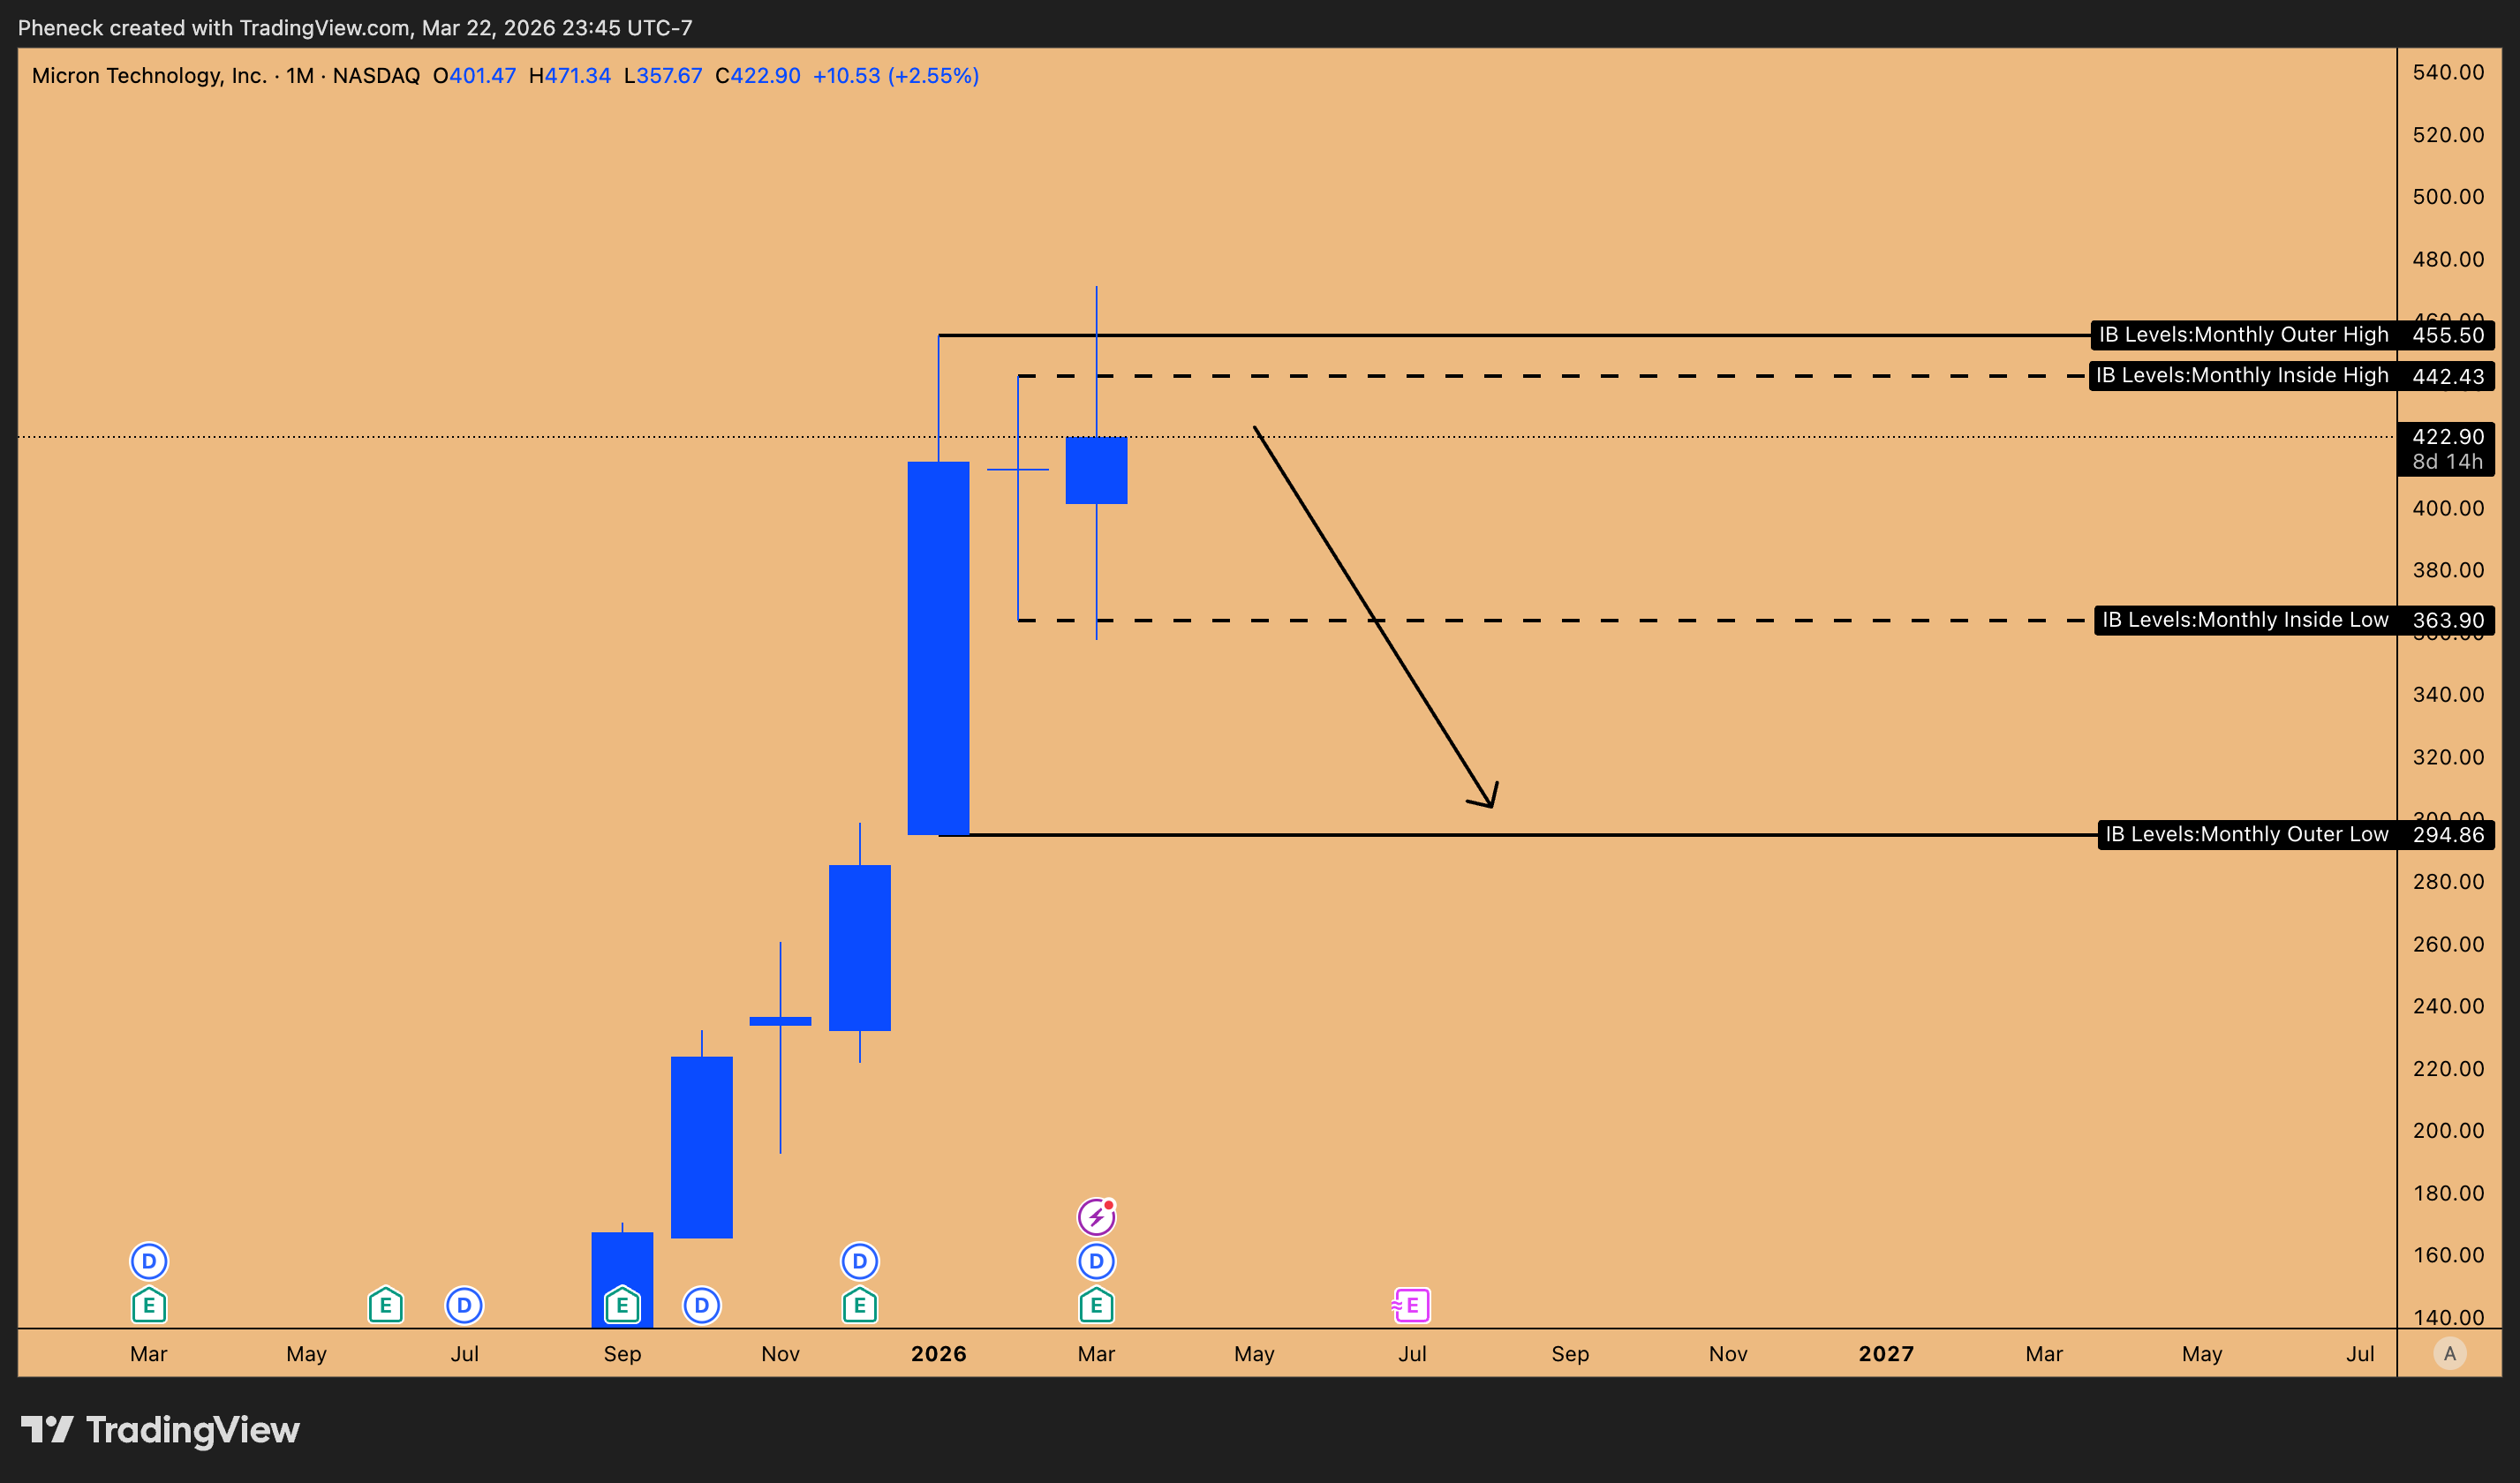
Figure 5: Inside Monthly Candle Failure pattern in play for MU
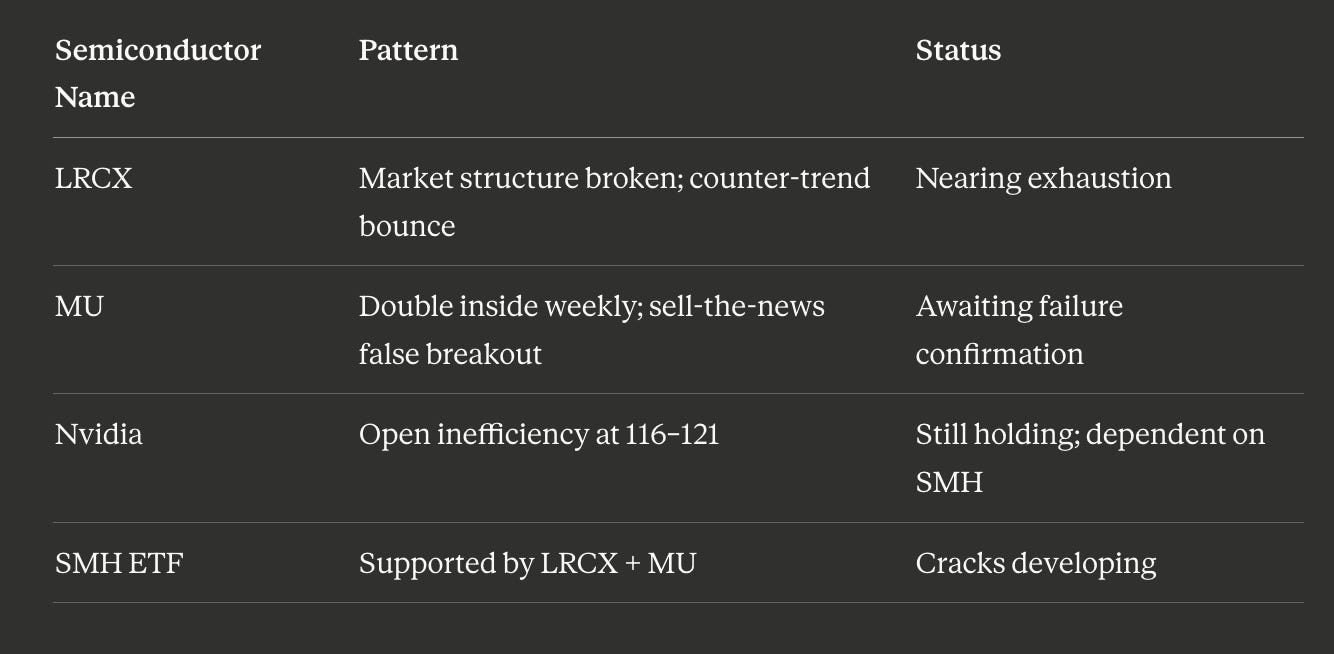
When LRCX and MU confirm their tops and begin declining, they will drag the SMH lower, which directly impacts Nvidia. Nvidia’s open inefficiency sits between 116 and 121, coinciding with the NASDAQ’s gap at 20,061 to 20,813. The dominoes are lined up. The current situation is reminiscent of watching a structure’s last pillars being tested individually they still hold, but the load-bearing capacity has already been compromised.
Other sectors have already shown what awaits. The banking ETF (XLF) has been following the general index trajectory and is approaching its support zone. While XLF was trending upward alongside the NASDAQ, there was a critical divergence: XLF made an all-time high in November 2025, while the NASDAQ did not. Since then, XLF has been declining and filling its inefficiencies a process the NASDAQ hasn’t even started because it is waiting for its last supporting names to fall. The XLF serves as a leading indicator of what happens when sector leadership exhausts itself and inefficiencies demand to be filled.
Mapping the Bear Market Floor: The 30% Drawdown Rule
During a vertical run-up, a bear market is often around the corner. Once the structure shifts, one or two candles can fill open gaps that accumulated during the rally. During the current cycle, the cash index chart reveals inefficiencies between 566 and 5,735 on the S&P 500, with additional gaps scattered at lower levels.
A critical framework for navigating these crashes: historically, a 30% drawdown has served as a consistent maximum for the NASDAQ over the past nine years. Even during the 2022 bear market, the index did not sustain levels below the 37% mark before reversing. Given the quarterly structural shift now in motion, the target is the open gap between 20,000 and 20,613 squarely within that historical drawdown threshold.
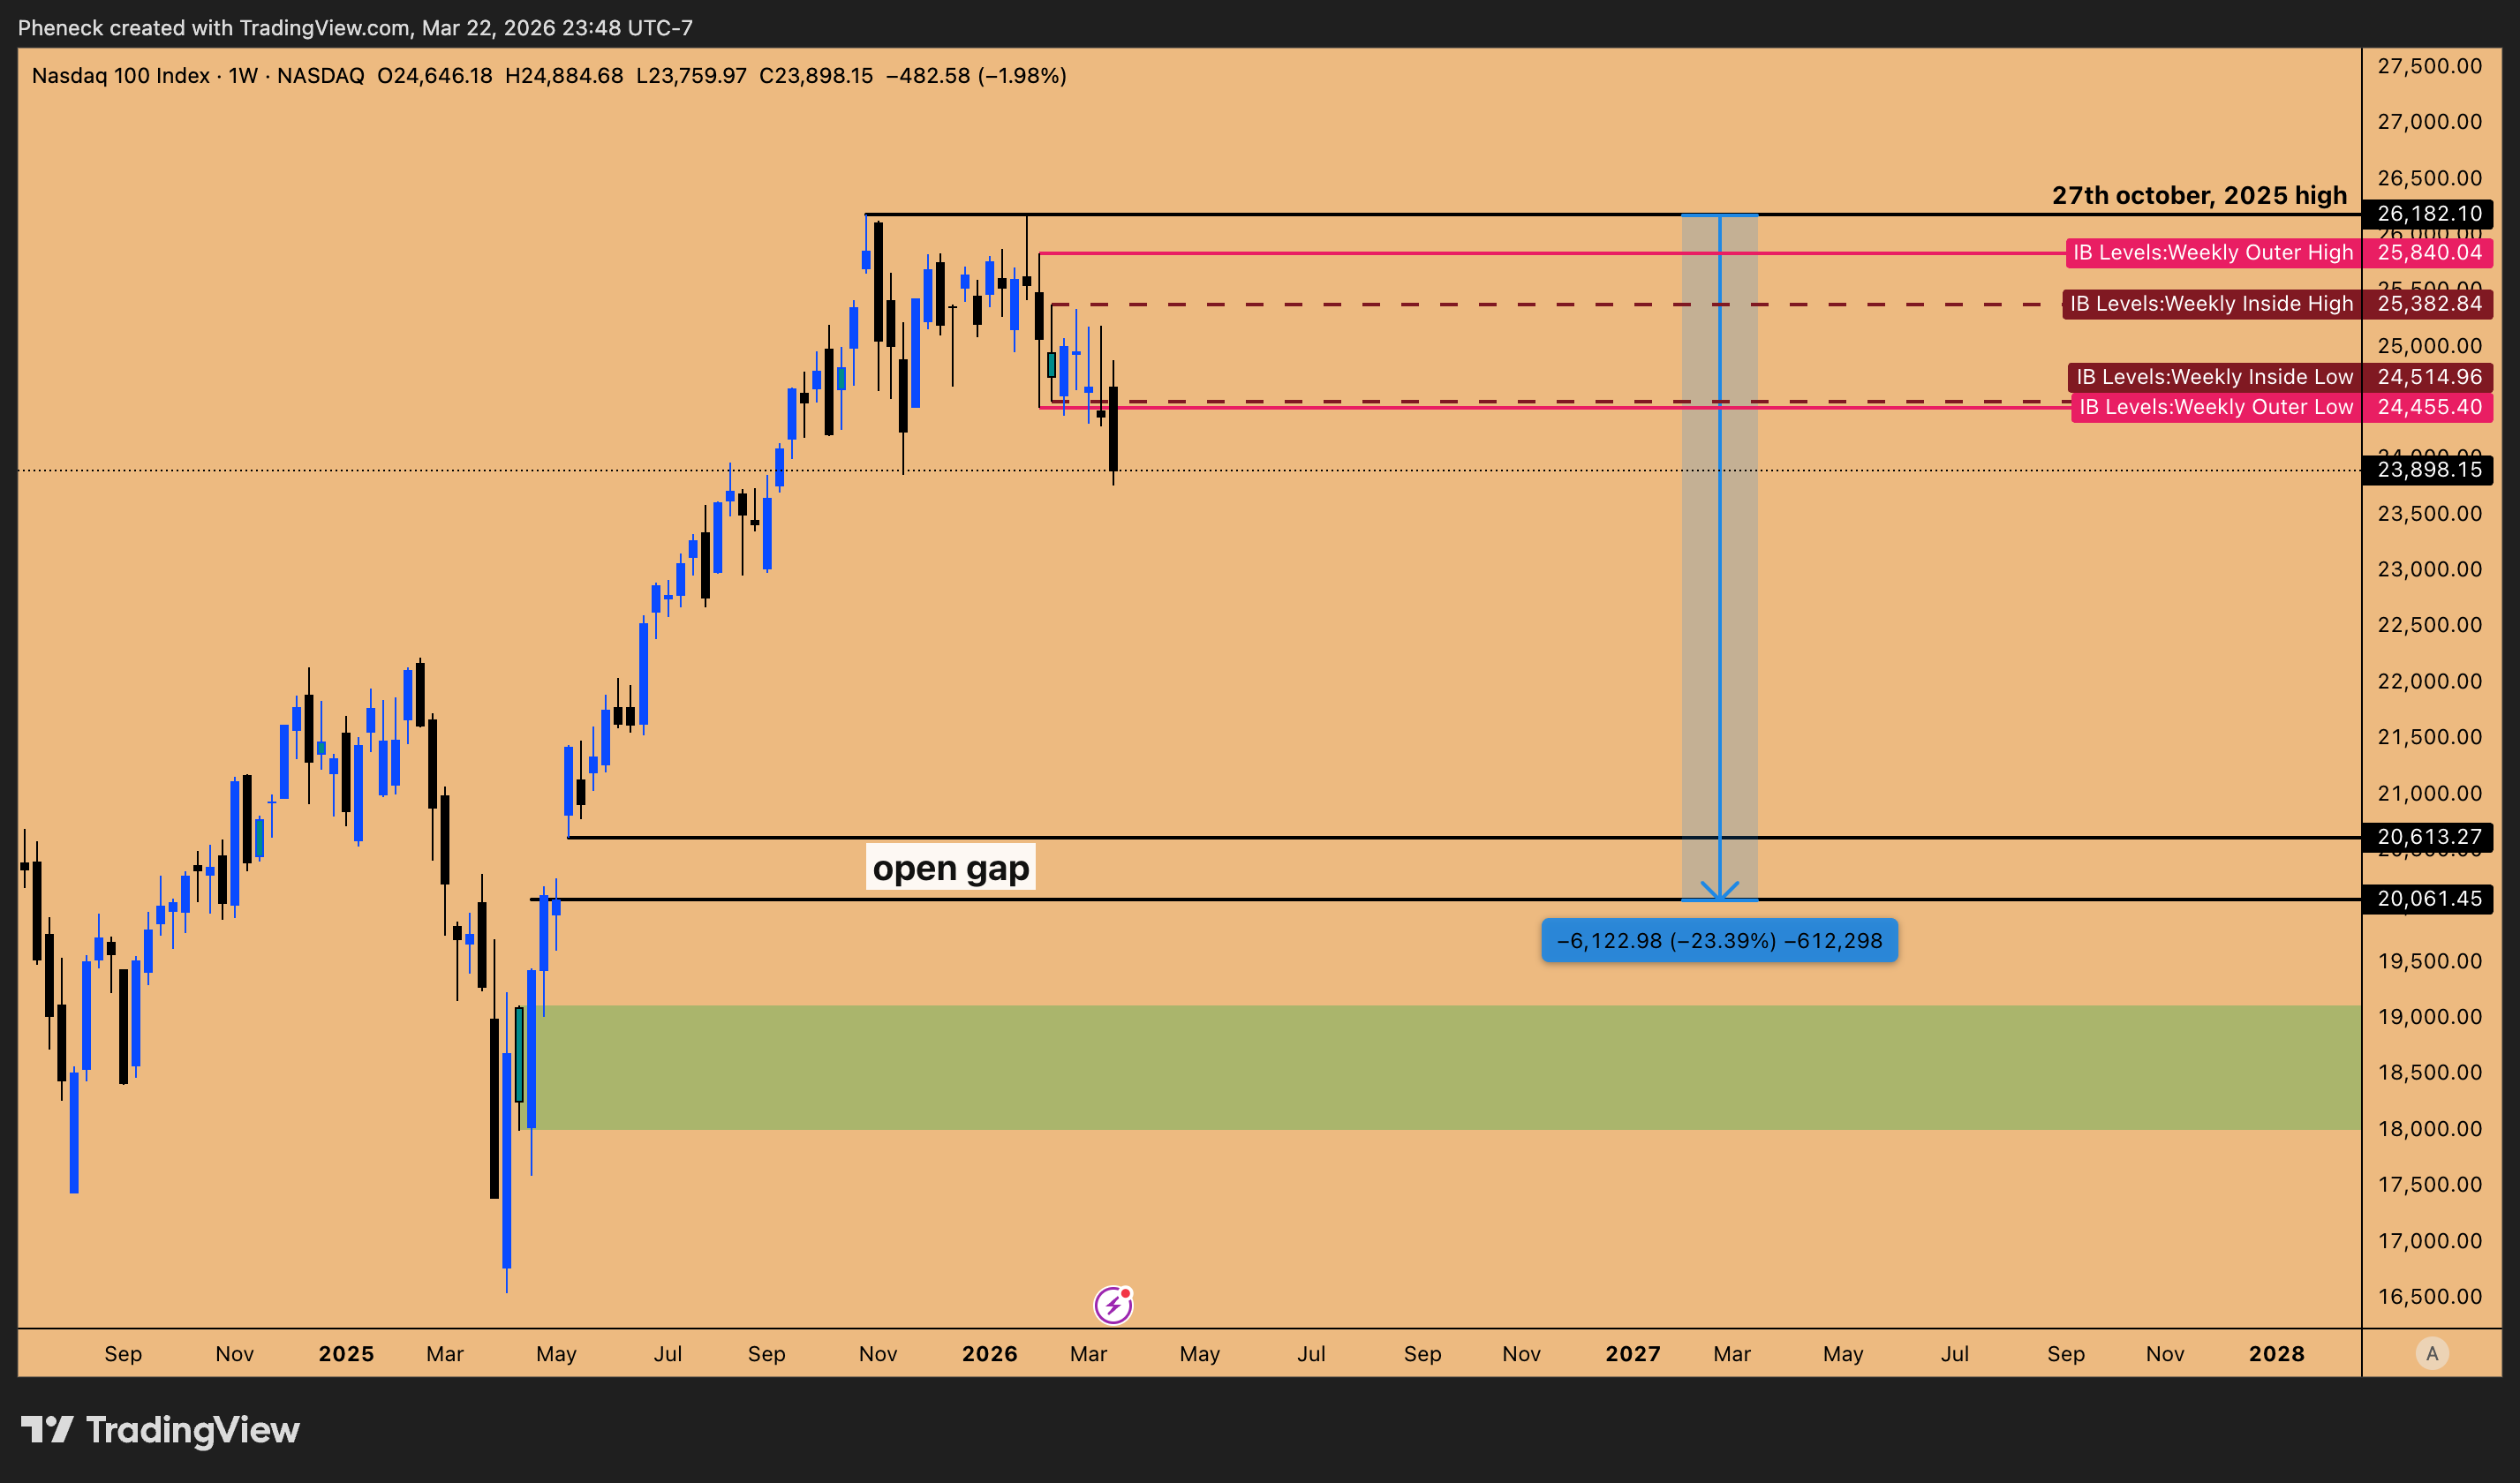
Figure 6: Peak to gap open drawdown threshold sits at ~ -23%
Forex: The Dollar Is Coiling, and Every Setup Points the Same Direction
US 10-Year Yields Are the Master Key
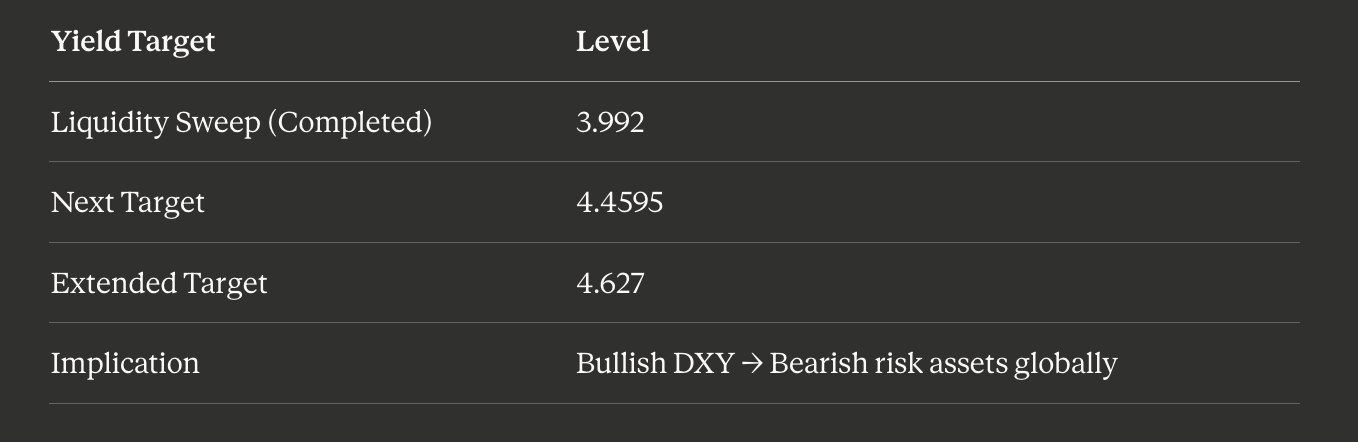
The global macro puzzle has a single master variable: US 10-year yields. Yields are spiking, which is driving the dollar index higher, which is compressing global risk assets. On the quarterly timeframe, the yield pattern is unambiguously bullish. After taking out downside liquidity at 3.992, the trajectory points toward 4.4595 and 4.627.
This yield trajectory confirms the bullish dollar thesis and creates a cascading effect across every dollar-paired currency and every equity index globally. There is a direct inverse relationship between the S&P 500 and the DXY when the dollar rises, the index falls. Importantly, capital is leaving the index entirely rather than rotating between sectors. This is not sector rotation. This is a cash flood. Over the past few weeks, this trend has become unmistakable money is not moving from tech into value or from growth into defensives. It is exiting equities altogether and piling into cash, which is why the dollar index continues to strengthen even as every other asset class deteriorates.
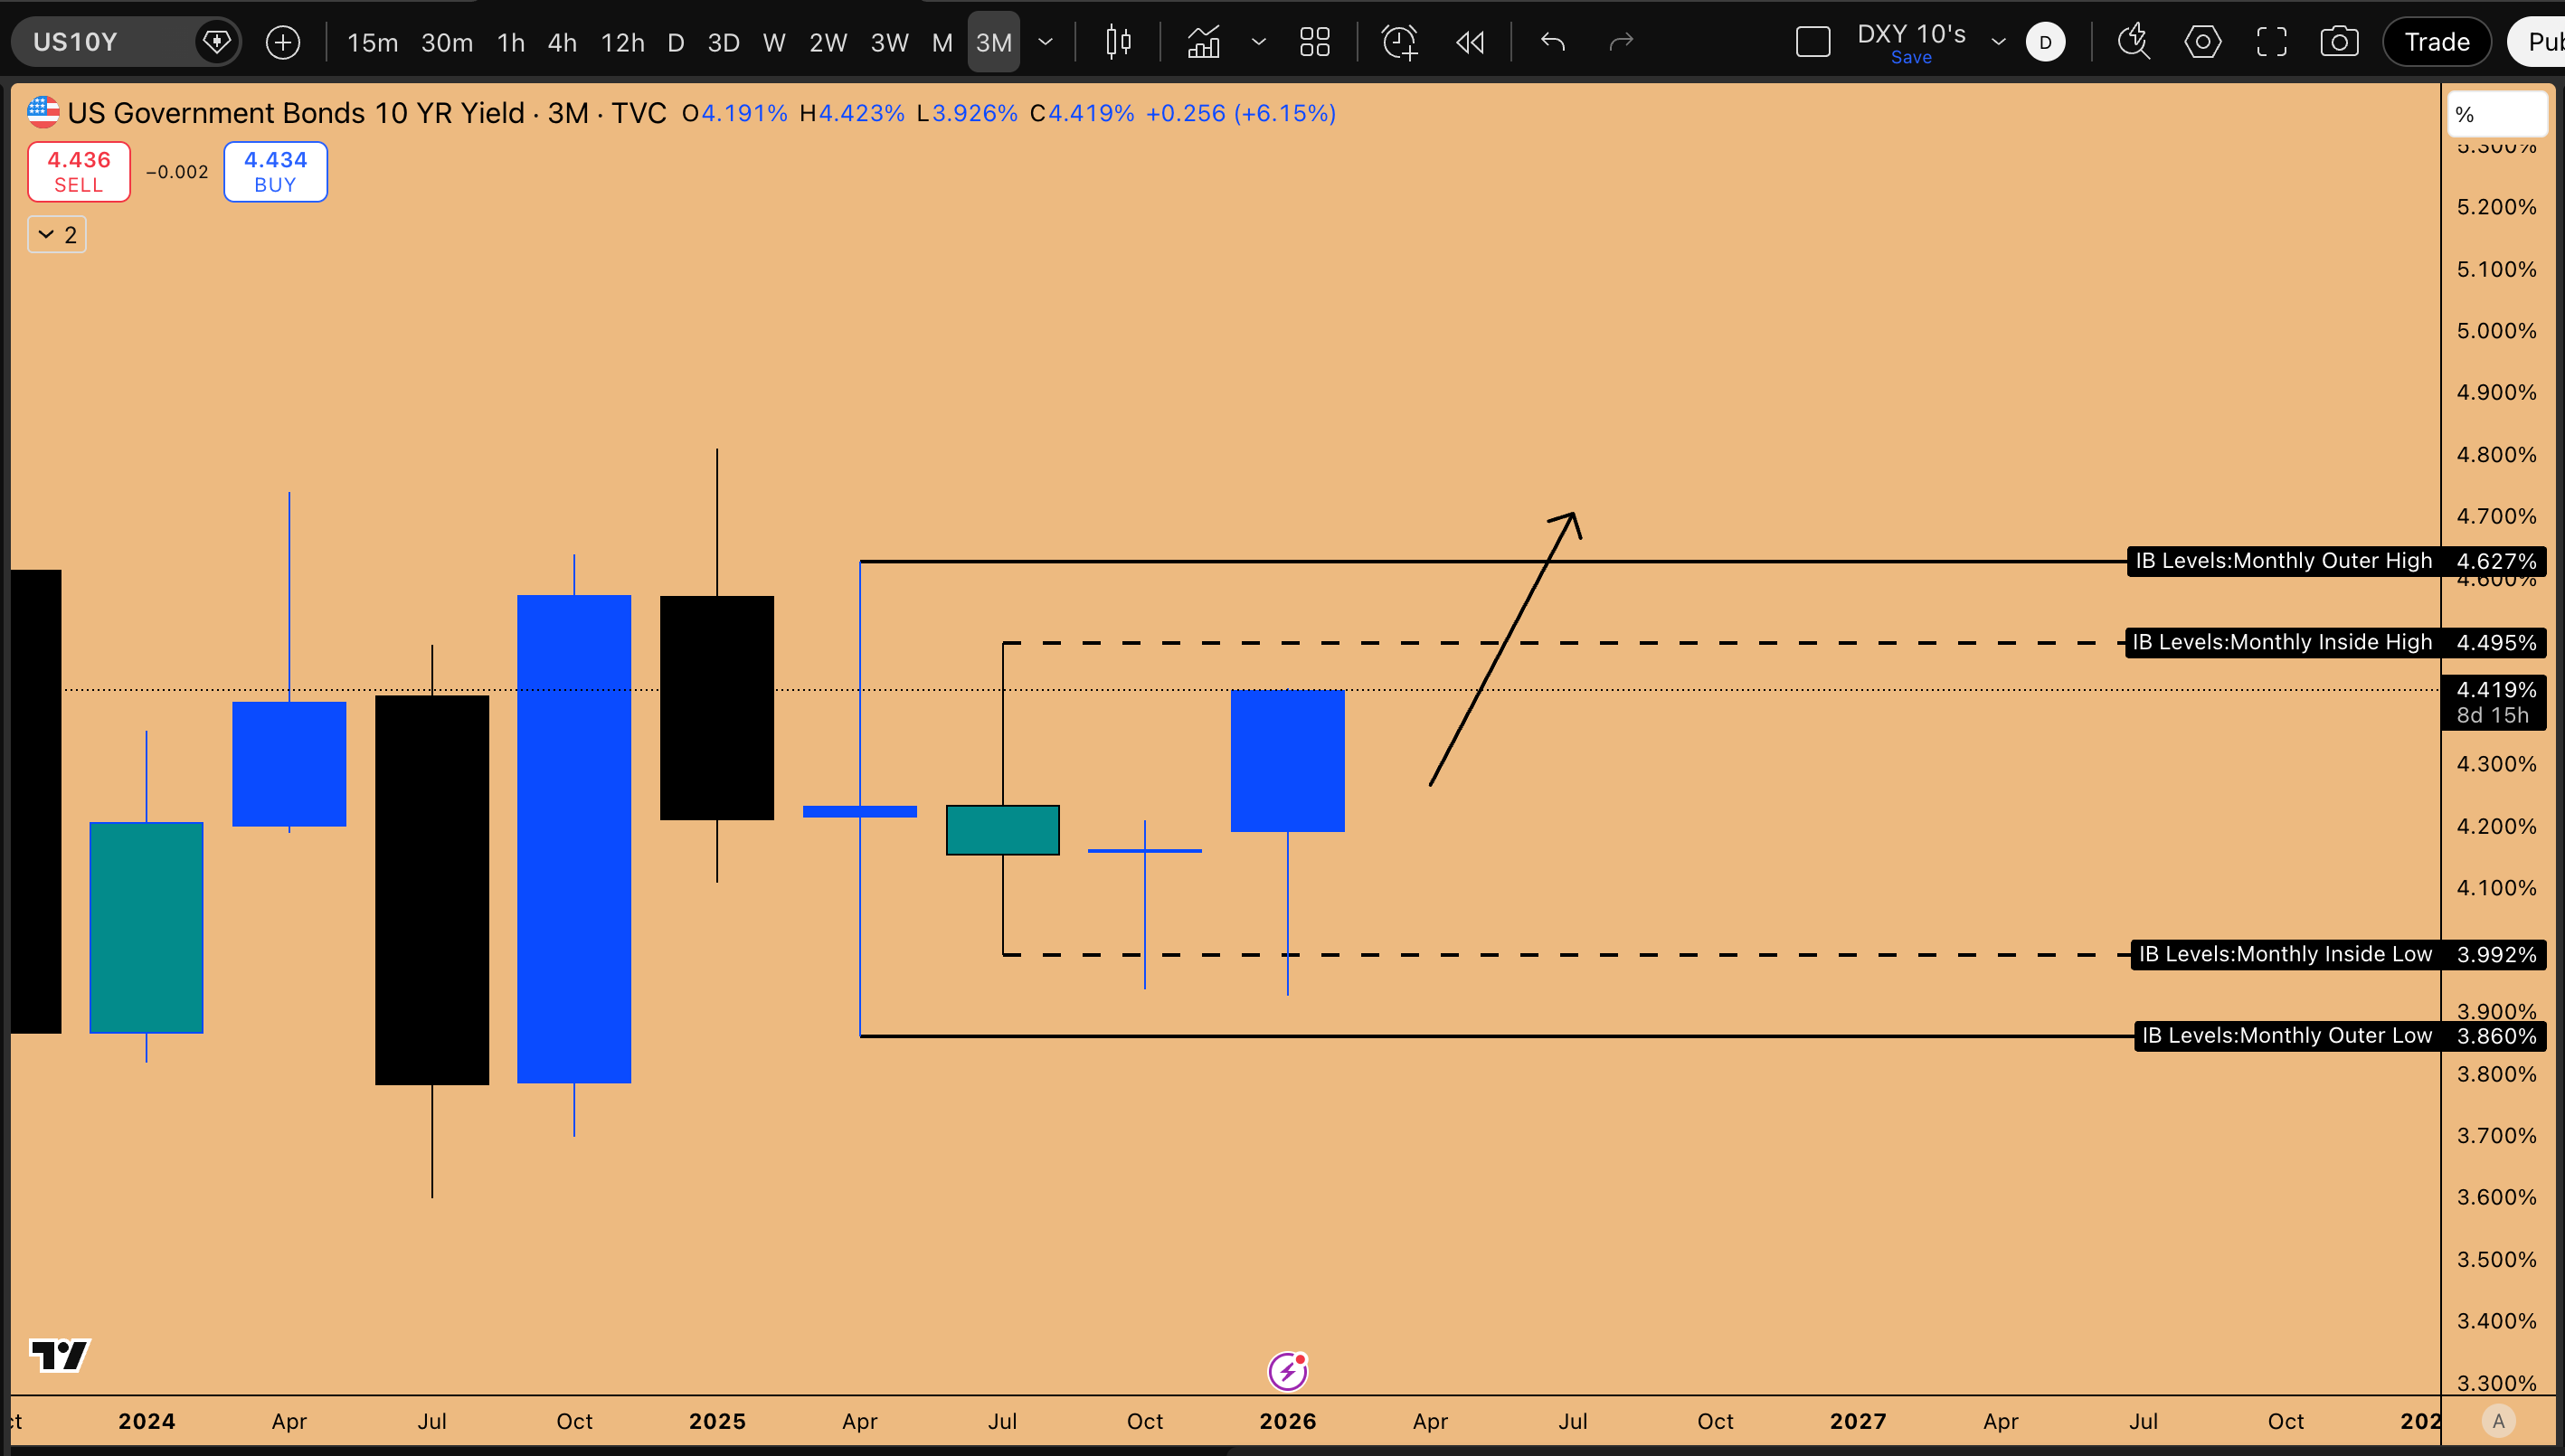
Figure 7: Inside 3-Month Candle Failure pattern in play for US10Y yield, favouring upside
The DXY itself has an inside daily candle pattern in play this week. The ideal scenario would see a brief spike lower in the dollar potentially triggered by a de-escalation in geopolitical tensions sweeping the liquidity pool at 98.975 before reversing higher. That liquidity sweep would serve as the entry point for dollar longs and, by extension, the trigger for shorts on dollar-paired currencies. If the dollar index remains flat this week while USD JPY rises independently, it would signal that the dollar is simply waiting for the quarterly candle close before unleashing the next leg higher. In that scenario, short opportunities on Euro, AUD, and GBP would emerge the following week with even greater clarity.
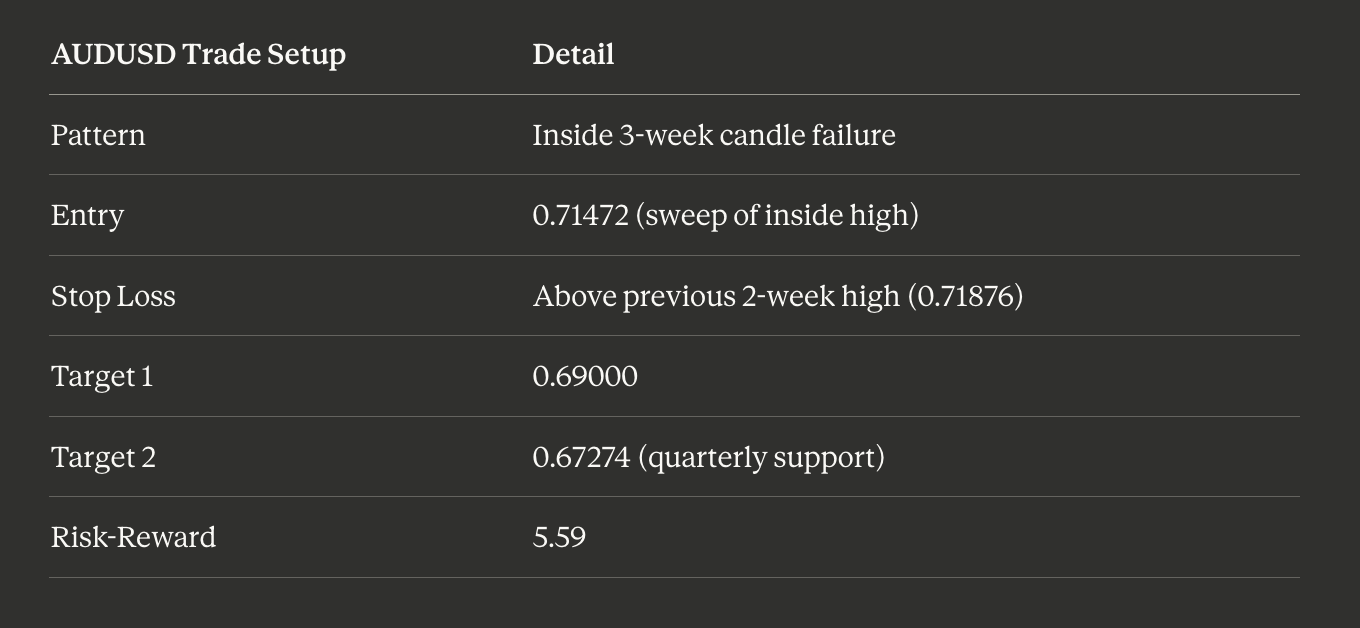
AUDUSD: A 5.59 Risk-Reward Swing Short
AUDUSD presents the highest-conviction forex setup of the week. An inside three-week candle pattern is poised to confirm as a failure within the next five days, with the inside two-week failure already confirmed. Gold and silver have already declined significantly, and since AUD has been historically propped up by precious metals strength, the reversal in gold removes that support pillar.
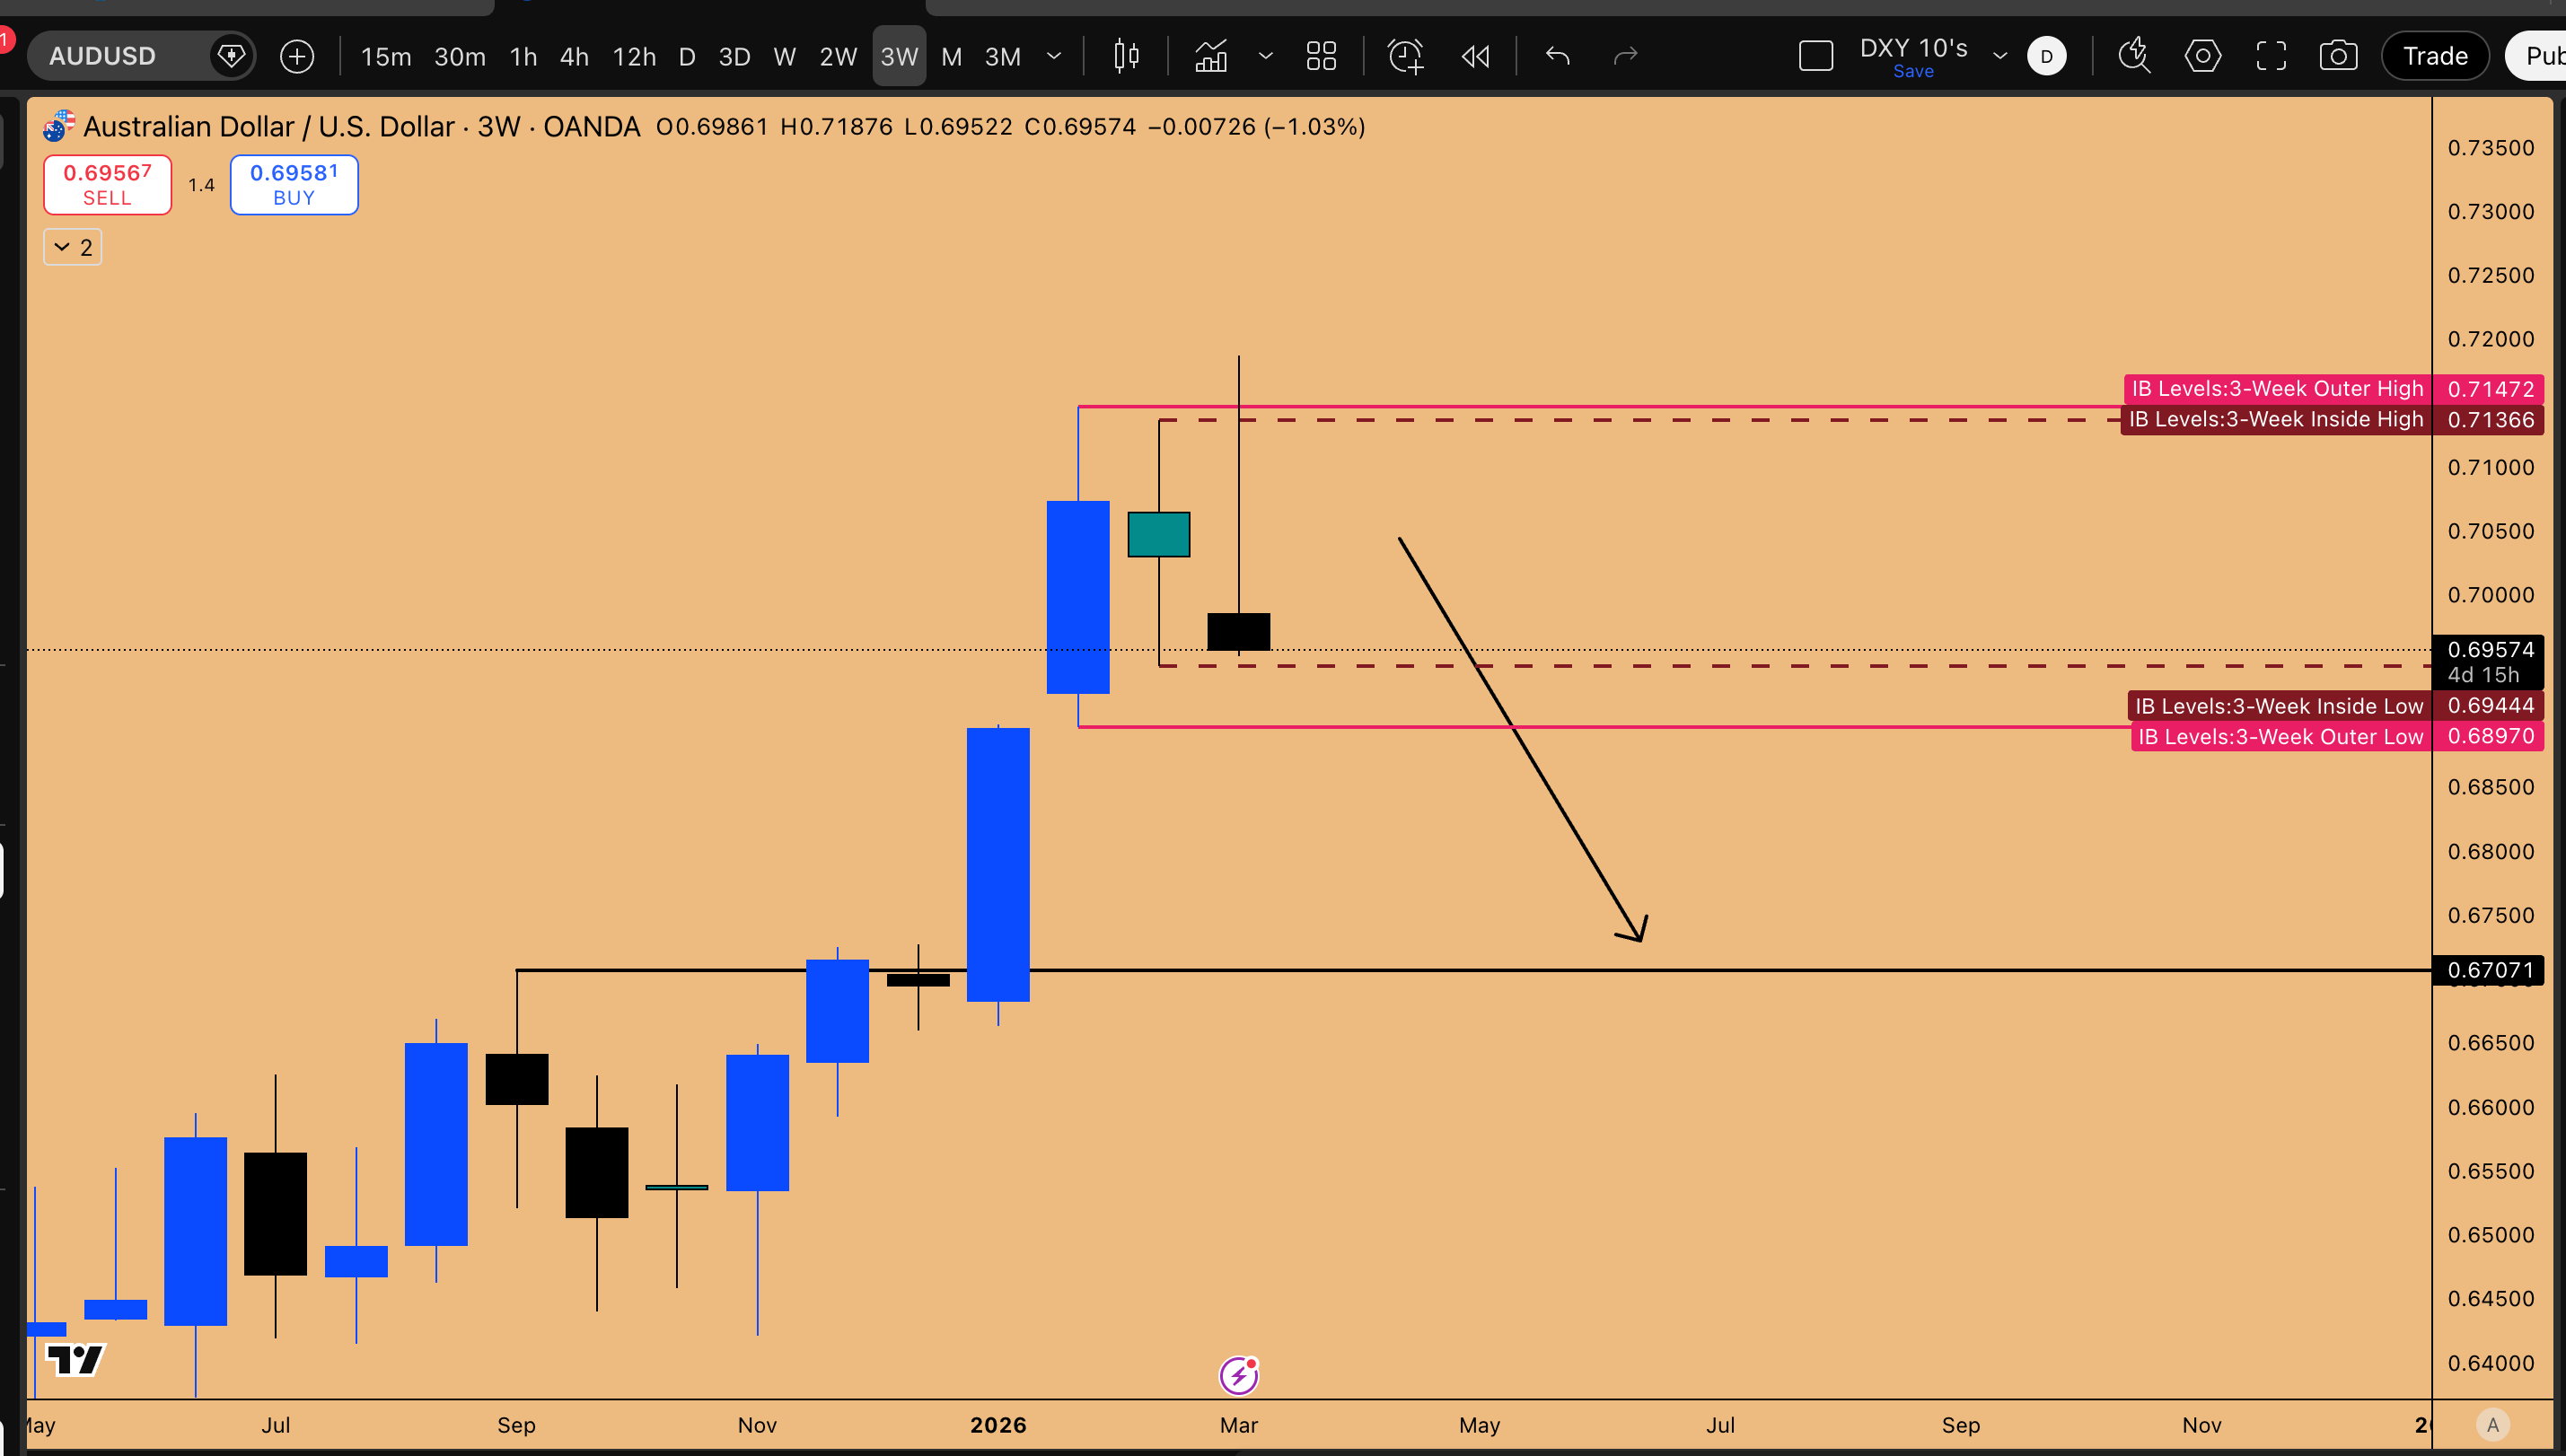
Figure 8: Inside 3-week Candle Failure is underway, targeting further downside in AUDUSD
AUDUSD has been propped up by gold. Now that gold has topped, AUDUSD should follow suit as the dollar strengthens.
GBPUSD: Order Block Precision at 2.9 R:R
GBPUSD mirrors the DXY’s inside candle pattern with an inside two-week level where a daily bearish order block has formed. Liquidity is perfectly stacked between the inside weekly high and the inside two-week low, with inside daily and weekly candles in play simultaneously. The extended target sits at 1.30166, which would sync the pair with the dollar’s previous structural movements.
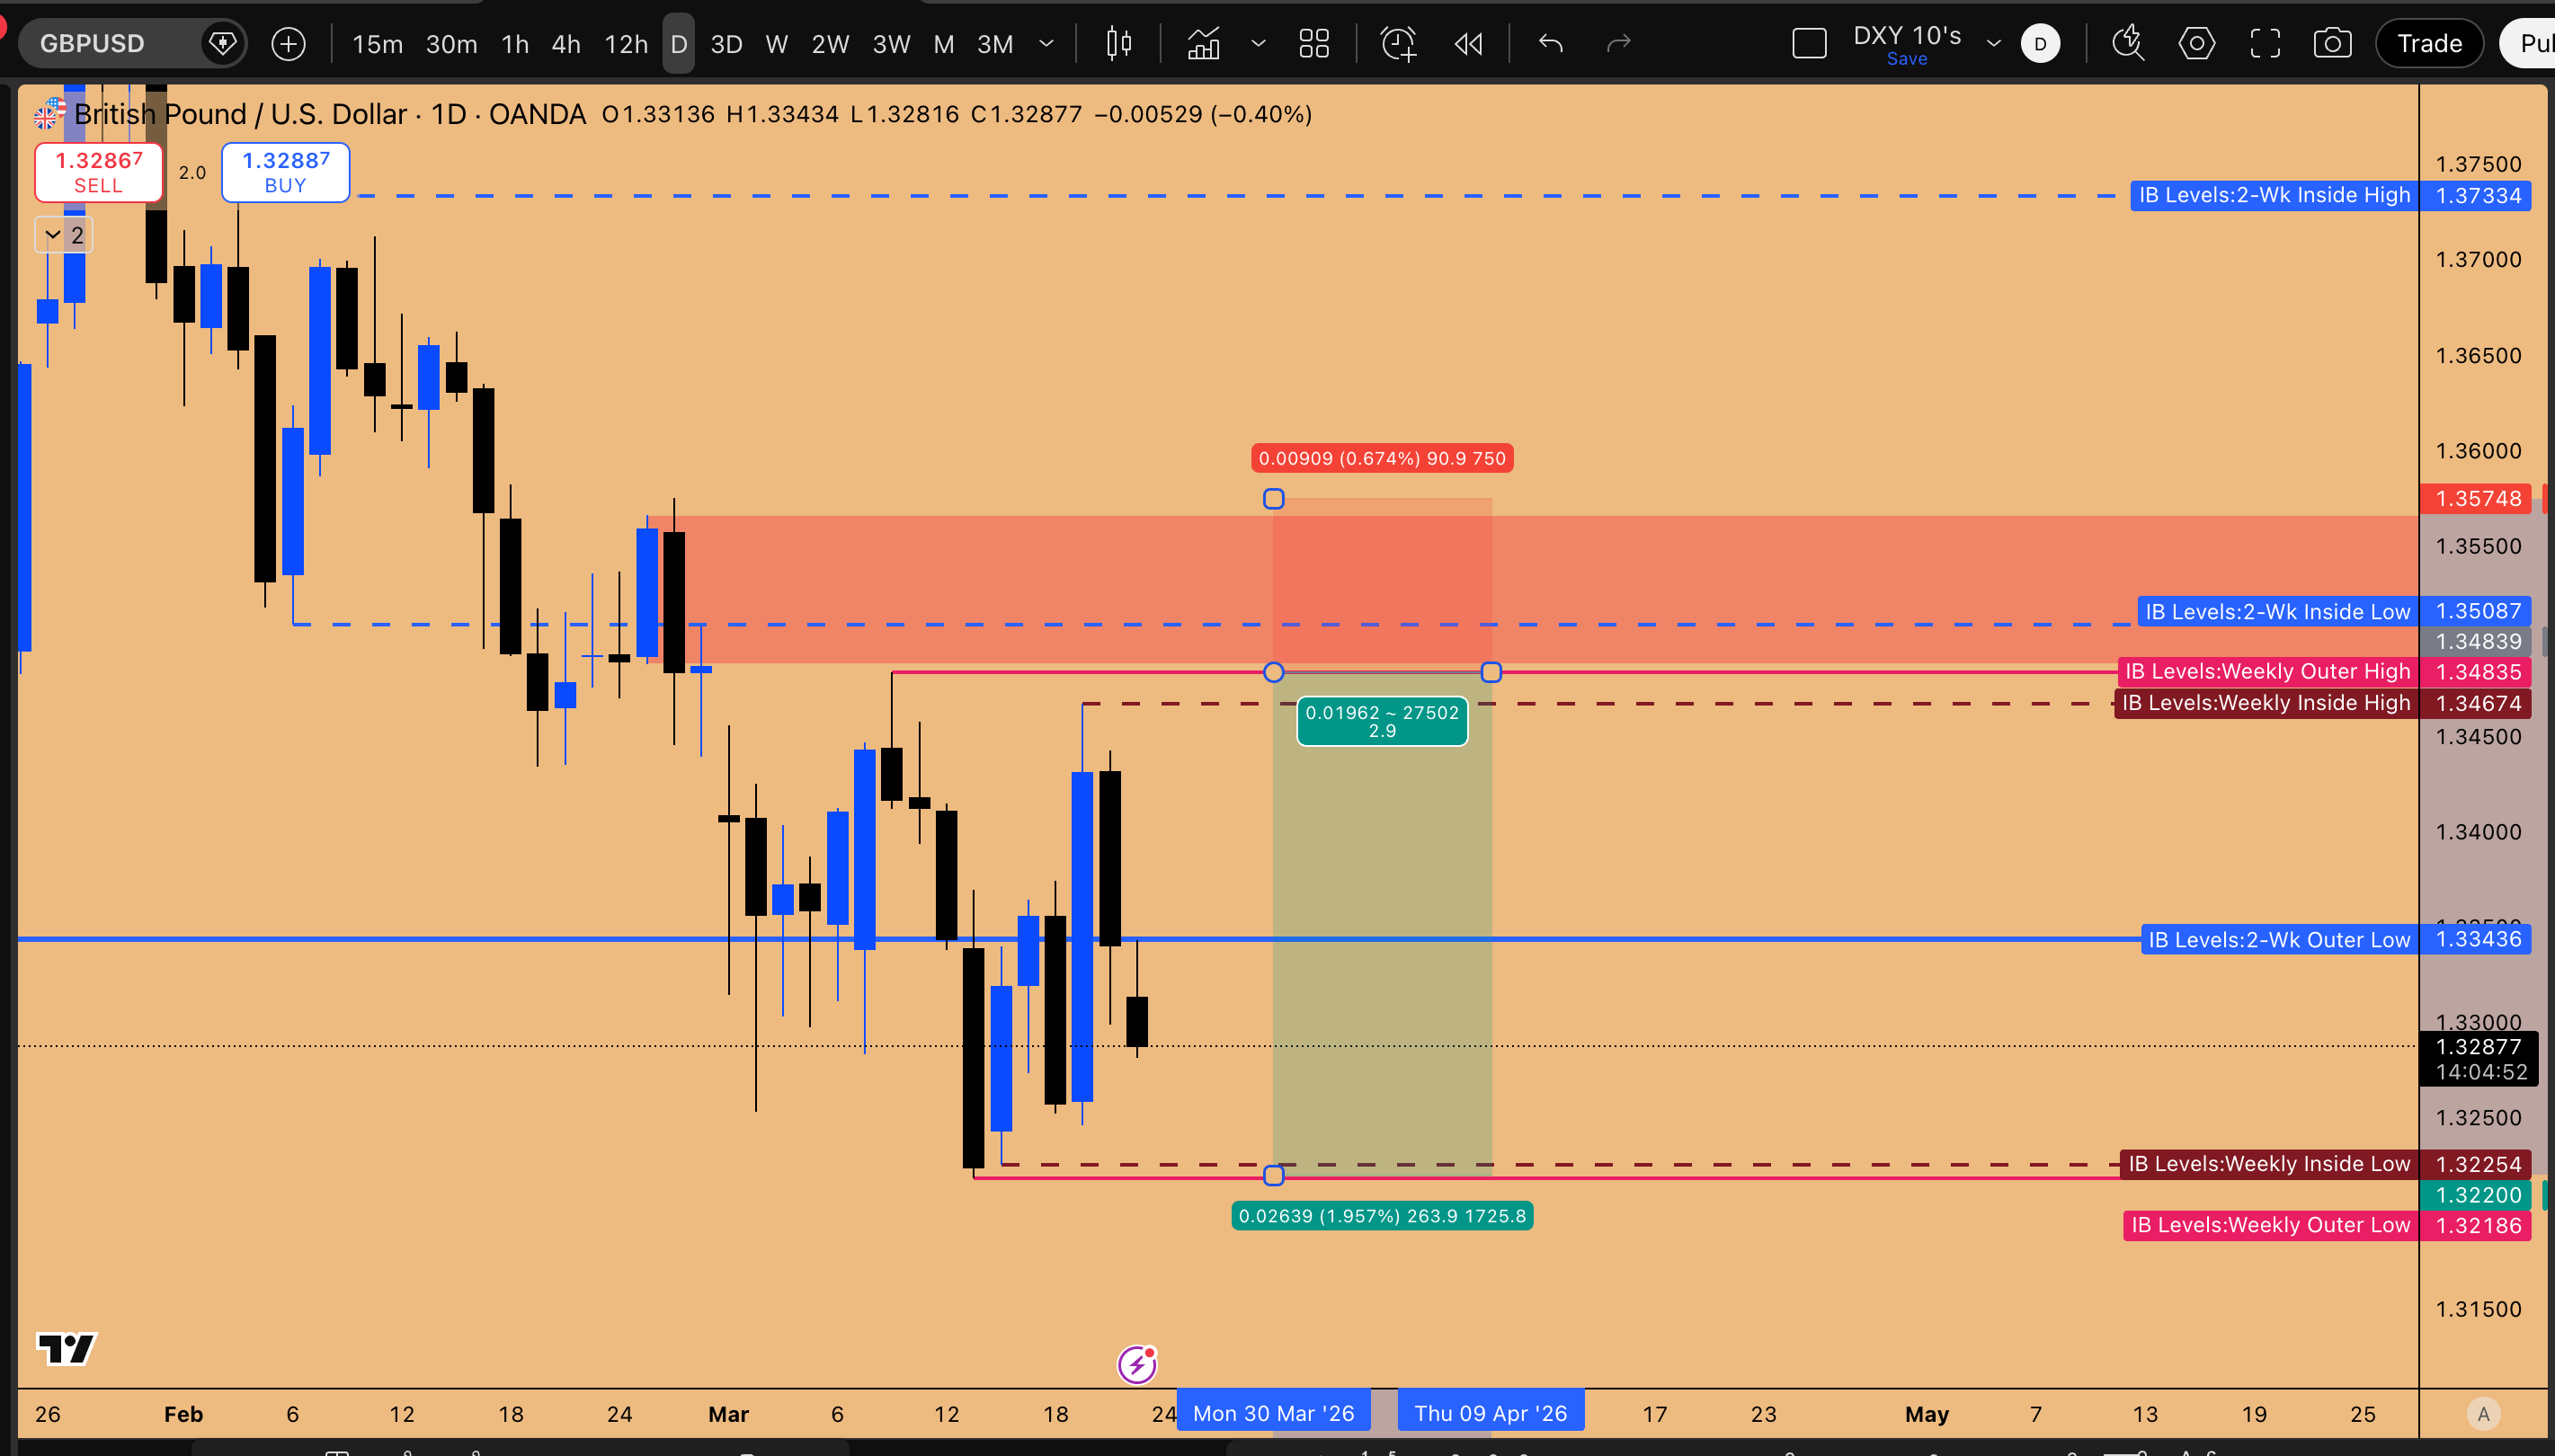
Figure 9: GBPUSD short setup in play
Notably, USD JPY and the DXY bottomed together in February 2026, reinforcing the correlation between dollar strength and yen weakness. If the dollar index is printing a bullish inside candle pattern, USD JPY should be positioned long, with a potential breakout toward 159.90 where there is minimal resistance between 159 and 161. The forex complex is offering a unified directional thesis this week: the dollar is going higher.
Bitcoin’s Paradox: Already Broken, Potentially Already Bottoming
The 52% Drawdown and Range-Bound Thesis
Bitcoin has experienced a 52% drawdown from its highs—while the NASDAQ has only corrected approximately 10%. As a beta asset to the NASDAQ’s alpha, BTC moves with amplified volatility in both directions: if the NASDAQ drops 20%, BTC can drop 60%; if the NASDAQ rises 30%, BTC can surge 120%.
This asymmetric relationship suggests that BTC may have already priced in much of the correction that the NASDAQ has yet to experience. An open inefficiency has been resolved, and the previous quarter’s low has been tested. A spot long position representing 50% of portfolio allocation has been initiated at that level, with the remaining capital earmarked for deployment at 49,000.
BTC has already seen a 52% drawdown, while the NASDAQ is only down 10%. It is more likely to be a range-bound event. Even if it takes out liquidity at 60,000, it will likely snap back to 74,000 and range for several months.
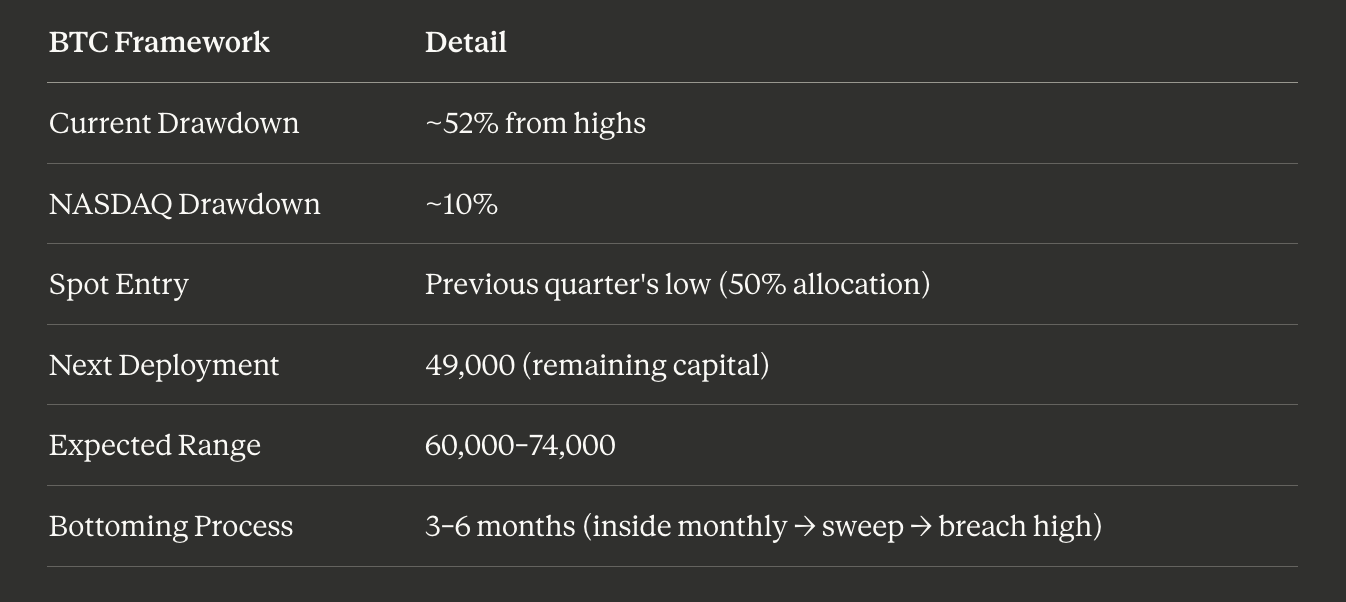
The bottoming process for BTC follows a specific algorithmic sequence: an inside monthly candle forms, downside liquidity is swept, and then that candle’s high is breached. This macro signal on the monthly timeframe is the confirmation required before full capital deployment. Patience is not optional—it is the strategy.
The Volmageddon Thesis: Why the Biggest Opportunity Requires the Deepest Pain
Credit Stress Is Building And It Needs a Crisis
Everything discussed in this analysis: The quarterly bearish signals, the semiconductor cracks, the VIX complacency, the dollar coil, the yield surge: converges on a single inevitability: a Volmageddon event where the VIX spikes violently and a genuine market flush occurs.
This is not merely a geopolitical scare or a tweet-driven selloff. The US 10-year yields have been forming this pattern for nine months. Central banks require billions to move yields, and no single political event will alter the trajectory. The DAX has already begun resolving to the downside, with an open inefficiency on its monthly candle no wick that the market will likely fill in the coming cycle. Attempts to long the DAX have been stopped out, and the structure now points to further downside damage before any meaningful recovery. The last time quarterly bearish order blocks formed with this intensity was before either the 2022 bear market or the 2018 repo market crash. Something in the credit cycle is breaking down, and institutional players can sense it through the yield curve.
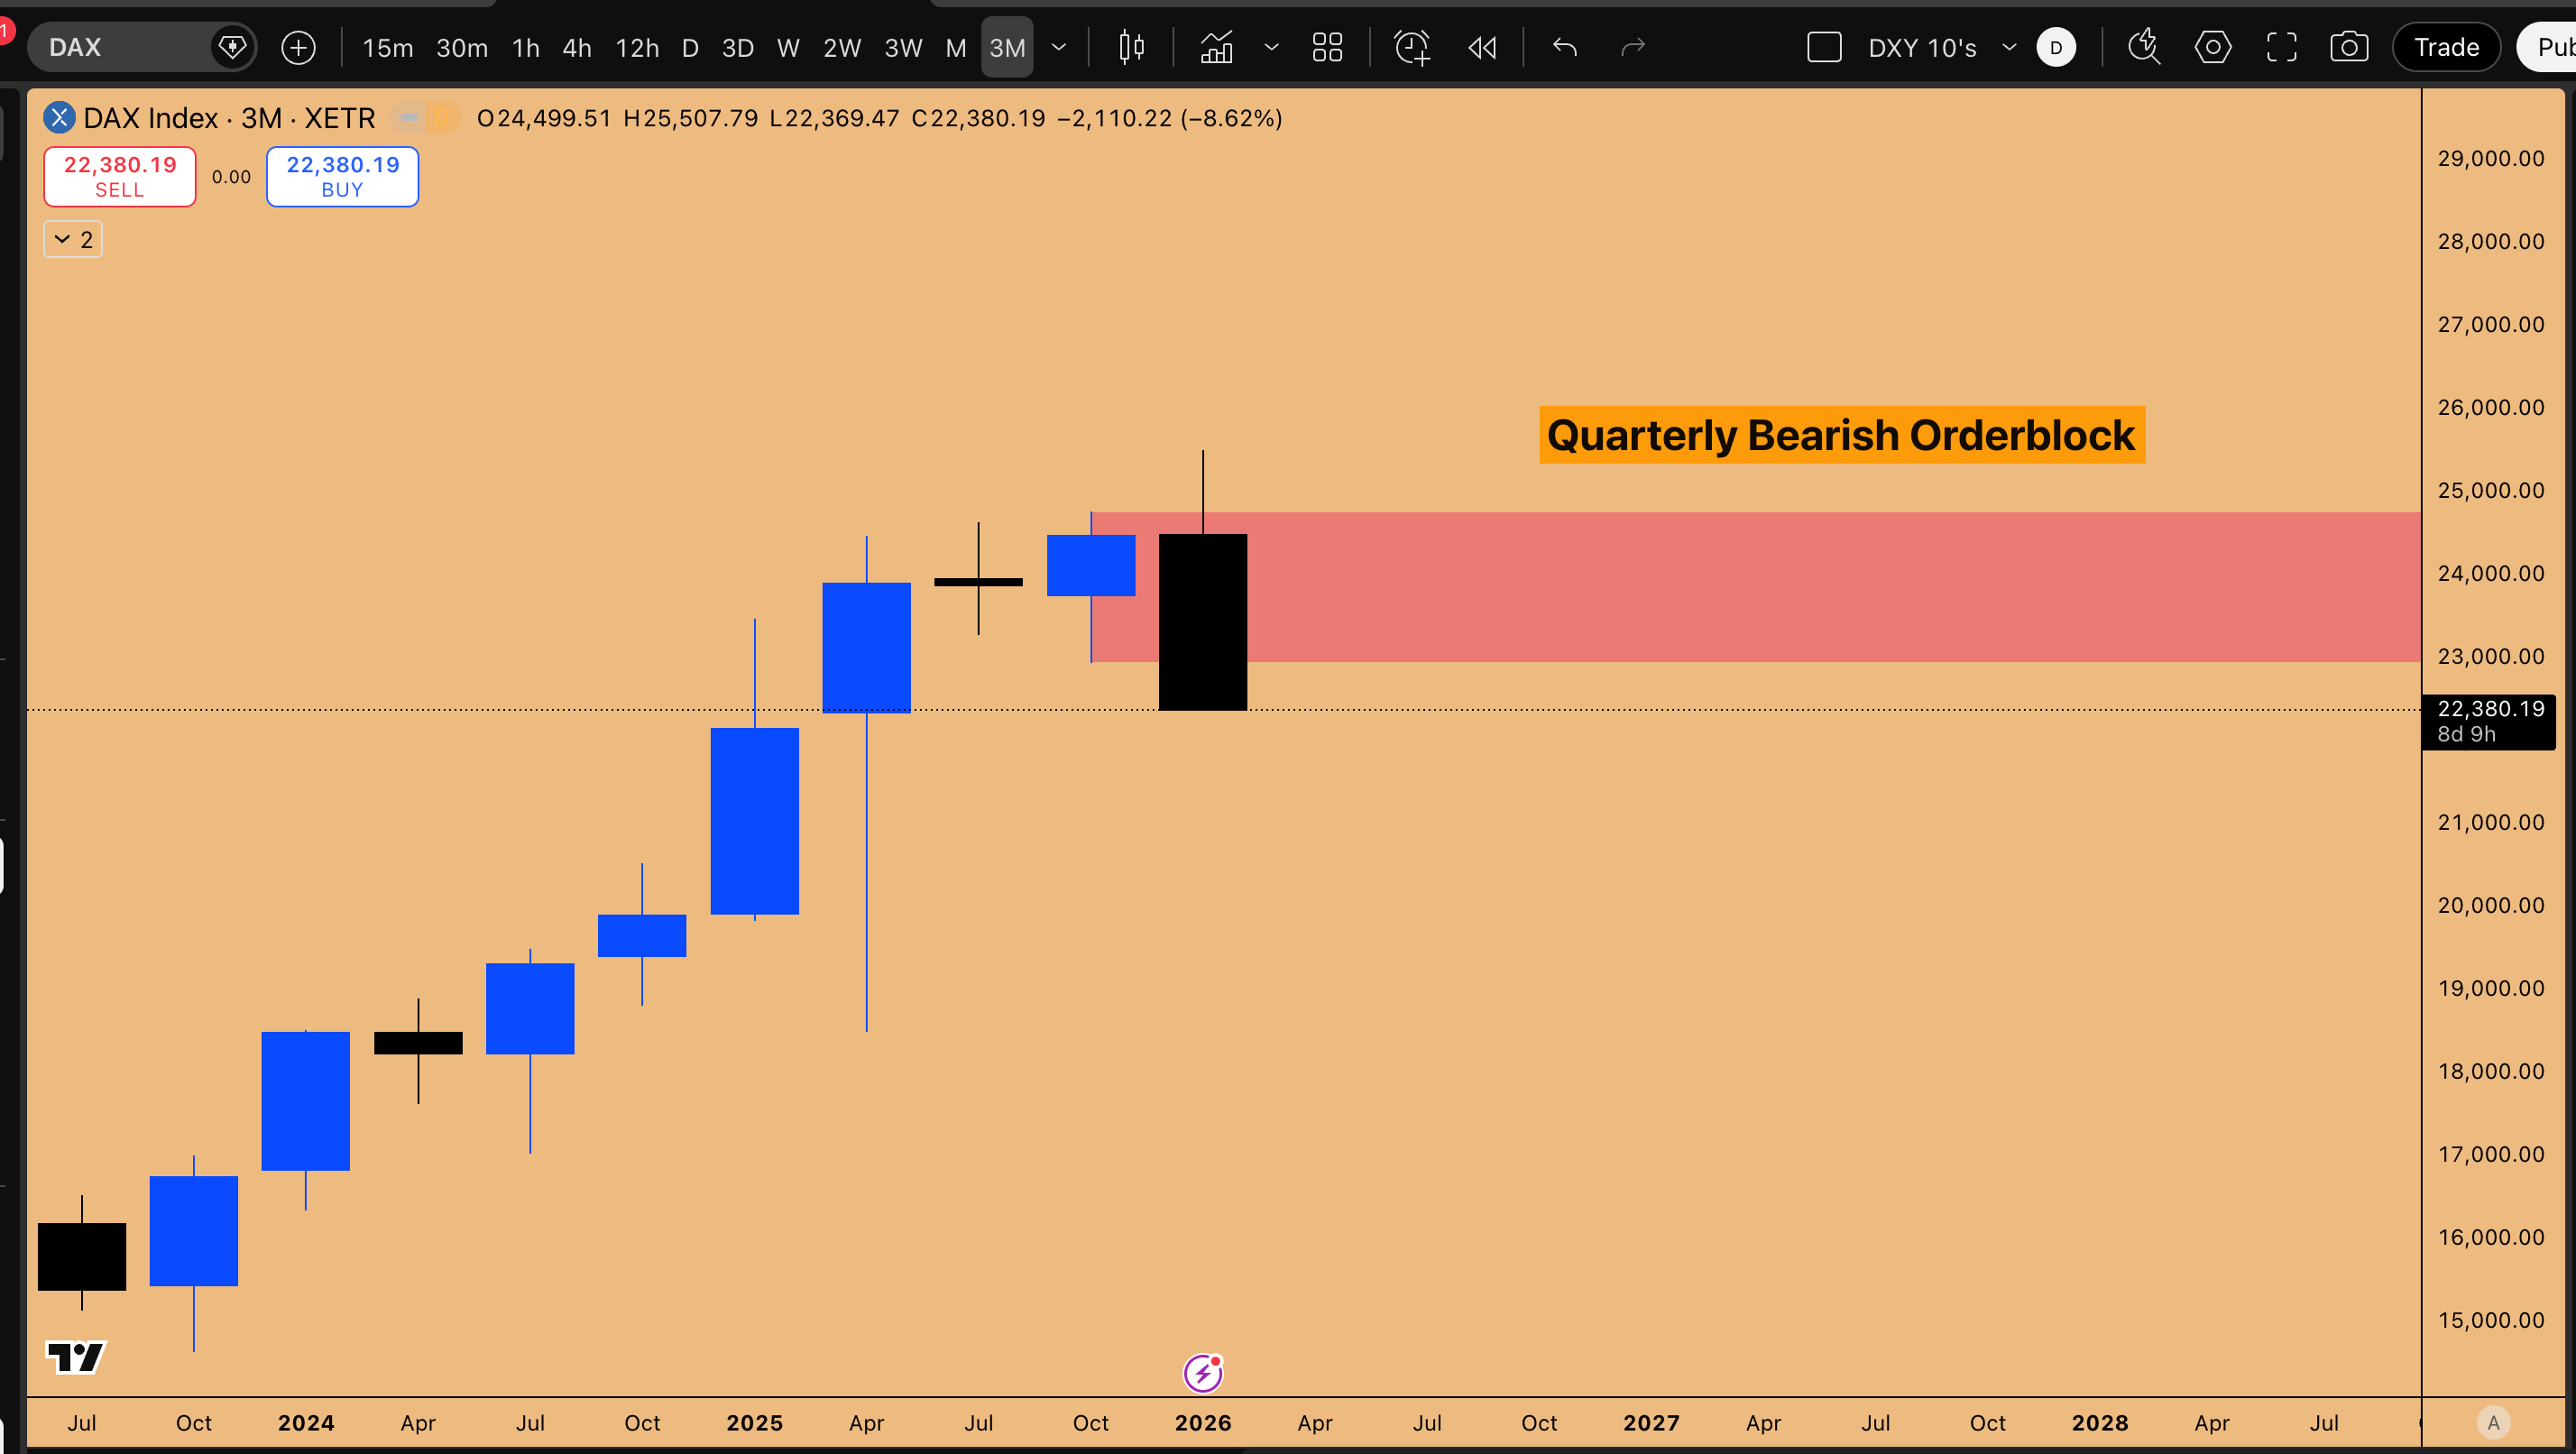
Figure 10: Quarterly Bearish Orderblock on DAX, SPX500 and NAS100
Individual names are confirming the same thesis. Shopify (SHOP), which was flagged at $131 with a target of $91, confirmed an inside two-week failure last week and is now in breakdown mode. Once the new quarterly candle opens, a proper flush in the stock is expected. When single names across multiple sectors—technology, semiconductors, e-commerce are all confirming the same bearish structural patterns simultaneously, it is no longer a sector-specific story. It is a market-wide regime change.
Jerome Powell is scheduled to depart in May 2026, with Kevin Warsh, selected by Scott Bessent, positioned as his likely successor. This incoming team will be more inclined to coordinate fiscal and monetary policy aggressively. They will have the money-printing bazooka ready. But central banks do not fire preemptively, they require a crisis to justify intervention.
That crisis is currently under construction.
We must wait for a proper Volmageddon where the VIX spikes and a flush occurs. When fear grips the market, as it did in April 2025, that is the time to consider going all-in. Those moments of peak fear often print massive bottoms with career-changing returns.
The indices must crash first. Capital will flood into the dollar for protection, neither gold nor Bitcoin is serving as a safe haven in this environment. Cash is the only shelter, which is precisely why the dollar index looks bullish. And then, once the fear is systemic and the credit stress becomes undeniable, the central bank will intervene with overwhelming force.
That intervention will mark the generational bottom. The transition from the Powell era to the Warsh-Bessent regime is not just a personnel change, it is a philosophical shift toward coordinated stimulus at a scale designed to arrest a credit crisis. The traders who survive the Volmageddon flush with capital intact and conviction in place will be positioned for the kind of returns that define careers.
The storm is not behind us. It is directly ahead. And on the other side of that storm lies the single greatest buying opportunity of this market cycle.
Key Takeaways: Market Structure & Technicals
Bearish Alignment: The S&P 500 has completed its liquidity sweep at 6,510, triggering a bearish market structure shift across four major timeframes (Quarterly, Monthly, 3-Week, and Weekly). This suggests a systemic trend change rather than a routine pullback.
The VIX Divergence: The VIX’s failure to spike alongside falling equities indicates persistent complacency. A “Volmageddon” event remains likely, with quarterly targets of 59–66 yet to be tested.
Nasdaq Vulnerability: Despite apparent resilience, the index is held up solely by Nvidia. Key quarterly supports in Microsoft have failed, while the semiconductor sector (LRCX, MU) mirrors bearish historical patterns. A move toward the 20,000–20,613 gap is expected.
Forex & Yields: A bullish US Dollar trajectory is supported by 10-year yield targets of 4.46%–4.63%.
AUDUSD: High-conviction short (5.59 R/R) as gold support fades.
GBPUSD: Bearish setup (2.9 R/R) at the daily order block, driven by yield strength.
Crypto Decoupling: Bitcoin has already endured a 52% drawdown, significantly ahead of the Nasdaq’s correction. Expect range-bound accumulation between $60,000 and $74,000 over the next 3–6 months.
Outlook: The Macro Path Forward
The “Flush” Phase
The immediate horizon favors maximum pain for early dip-buyers. The combination of a VIX spike and credit stress will likely serve as the catalyst for a generational bottom.
The Intervention Floor
The ultimate market floor will be defined by institutional shifts:
Leadership Transition: The move from Powell to Warsh.
Fiscal Coordination: Implementation of the “Bessent” fiscal strategy.
Liquidity Injection: The inevitable return to central bank intervention (the “money-printing bazooka”) to stabilize the credit event.
Disclaimer: This is not financial advice—just market analysis derived from the charts and discussion. Always conduct your own research.
If you found this analysis valuable, please share it with fellow traders!
Great read, thank you