

Market Situation Report: Trend Update
Inside Bar Cluster Breakouts, Amazon’s AI Automation Pivot, and Bitcoin’s Sentiment Capitulation


Executive Summary
For five months, the NASDAQ has been grinding sideways, bleeding conviction from every portfolio manager and retail trader watching the tape. A quarterly breakdown looked imminent. Inside 3-week candle patterns were resolving to the downside. Technical signals screamed continuation lower. And then in the span of a single week everything flipped.
A Middle East ceasefire announcement became the match that lit the fuse, but make no mistake: the ceasefire itself is almost irrelevant for what is about to come. What matters is what happened structurally in the wake of that headline. Broken support zones that should have acted as resistance during a bear market bounce? The market blew straight through them. The two-week candle that was confirming a bearish breakdown? It reversed into a bullish order block. And now, a pattern that has appeared only 13 times in the NASDAQ’s entire price history: a cluster breakout on the 3-week time frame, is on the verge of confirming. Every single one of those 13 prior instances delivered a minimum 15% forward return and a trending move lasting at least 15 weeks

.
This is not a bounce. This is not a dead cat rally. This is the structural ignition of a multi-month bull run and the market is telling you exactly which companies will lead it.
The question isn’t whether the rally is real. The question is whether you’re positioned for what comes next. Amazon is forming an ascending triangle that has been compressing for an entire year, and its AI-driven autonomous fulfillment pivot could double its profit margins. Nvidia is printing a double inside two-month candle pattern “failure” with untapped upside liquidity: A configuration that historically precedes explosive continuation. Meta is the best catch-up trade on the board, lagging Amazon’s structure by weeks while offering superior risk-reward. And Bitcoin, sitting at the intersection of sentiment capitulation and a confirmed inside daily candle support zone, may have already printed its cycle low.
But here’s what nobody is talking about: the geopolitical calendar is about to become the market’s best friend. The 2026 FIFA World Cup kicks off in June across the US, Canada, and Mexico. The United States’ 250th anniversary lands in July. Midterm elections loom in November. The current administration has every incentive to stabilize markets and fast. The window for chaos is closing. The window for risk-on positioning is opening right now.
What looks like uncertainty today is setting the stage for something far more violent to the upside… and the patterns are already firing.
NASDAQ’s inside 3-week cluster breakout is confirming—a pattern with a 100% historical hit rate on 15%+ forward returns
Amazon’s ascending triangle targets a 50% breakout, with LEAP options offering 100–150% return potential by next earnings
Nvidia’s double inside two-month pattern points to $211 with downside liquidity already swept
Meta offers the strongest risk-reward catch-up trade, with 17% upside just to match Amazon’s relative position
Bitcoin’s inside daily candle support at $66,500 may mark the secular cycle low, with a leveraged long setup delivering up to 8:1 reward-to-risk
Hyperliquid’s stock-trading-via-stablecoin model positions it as the breakout crypto-adjacent equity of the cycle
JPMorgan’s earnings this week will set the tone—and JPM itself is firing an inside 3-week failure long
Geopolitical tailwinds from the World Cup, the US 250th anniversary, and midterm election dynamics all converge into July
The Structural Flip: How a Breakdown Became a Launchpad
From Bearish Confirmation to Bullish Order Block
Heading into last week, the NASDAQ was exhibiting textbook breakdown mechanics on the highest time frames. Inside 3-week candle patterns had resolved to the downside. The two-week candle was closing beneath broken support. Every technical checklist pointed toward continuation lower a proper structural breakdown targeting the downside gap and the liquidity pool below.
The entire quarterly outlook had been built around a disciplined thesis: wait for the VIX to spike, load up on long positions at distressed levels, and ride the recovery. It was a patient, methodical approach and it was about to become completely obsolete. The ceasefire announcement in the Middle East served as the catalyst, but the deeper truth is that even if the ceasefire collapses and hostilities resume, the structural damage has already been done to the bears. The market rallied over 10% from its low at 22,834. That kind of move requires coordinated repositioning across institutional desks. It does not simply reverse because a headline changes. The positioning shift is real, and it is permanent.
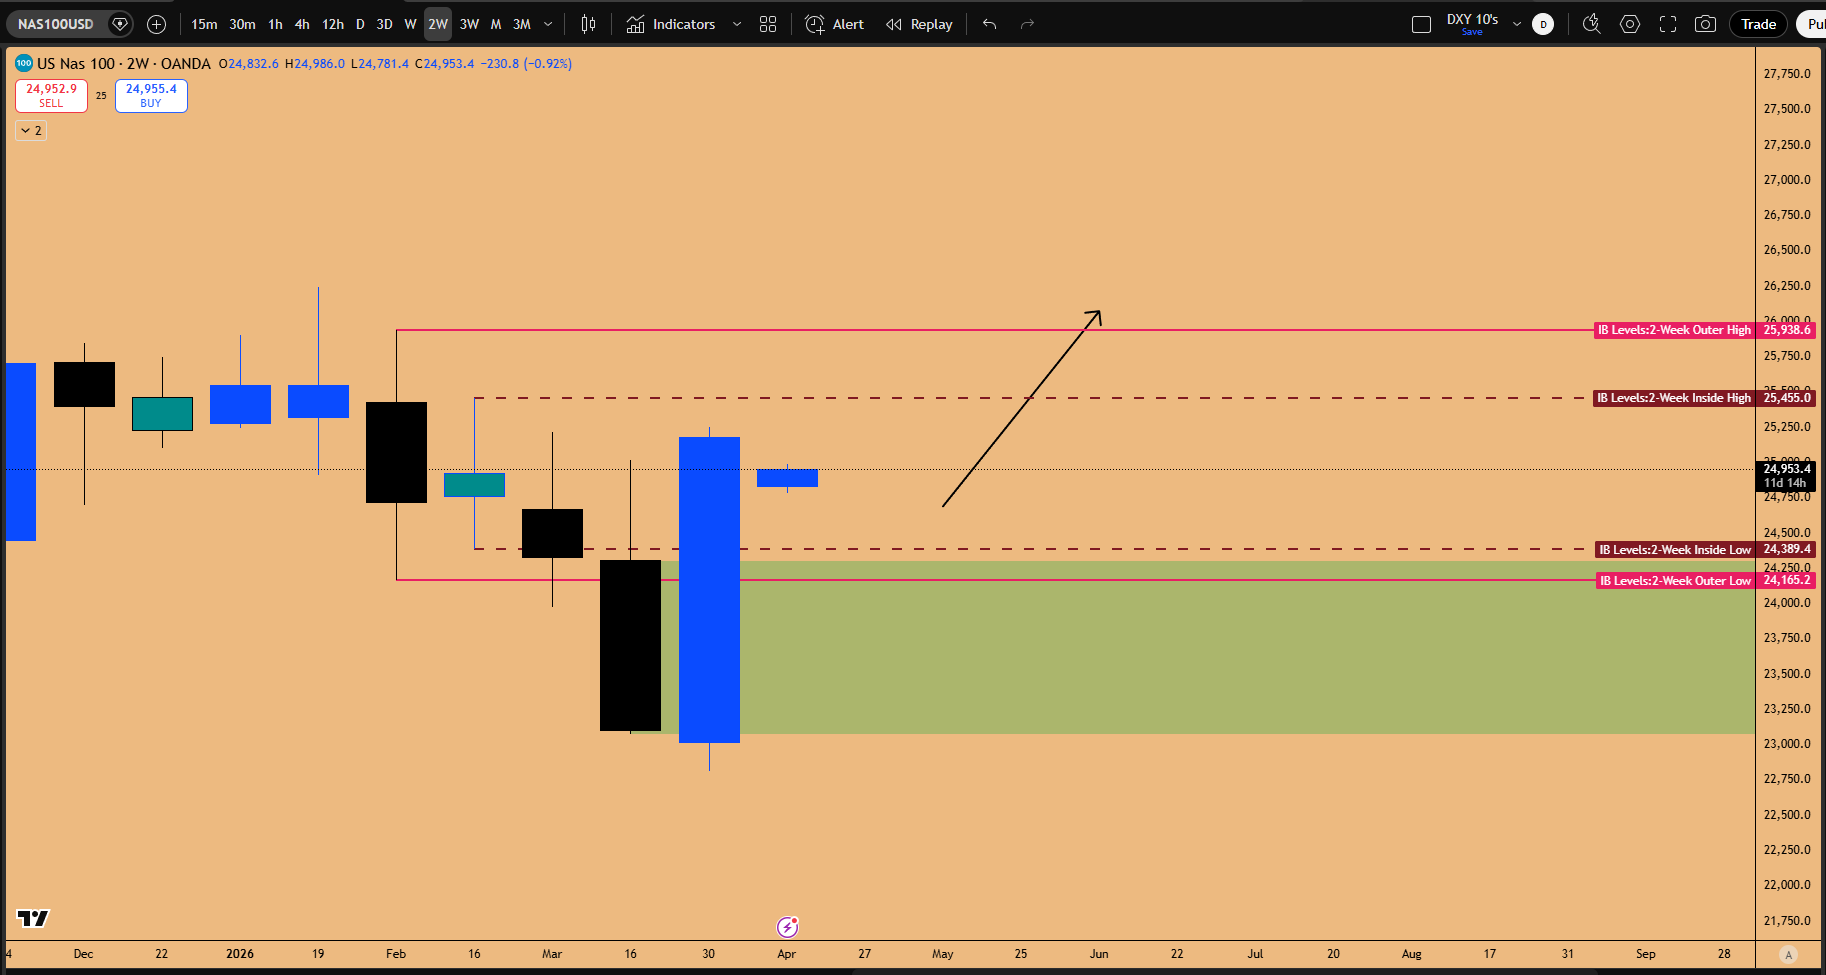
Figure 1: Inside 2-Week Candle Failure confirmed, NAS100 closed back within the Inside 2-week candle range
Then the market did something it was never supposed to do: it reclaimed every broken level.
