

Market Structure Shifts Ahead: Analyzing US30 Shorts, Gold's Rainbow Breakout, Ethereum Dominance, and the Tesla AI Catalyst

Executive Summary
In this abrupt yet crucial market update, we dissect several high-probability setups emerging across equities, cryptocurrencies, forex, and precious metals, particularly in light of the recent positive reaction to CPI data. The prevailing theme is one of divergence and rotation, with specific indices showing signs of exhaustion while others demonstrate unprecedented strength. This analysis provides an exhaustive look at the technical structures, historical parallels, and actionable trade setups currently defining the market landscape. Are the equity markets poised for a reversal, or is this merely a pause before the next leg higher?
We begin with a deep dive into the US30 (Dow Jones), identified as the weakest index. Despite the CPI boost, US30 is approaching a significant bearish order block and weekly resistance zone. A critical Market Structure Shift (MSS) has already occurred, signaled by the breach of a key higher timeframe invalidation zone following a monthly Swing Failure Pattern (SFP) at the all-time high. We explore a preemptive short setup based on an inside weekly candle failure, offering a lucrative 4.68 risk-reward ratio by targeting the lower SR level tap, with a defined stop loss at 44,744.
In contrast, the NASDAQ continues its relentless uptrend, making new all-time highs. However, extreme overbought conditions are flashing warning signs, with the 2-day RSI sitting at 75—a level historically associated with significant tops, such as the pre-banking crisis peak (RSI 79) and the July 2024 Yen carry trade collapse (RSI 76). While shorting is premature without a confirmed MSS, we discuss the mechanics of how tops form through RSI divergence and the importance of the current weekly invalidation level at 22,668. Furthermore, we analyze the implications of September seasonality, which typically brings a 7-10% correction, informing the strategy to remain largely in cash (excluding Gold) and prepare for portfolio realignment in October.
The rotation narrative is most evident in cryptocurrencies. While Bitcoin remains stagnant, consolidating sideways for the past month, Ethereum (ETH) has gone "berserk," printing one of the largest quarterly candles on record. This divergence signals an active rotation of capital from BTC to ETH, fostering an environment ripe for altcoin performance. We examine the ETH/BTC pair's inside monthly candle failure, suggesting another 10% upside for Ethereum, and identify key support zones (3700-3860) for future long entries. Specific altcoin setups, including a tactical short on Solana (SOL) following its own MSS and the potential breakout in Link (LINK) mirroring Ethereum's structure, are also detailed.
In precious metals, Gold (XAU/GLD) presents an explosive bullish setup. Currently consolidating within an ascending triangle and a double inside two-month candle formation, Gold is displaying a rare Rainbow Pattern on the GLD ETF—a tight stacking of weekly, monthly, and daily opens signaling imminent expansion. Despite an extreme Monthly RSI of 84, historical analysis suggests Gold requires a "blowoff top" volatility spike before reversing, pointing towards targets of $3600 and potentially $4000.
Finally, we address key viewer questions, focusing on the long-term outlook for Tesla (TSLA). Driven by the overarching AI narrative, Tesla is poised for significant upside based on an inside quarterly candle failure. The key catalyst identified is the November shareholder vote to invest in xAI, which is expected to drastically enhance Tesla's AI capabilities and revenue streams, potentially driving the company towards a $2-3 trillion valuation by 2026. The strategy involves waiting for potential September weakness before positioning for a strong Q4 performance.
Key Takeaways from this Analysis:
US30 Short Opportunity: A high-probability short setup is forming based on a confirmed MSS and an inside weekly candle failure into major resistance.
NASDAQ Caution: Extreme overbought RSI readings suggest limited upside and potential for a 7-10% correction, despite the strong uptrend.
Crypto Rotation: Ethereum is significantly outperforming Bitcoin, signaling an active altcoin season while BTC consolidates.
Gold Breakout Imminent: A rare Rainbow Pattern and ascending triangle consolidation point towards a major upside expansion in Gold, targeting $3600+.
Tesla AI Catalyst: The integration of xAI is identified as the major catalyst for Tesla's next rally to all-time highs, likely starting in October.
Equities in Focus: Divergence Between US30 and NASDAQ
The equity markets are presenting a stark divergence following the recent CPI data. While indices like the NASDAQ push into new all-time highs, the US30 (Dow Jones) is exhibiting significant weakness and presenting a compelling bearish structure near critical resistance zones. This divergence necessitates a tactical approach, focusing shorts on the weakest links while respecting the uptrend in the strongest.
The US30 Bearish Setup: Market Structure Shift and Inside Weekly Failure
A significant setup has been developing on the US30 radar, centered around an inside weekly candle formation. While the market is currently showing a positive reaction to CPI, pushing the price higher, it is crucial to recognize the context: this move is driving directly into a bearish order block formation and a defined weekly resistance zone.
“This is definitely a resistance zone. This is not something which I anticipate the market is going to punch through immediately to the upside. It should be resolving to the downside hopefully.”
The rationale for this bearish bias is rooted in higher timeframe signals. Specifically, the US30 printed a monthly SFP (Swing Failure Pattern), where the market took out the previous all-time high and rejected it heavily. The current bounce is viewed as a test of the weekly resistance zone following this rejection.
Understanding the Market Structure Shift (MSS)
The critical element confirming the bearish bias is the recent Market Structure Shift. Analyzing the weekly chart, the uptrend from the recent bottom was characterized by consistent higher lows. A key moment occurred with an inside weekly candle that saw a stop run to the downside before running higher to all-time highs. This established a new higher timeframe invalidation zone.
“Now look what happens after that. Once you take out this high, you take out the all-time high, market comes down and takes out your invalidation zone. This is called market structure shift.”
This breach of the nearest higher low, creating a lower low, is the first definitive signal of a shift in trend. In such scenarios, traders do not short the lows; instead, they wait for a counter-trend bounce to establish a lower high. The current inside weekly candle formation, boosted by the CPI event, is likely this counter-trend bounce.
The Actionable Short Setup
The setup involves anticipating the failure of the inside weekly candle as it probes the resistance zone.
Entry Trigger: The moment price takes out the inside weekly candle high at 44,507.
Stop Loss: Placed right above the nearest market structure lower high at 44,744. If the structure is truly bearish following the MSS, the market should not trade above this level.
Target: The short position is expected to target the lower SR (Support/Resistance) level tap at 43,159, although an earlier exit (breach of 43,331 low) before the full tap is preferred for risk management, as the SR level tap itself is where long positions should be entertained.
This structure is reminiscent of a past setup observed in the NASDAQ, where the market tested a heavy resistance zone present on the monthly, two-week, and weekly charts. In that instance, an inside daily candle failure into the resistance top preceded a significant breakdown, marking the market top for one to two months. The current US30 weekly structure mirrors this historical daily formation.
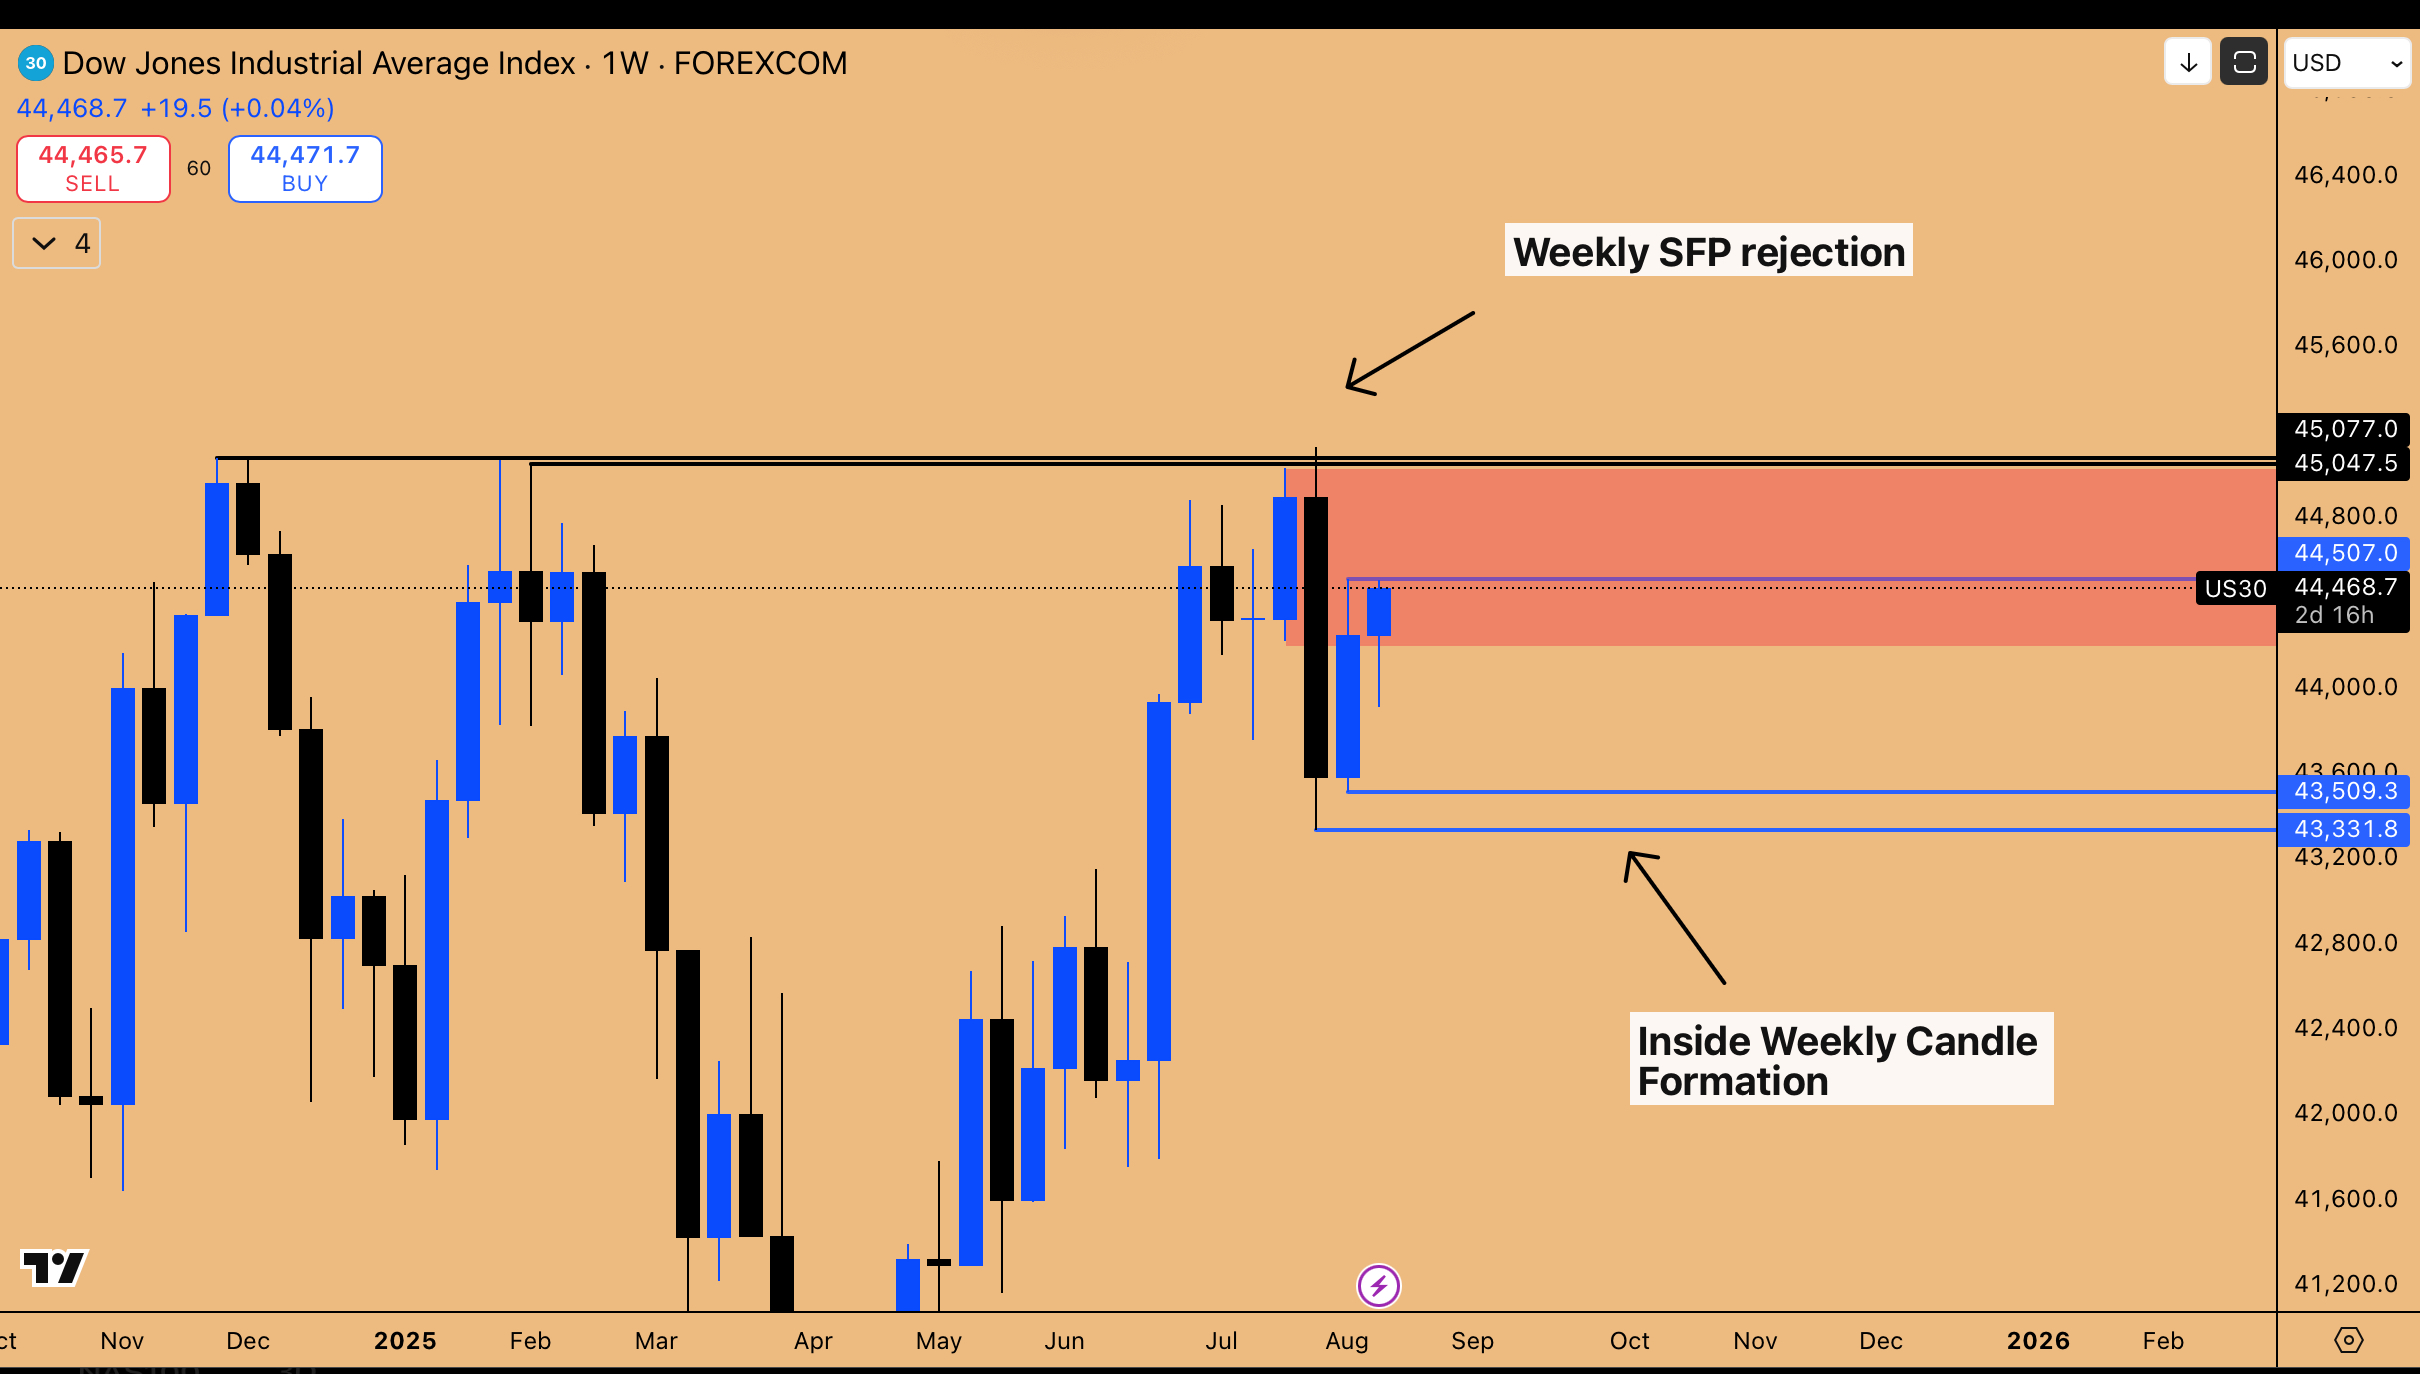
Chart 1: Inside weekly candle pattern in play for US30
NASDAQ Overextension: Analyzing RSI Peaks and Historical Corrections
Shorting the NASDAQ, the strongest index currently making new all-time highs, is ill-advised without clear structural signals. One of the major issues with shorting a strong uptrend is the difficulty in placing a stop loss, as the market is in expansion and continuously making higher lows. As witnessed in the past, many anticipated lower highs based on social media sentiment or fundamental issues (like tariffs), but the market continued to chug along week after week, making higher lows until reaching new all-time highs.
While the NASDAQ is visibly overbought, overbought conditions alone are not a signal to short. A proper signal in the form of a Market Structure Shift (breaking below a recent higher low) is required.
RSI Analysis and Historical Precedents
The 2-day RSI on the NASDAQ is currently sitting at 75. Analyzing the past two years of the uptrend reveals that this level is historically significant.
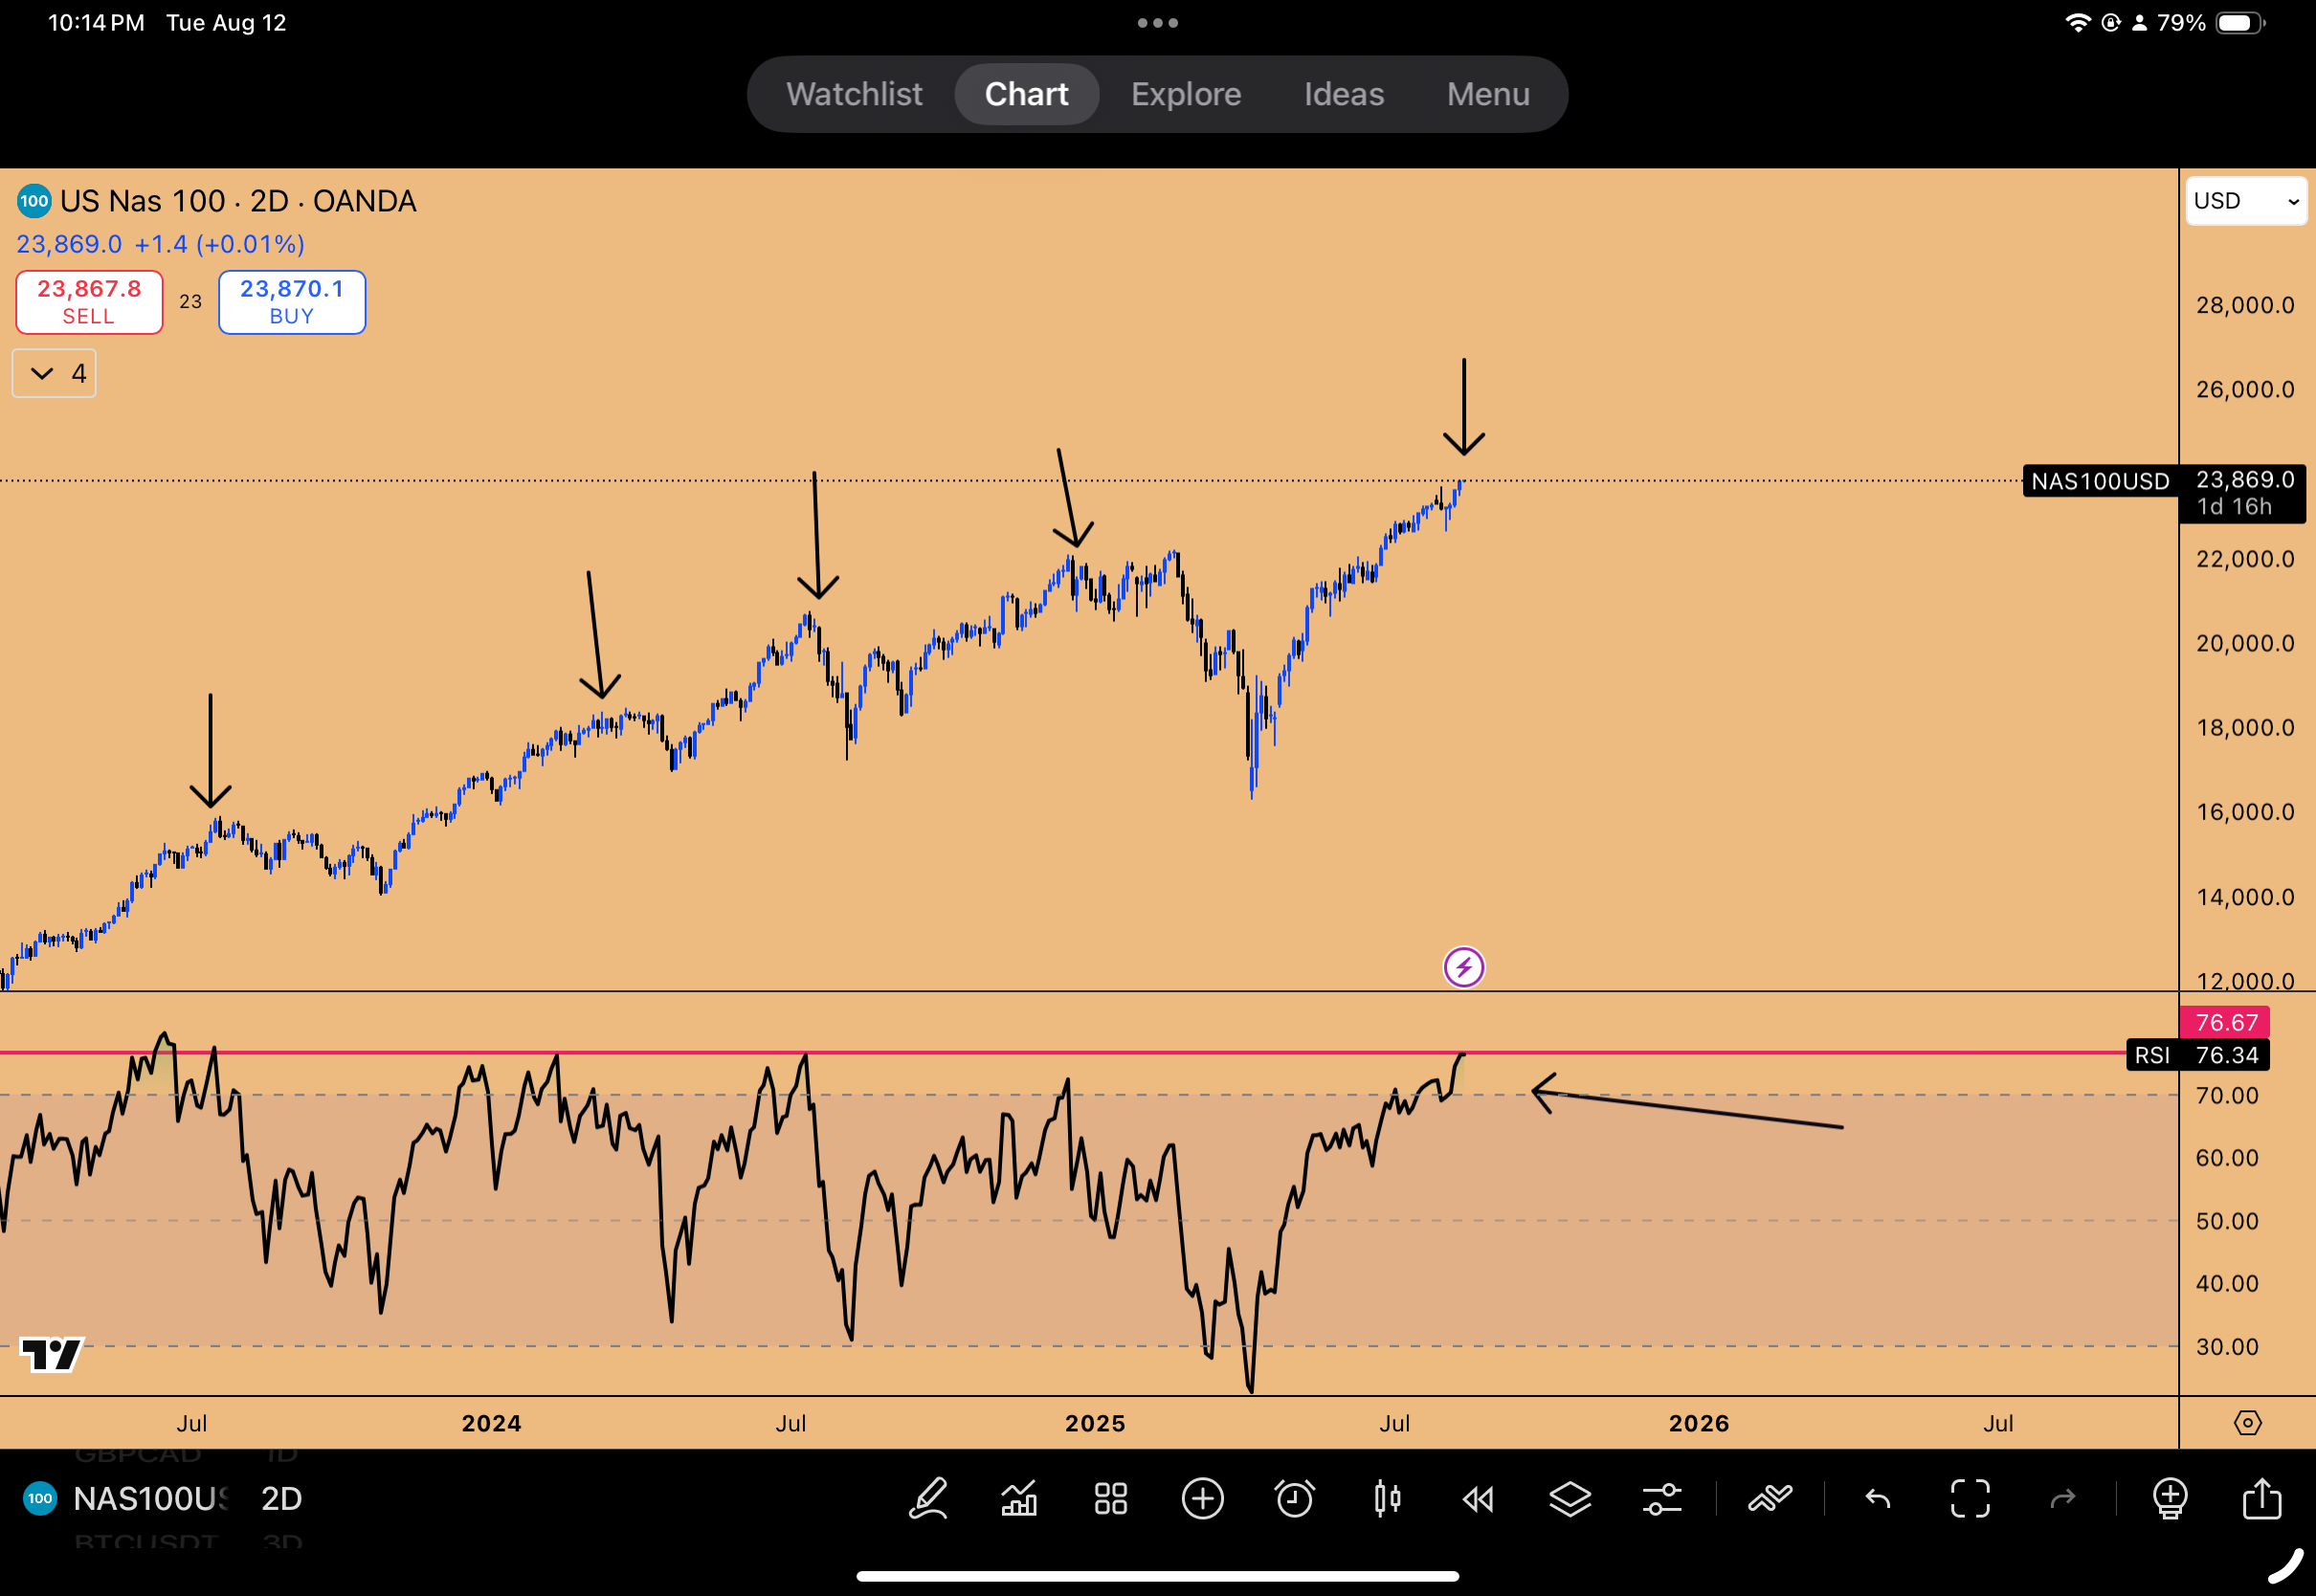
Chart 2: Overbought conditions overlaid with previous examples when RSI touched 75+ on 2-day Time frame
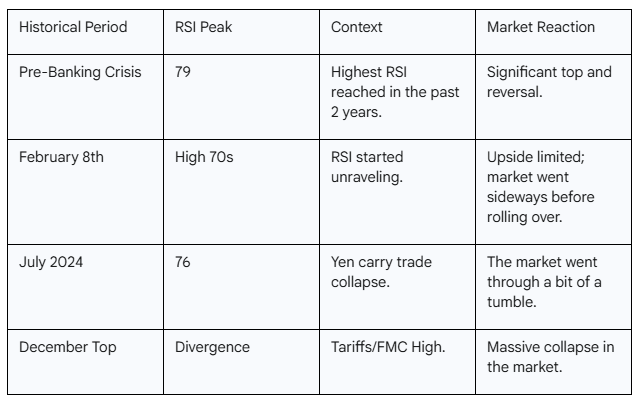
Table 1: Depiction of Previous corrections in NAS100 Index
Now we are sitting at the level where market tends to top out near these levels.
However, history also shows that the market can remain overbought and move sideways or higher until it is ready to break down.
The Mechanics of a Market Top
Observing the daily chart reveals a pattern in how tops are formed when the RSI remains persistently overbought.
Initial Sharp Reaction: A sharp reaction occurs to cool off the RSI.
Dip Buying: The market immediately tries to recover as the "buy the dip" mentality prevails.
RSI Divergence: Crucially, when the dip is bought, the RSI fails to make a higher high, instead printing a lower high while the price makes a higher high.
This divergence signals that “only retail is buying. The big institutions are not buying at all.” Institutions, having sold during the initial reaction, wait for the MSS.
For traders currently long, the key invalidation level is the most recent weekly higher low, which has shifted from 21,351 to 22,668. A breach of 22,668 would constitute a significant weekly market structure shift.
Seasonality and Strategy: Navigating September Weakness
While a weekly MSS seems distant, potentially not occurring until September, the overstretched RSI suggests upside may be limited. This aligns with seasonal trends, where September is typically a weak period.
A hedge position was initiated 2-3 weeks ago, expiring September 30th, betting on the 2-day RSI relaxing into this seasonally weak period. Historical seasonality indicates that the market generally undergoes a 7% to 10% correction starting in August and extending into September.
“In this particular case we haven’t even started that correction yet. We’re still chugging along.”
The danger in a persistently rising market is complacency, where the "new norm" mindset sets in, often preceding a fundamental rug pull. Corrections, typically 8-10% in nature for the NASDAQ, are healthy and provide opportunities to re-enter long positions.
Portfolio Strategy: The current long portfolio has been mostly closed out, with the only remaining position being Gold. The strategy is to let this weak period pass and plan to reopen and reshuffle the portfolio in October.
Precious Metals and FX Dynamics
Significant setups are emerging in both the currency markets and precious metals. Gold is exhibiting signs of imminent bullish expansion from a major consolidation pattern, while the FX market is seeing continued Euro strength against a weakening Dollar, driven by both technical patterns and underlying administrative policy.
Gold's Explosive Setup: The Rainbow Pattern and Ascending Triangle
A very compelling long setup is active in Gold (XAU), with a position entered today at $3350, with a stop loss at $3327 (below $3329). The analysis is primarily based on the Gold ETF (GLD), which reveals critical gaps and patterns controlling the gold market.
The Ascending Triangle and Consolidation
The dominant pattern on GLD is a clear ascending triangle. The market is making consistent higher lows while punching into overhead resistance. This formation typically resolves with a breakout to the upside.
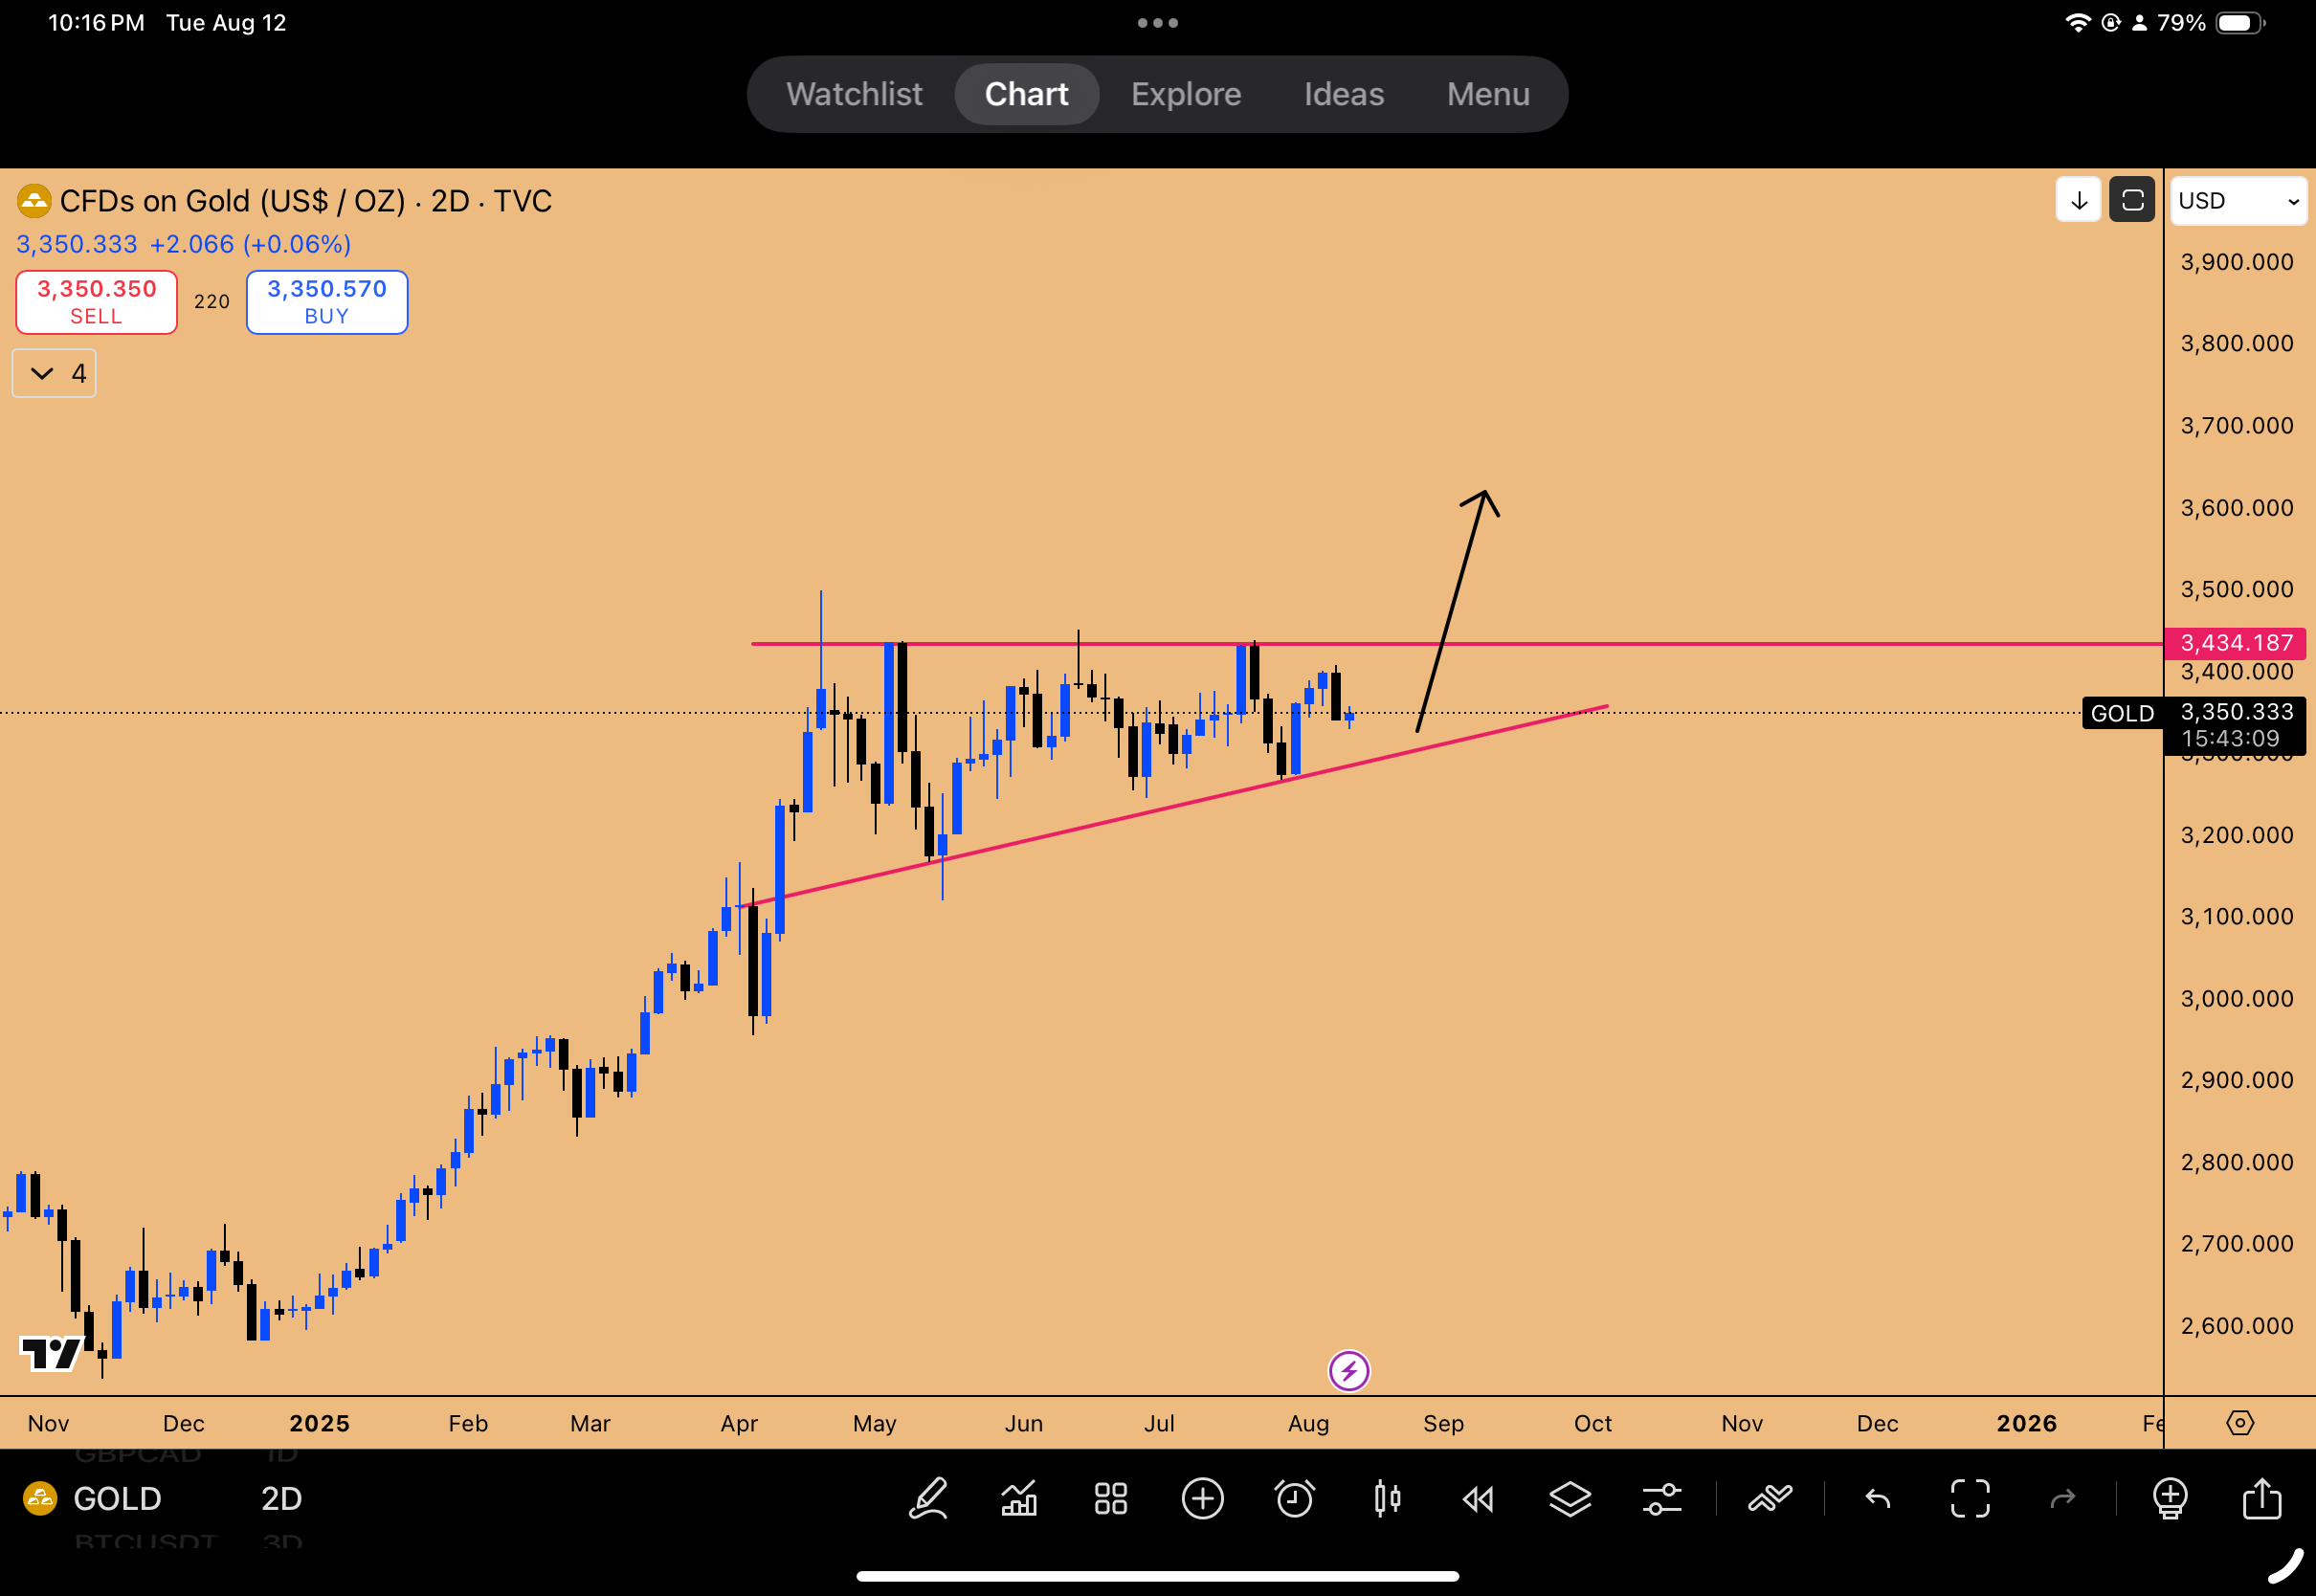
Chart 3: Ascending Triangle Formation in Gold
Currently, the market is in a "chop phase" before the breakout, characterized by volatile moves, including recent gap downs that test trader conviction. However, a massive inefficiency exists in the form of an open gap on the weekly chart. “This is a massive, massive inefficiency and it’s not going to stay. It will most definitely get filled.”
On the daily chart, an open gap to the downside was tested today during the CPI event, resulting in a bullish reaction (an inside hourly candle failure), prompting the long entry. The stop loss is placed below the previous weekly open.
Higher timeframe analysis confirms the consolidation. The two-week chart shows an inside two-week candle, indicating the market is moving sideways to gather energy after a prolonged uptrend. Furthermore, the two-month chart reveals a double inside two-month candle formation.
The Rainbow Pattern on GLD
A crucial observation supporting the bullish thesis is the presence of a Rainbow Pattern on the GLD ETF. This pattern occurs when multiple timeframe opens (monthly, weekly, daily) are tightly clustered, signaling a high-interest level and imminent expansion.
On GLD, the weekly open and the monthly open are tightly stacked at $308.62 and $308.61, with the daily open sitting right on top. Notably, not only the August monthly open but also the July monthly open is at the same level.
“So this is a level of high interest for gold. And if it has to defend, it needs to defend here that I don’t think it should be going down anymore.”
A move above the high at $313 in GLD would likely signal the triggering of this Rainbow Pattern. On the futures chart, this corresponds to a floor of monthly opens establishing $3300 (XAU/USD) as the line in the sand for this consolidation.
Analyzing Gold's Extreme RSI and Future Targets
A point of concern is the extremely overbought condition of Gold's RSI. The Monthly RSI is sitting at 84, which is one of the highest readings across any asset class.
However, Gold is an asset where the RSI can become extremely elevated before topping out. Historical bull runs show Gold has a tendency to run until the Monthly RSI reaches 90 or 95.
Crucially, Gold does not typically top out by moving sideways. “No, gold is one of those assets where it goes through a punch... It’s a vertical push and then it pulls a blowoff top and then starts going lower.” The current sideways action, characterized by small candle bodies on the two-week chart, is consolidation, not a top. We are awaiting an upside volatility spike—one monthly candle going "full tilt"—to indicate a topping formation.
Targets and Pivots
The expansion from this unprecedented consolidation suggests significant upside.
First Target: $3600
Second Target: $3734
Potential Extension: $4000
The yearly pivot points also support this outlook. Gold has been defending above the R2 pivot ($3300) and is most definitely expected to reach the R3 pivot, which aligns with the 1.618 Fibonacci extension at $3734 . The swing long position's invalidation is below the current two-month candle low at 3268.
Currency Wars: Euro Strength and the Dollar's Decline
The currency markets feature a significant setup driven by an inside two-week failure on the Euro (EUR). The expansion is underway, following an inside daily candle failure where the lows were taken out and the highs are now being run. The immediate draw on liquidity is to the upside.
Relative Strength vs. the Dollar (DXY)
The dynamic between the Euro and the Dollar is notable. Both featured an inside weekly candle. The Dollar took out its highs (a proper stop run), but the Euro never took out its lows.
“That’s showing relative strength. That’s telling you that euro has more strength behind it and euro is not wanting to go down as much and it just wants to go higher.”
This suggests the Dollar will likely run its lows, allowing the Euro setup to see full completion. However, positioning data indicates that speculators and commercial traders are "mega short" on the dollar. Such stretched positioning often leads to a bottoming formation, suggesting a potential Dollar reversal in the coming months, but no long trigger is present yet.
Euro Long-Term Technicals and Targets
On the monthly chart, the Euro has been in a structural downtrend since July 2008, characterized by persistent lower highs, the most recent being January 2021. Even as the market moves higher, it remains technically bearish on the macro timeframe.
The market is approaching a critical zone between 1.19 and 1.21. This area contains monthly liquidity pools and an untested monthly resistance zone.
“In the coming month or so if you end up testing 1.20. I would say that’s a swing short in making.”
If the monthly downtrend is to remain intact, the next lower high is highly probable to form in this region. However, this technical outlook conflicts with fundamental policy, as US Treasury Secretary Janet Yellen and the current administration desire a lower dollar. Traders should not fight the administration, suggesting that the path of least resistance remains higher for the Euro towards 1.20 until something fundamentally changes.
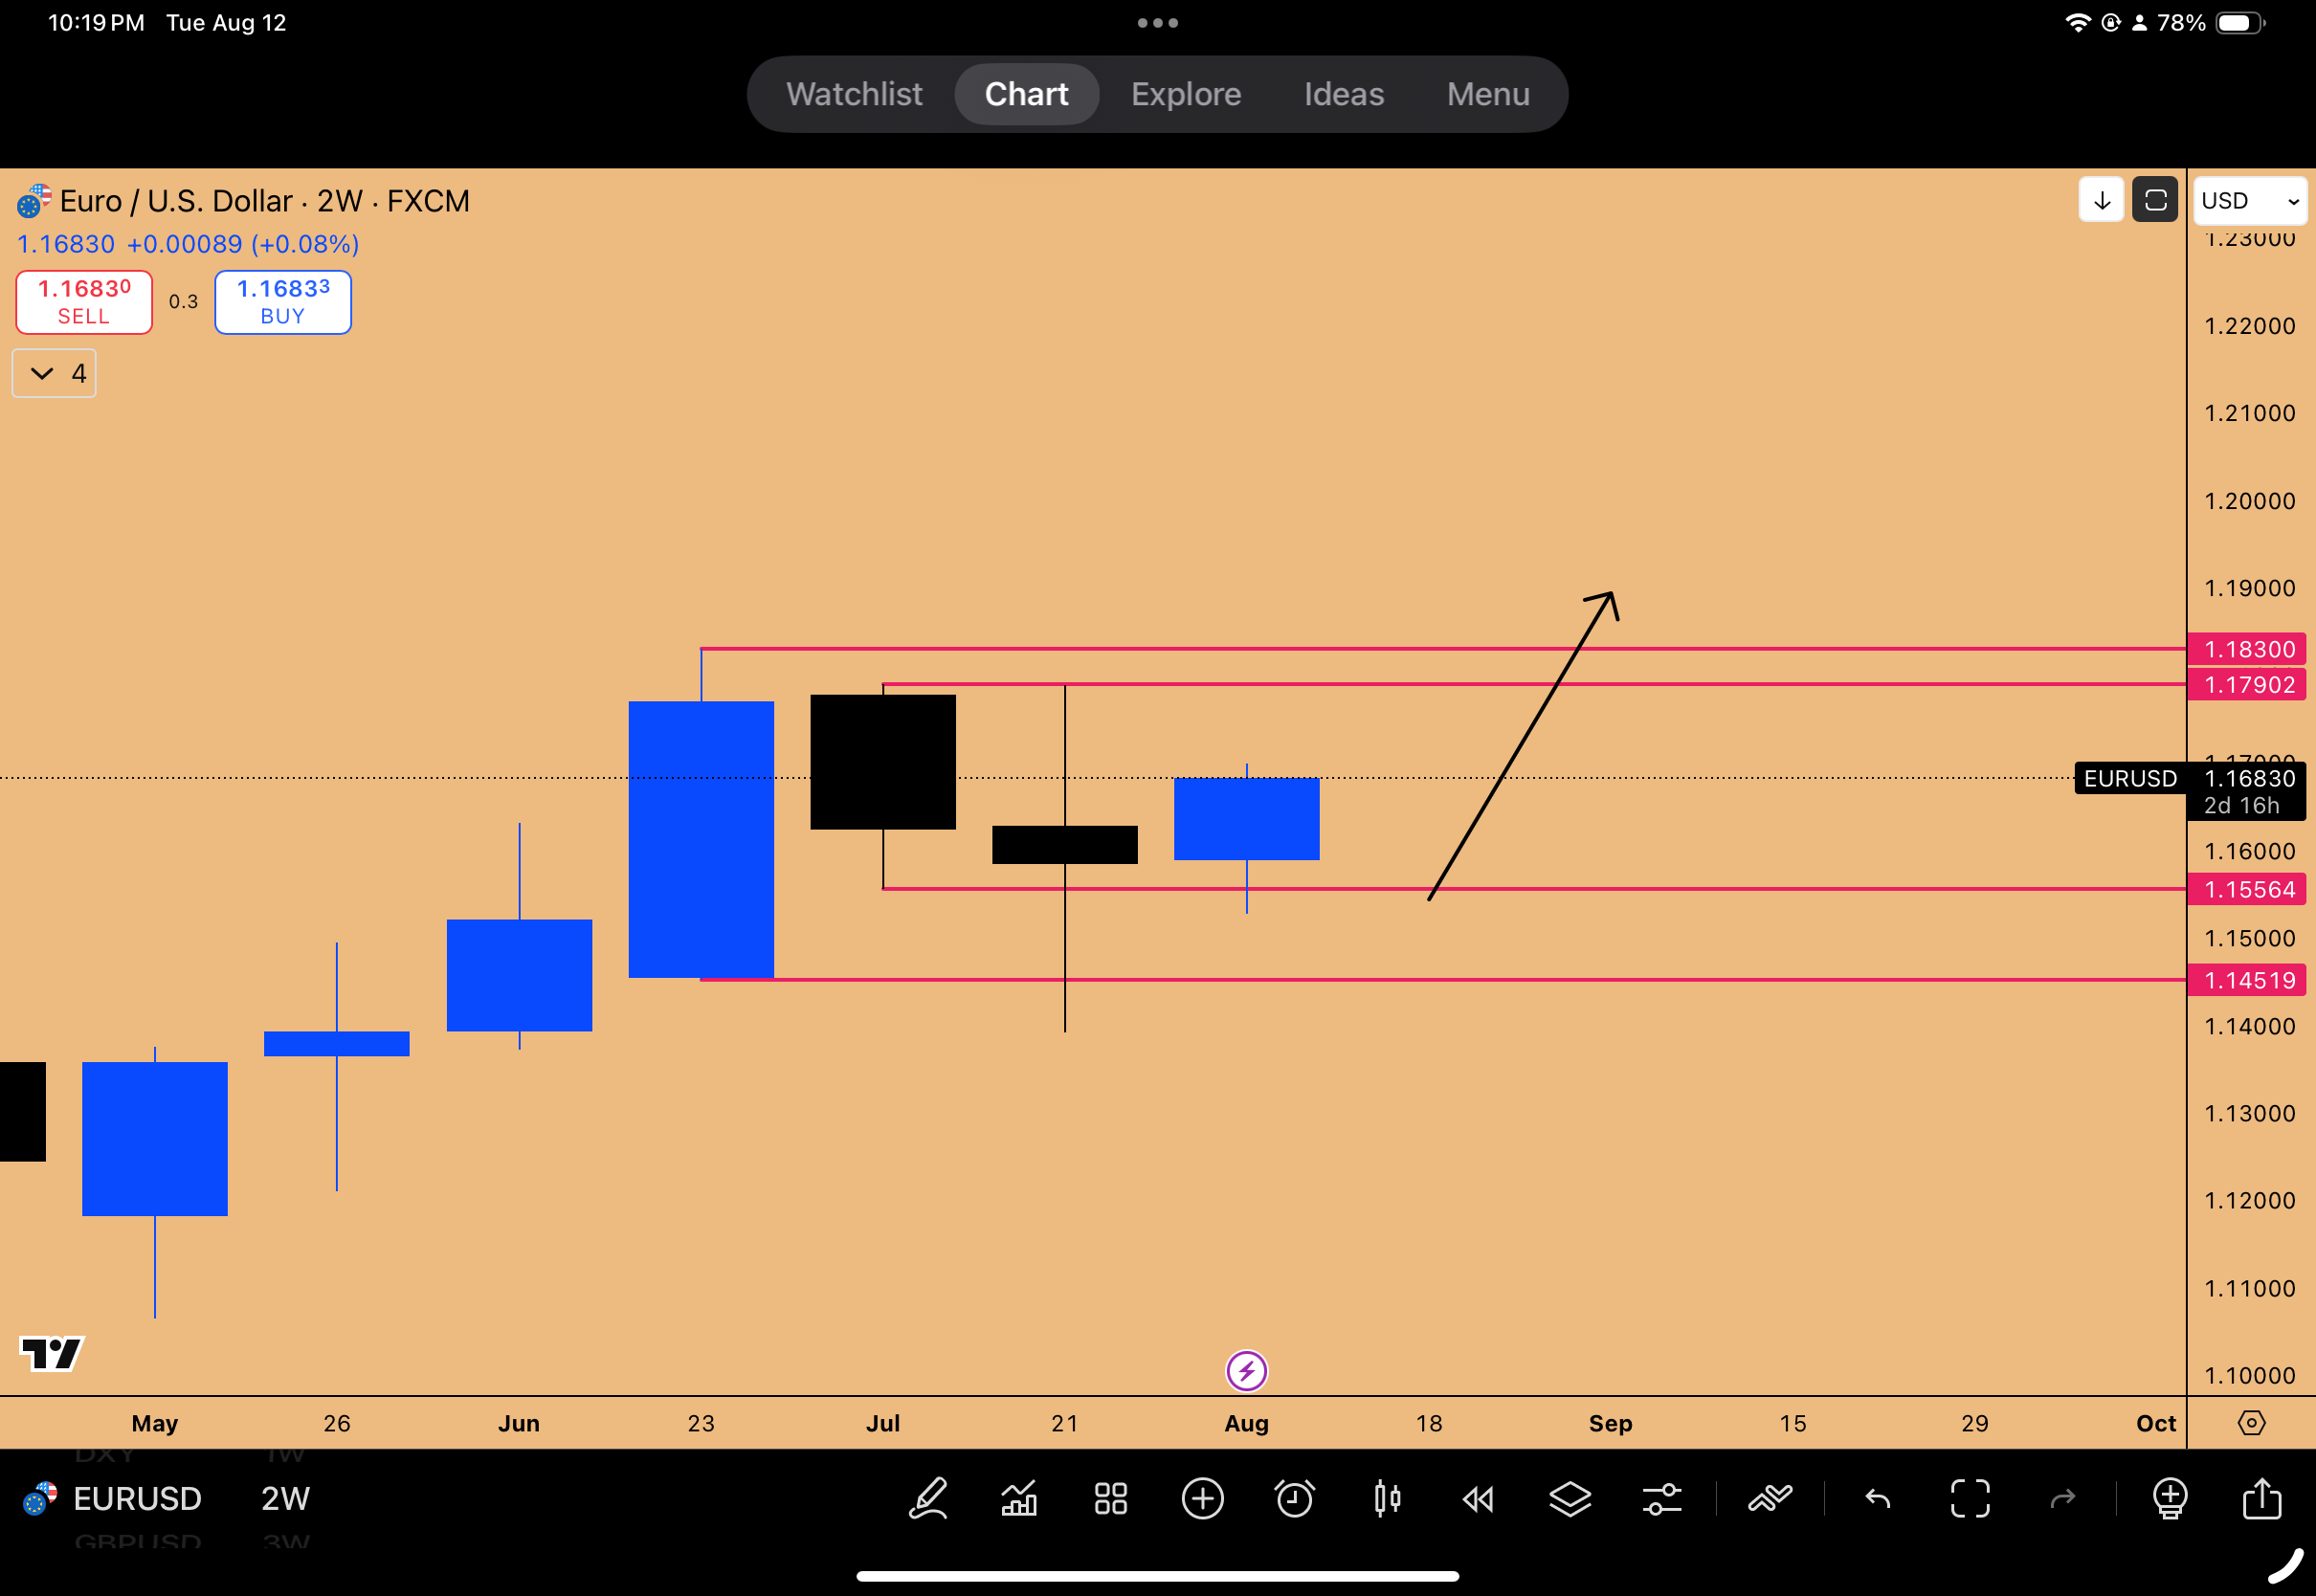
Chart 4: Inside 2-week Candle Failure on EURUSD, targeting further upside
GBP Outlook: Waiting on Euro Confirmation
If the Euro is expected to move higher, the Pound (GBP) will likely follow suit. The GBP has been in a macro downtrend since March 2008. While it is currently near a bearish order block where a top could be anticipated, the recent uptrend suggests dips will continue to be bought.
Given that the Euro has confirmed upside potential, the strategy for GBP is patience. “Just let pound be. Let euro play out its setup and don’t touch pound at all.”
If the Pound moves significantly higher, above 1.38 towards 1.40, it will encounter another untested resistance zone. A move to 1.40 would still maintain the higher timeframe bearish structure and could offer a lucrative swing short opportunity with a stop loss at 1.42, provided a fundamental reason emerges to counter the US administration's stance on a lower dollar.
The Cryptocurrency Rotation: Ethereum Takes the Lead
The cryptocurrency market is characterized by a significant rotation of capital. Bitcoin remains stagnant, while Ethereum is experiencing an explosive move, creating a favorable environment for altcoins.
Bitcoin Consolidates as Ethereum Goes "Berserk"
Bitcoin (BTC) has essentially done nothing over the past month. Analyzing the CME futures chart, a setup identified around July 16th anticipated a gap fill and SR tag for a long entry. Since then, the market has moved down and back up, trading at the same levels as a month ago.
In contrast, Ethereum (ETH) has seen a massive move. While the bottom was called around $2500 targeting $3300-3500, the subsequent rally was missed as focus was on the NASDAQ portfolio. The current quarterly candle on Ethereum is "berserk"—one of the largest on record, making the price action highly unprecedented.
Ethereum Strategy and Support Levels
The current market environment is characterized by significant FOMO, leading many to chase highs. However, this strategy is generally avoided in favor of capital preservation. In crypto uptrends, waiting for deep corrections (50-60%) often means missing the move entirely, but chasing the current levels is still not advisable.
The focus is now on identifying future support zones for the next correction, likely in September or October. The prior resistance zone, tested multiple times before the breakout, will now act as strong support.
Entry Zone: A pullback to the $3860 or $3700 region (potentially tagging the untested monthly open at 3700).
Stop Loss: Below $3363.
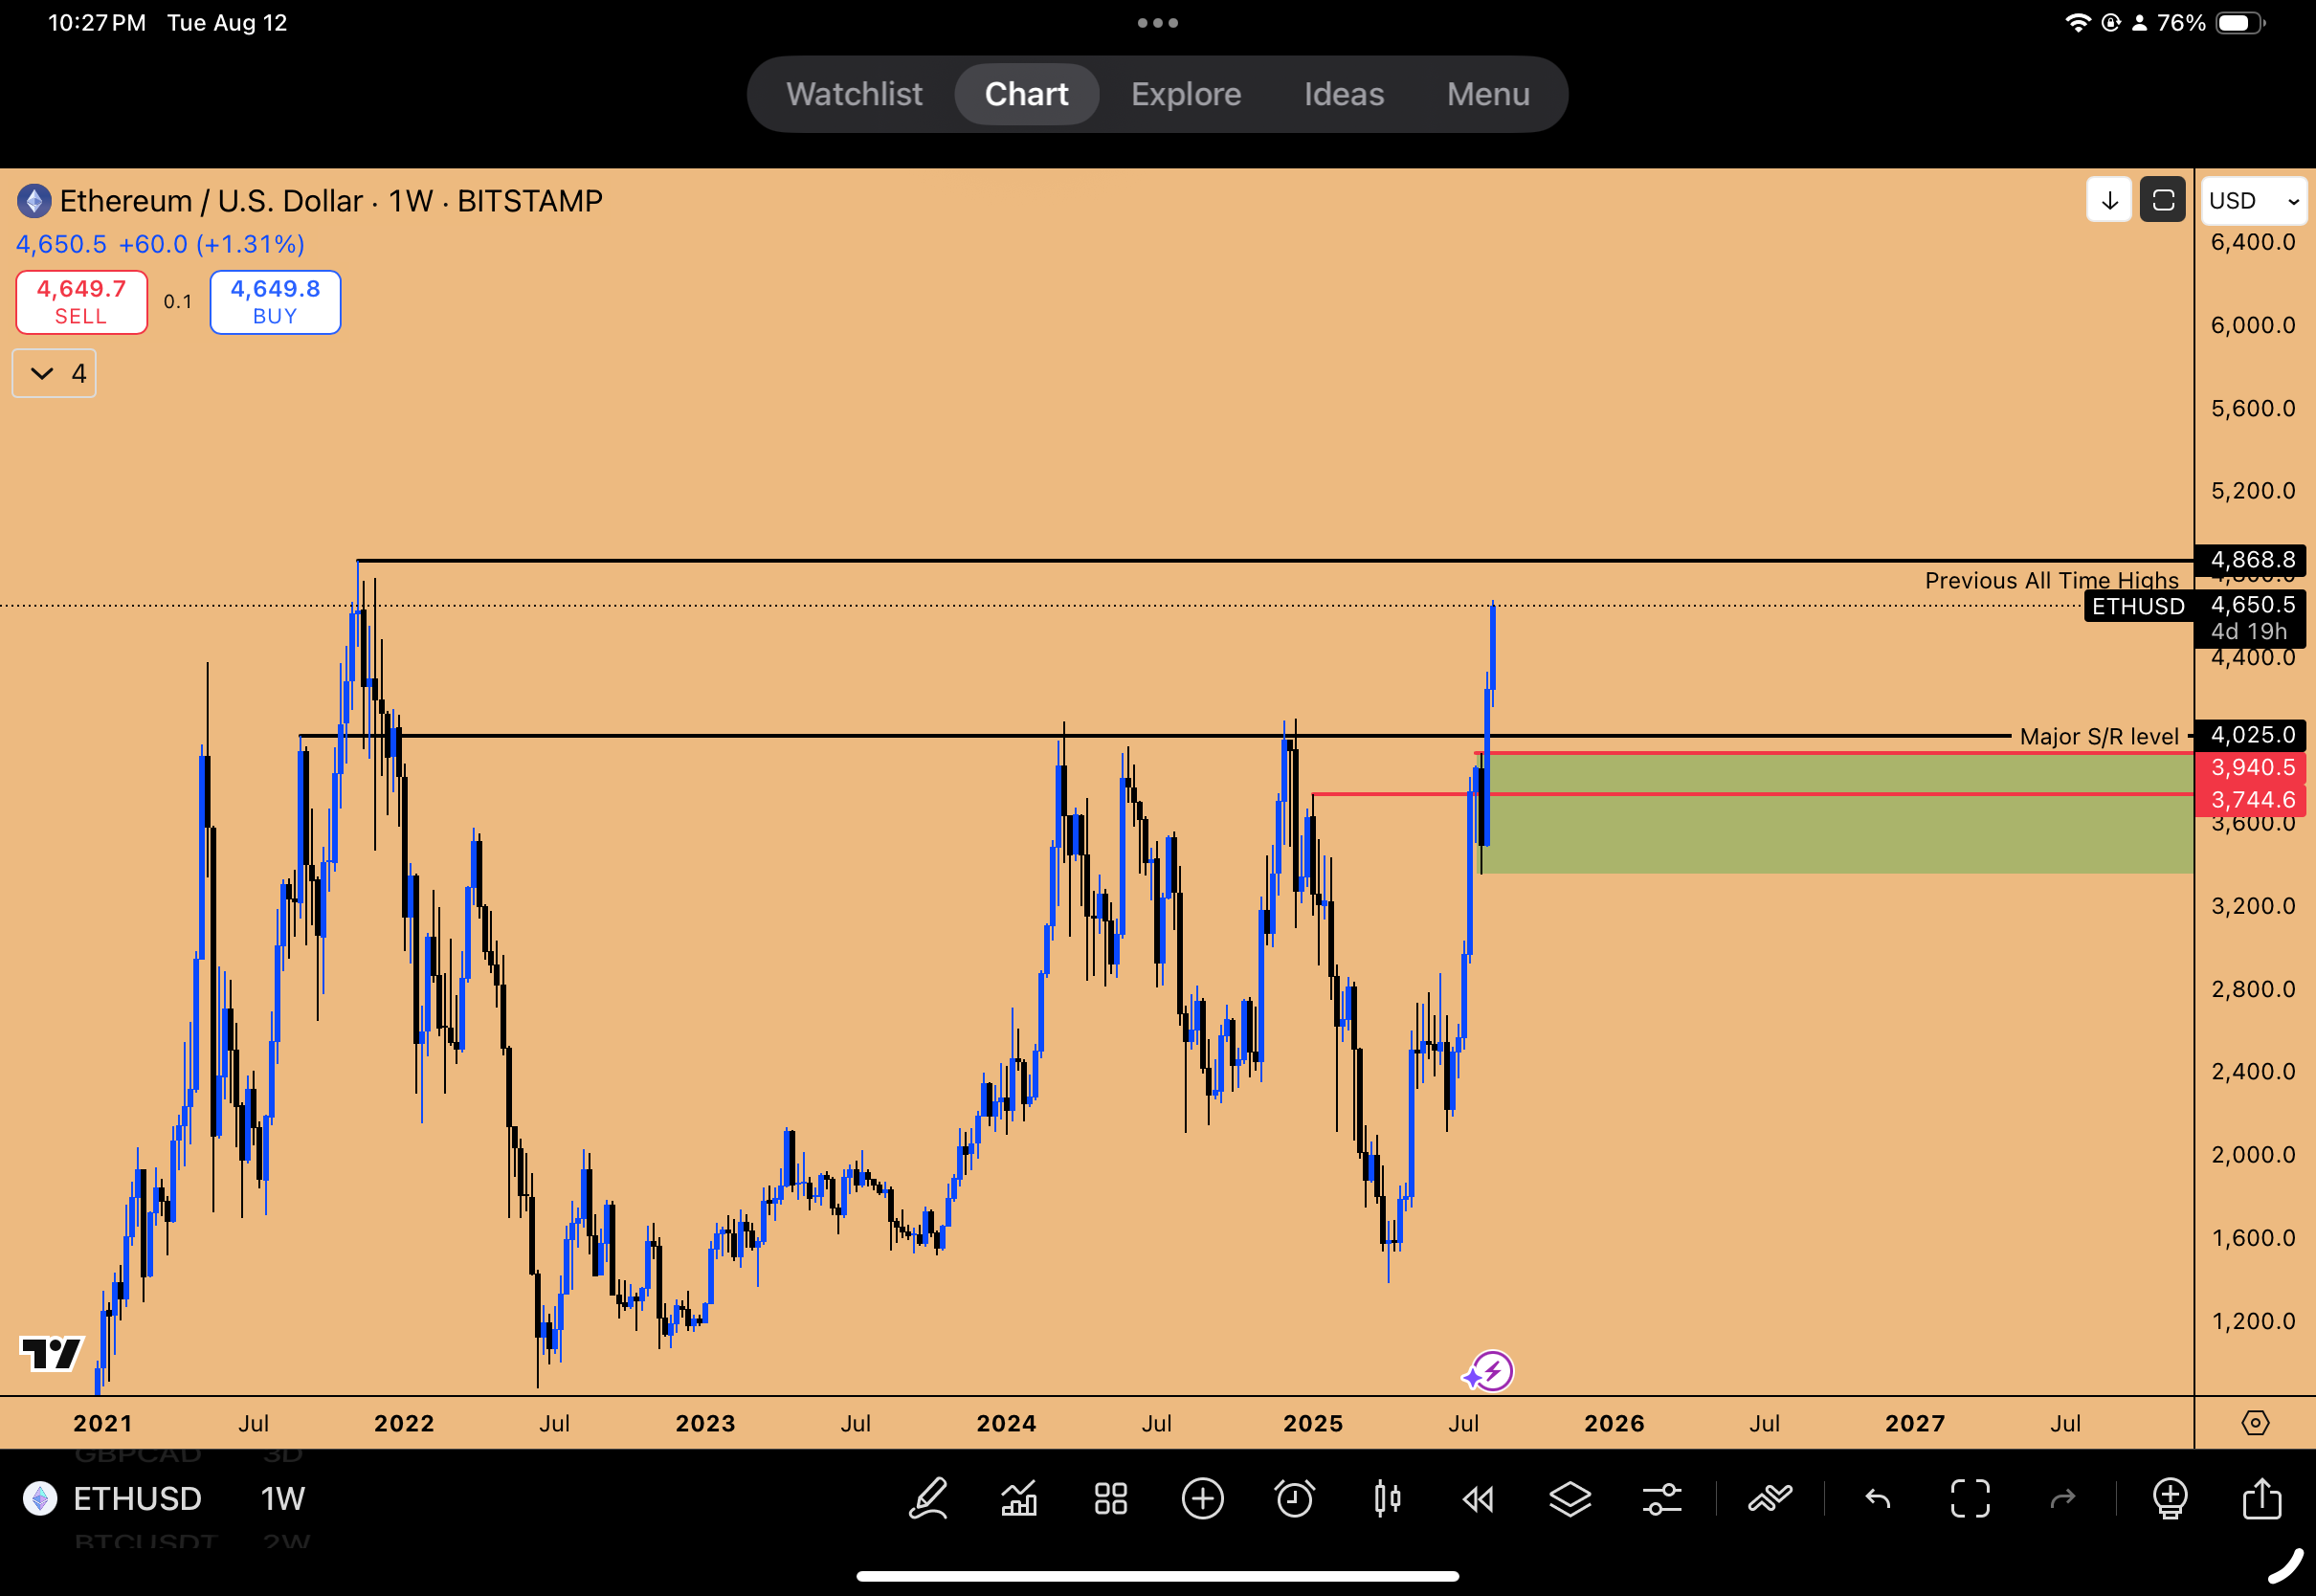
Chart 5: ETHUSD Weekly Support zone formed at key S/R level flip
ETH/BTC Dominance
The ETH/BTC chart confirms the rotation. It is currently trending to the upside, featuring an inside monthly candle failure. This pattern suggests ETH/BTC is targeting 0.04114, implying that Ethereum could see another 10% upside from current levels. This further supports the thesis that altcoins will do well in the immediate future, while Bitcoin may continue to move sideways.
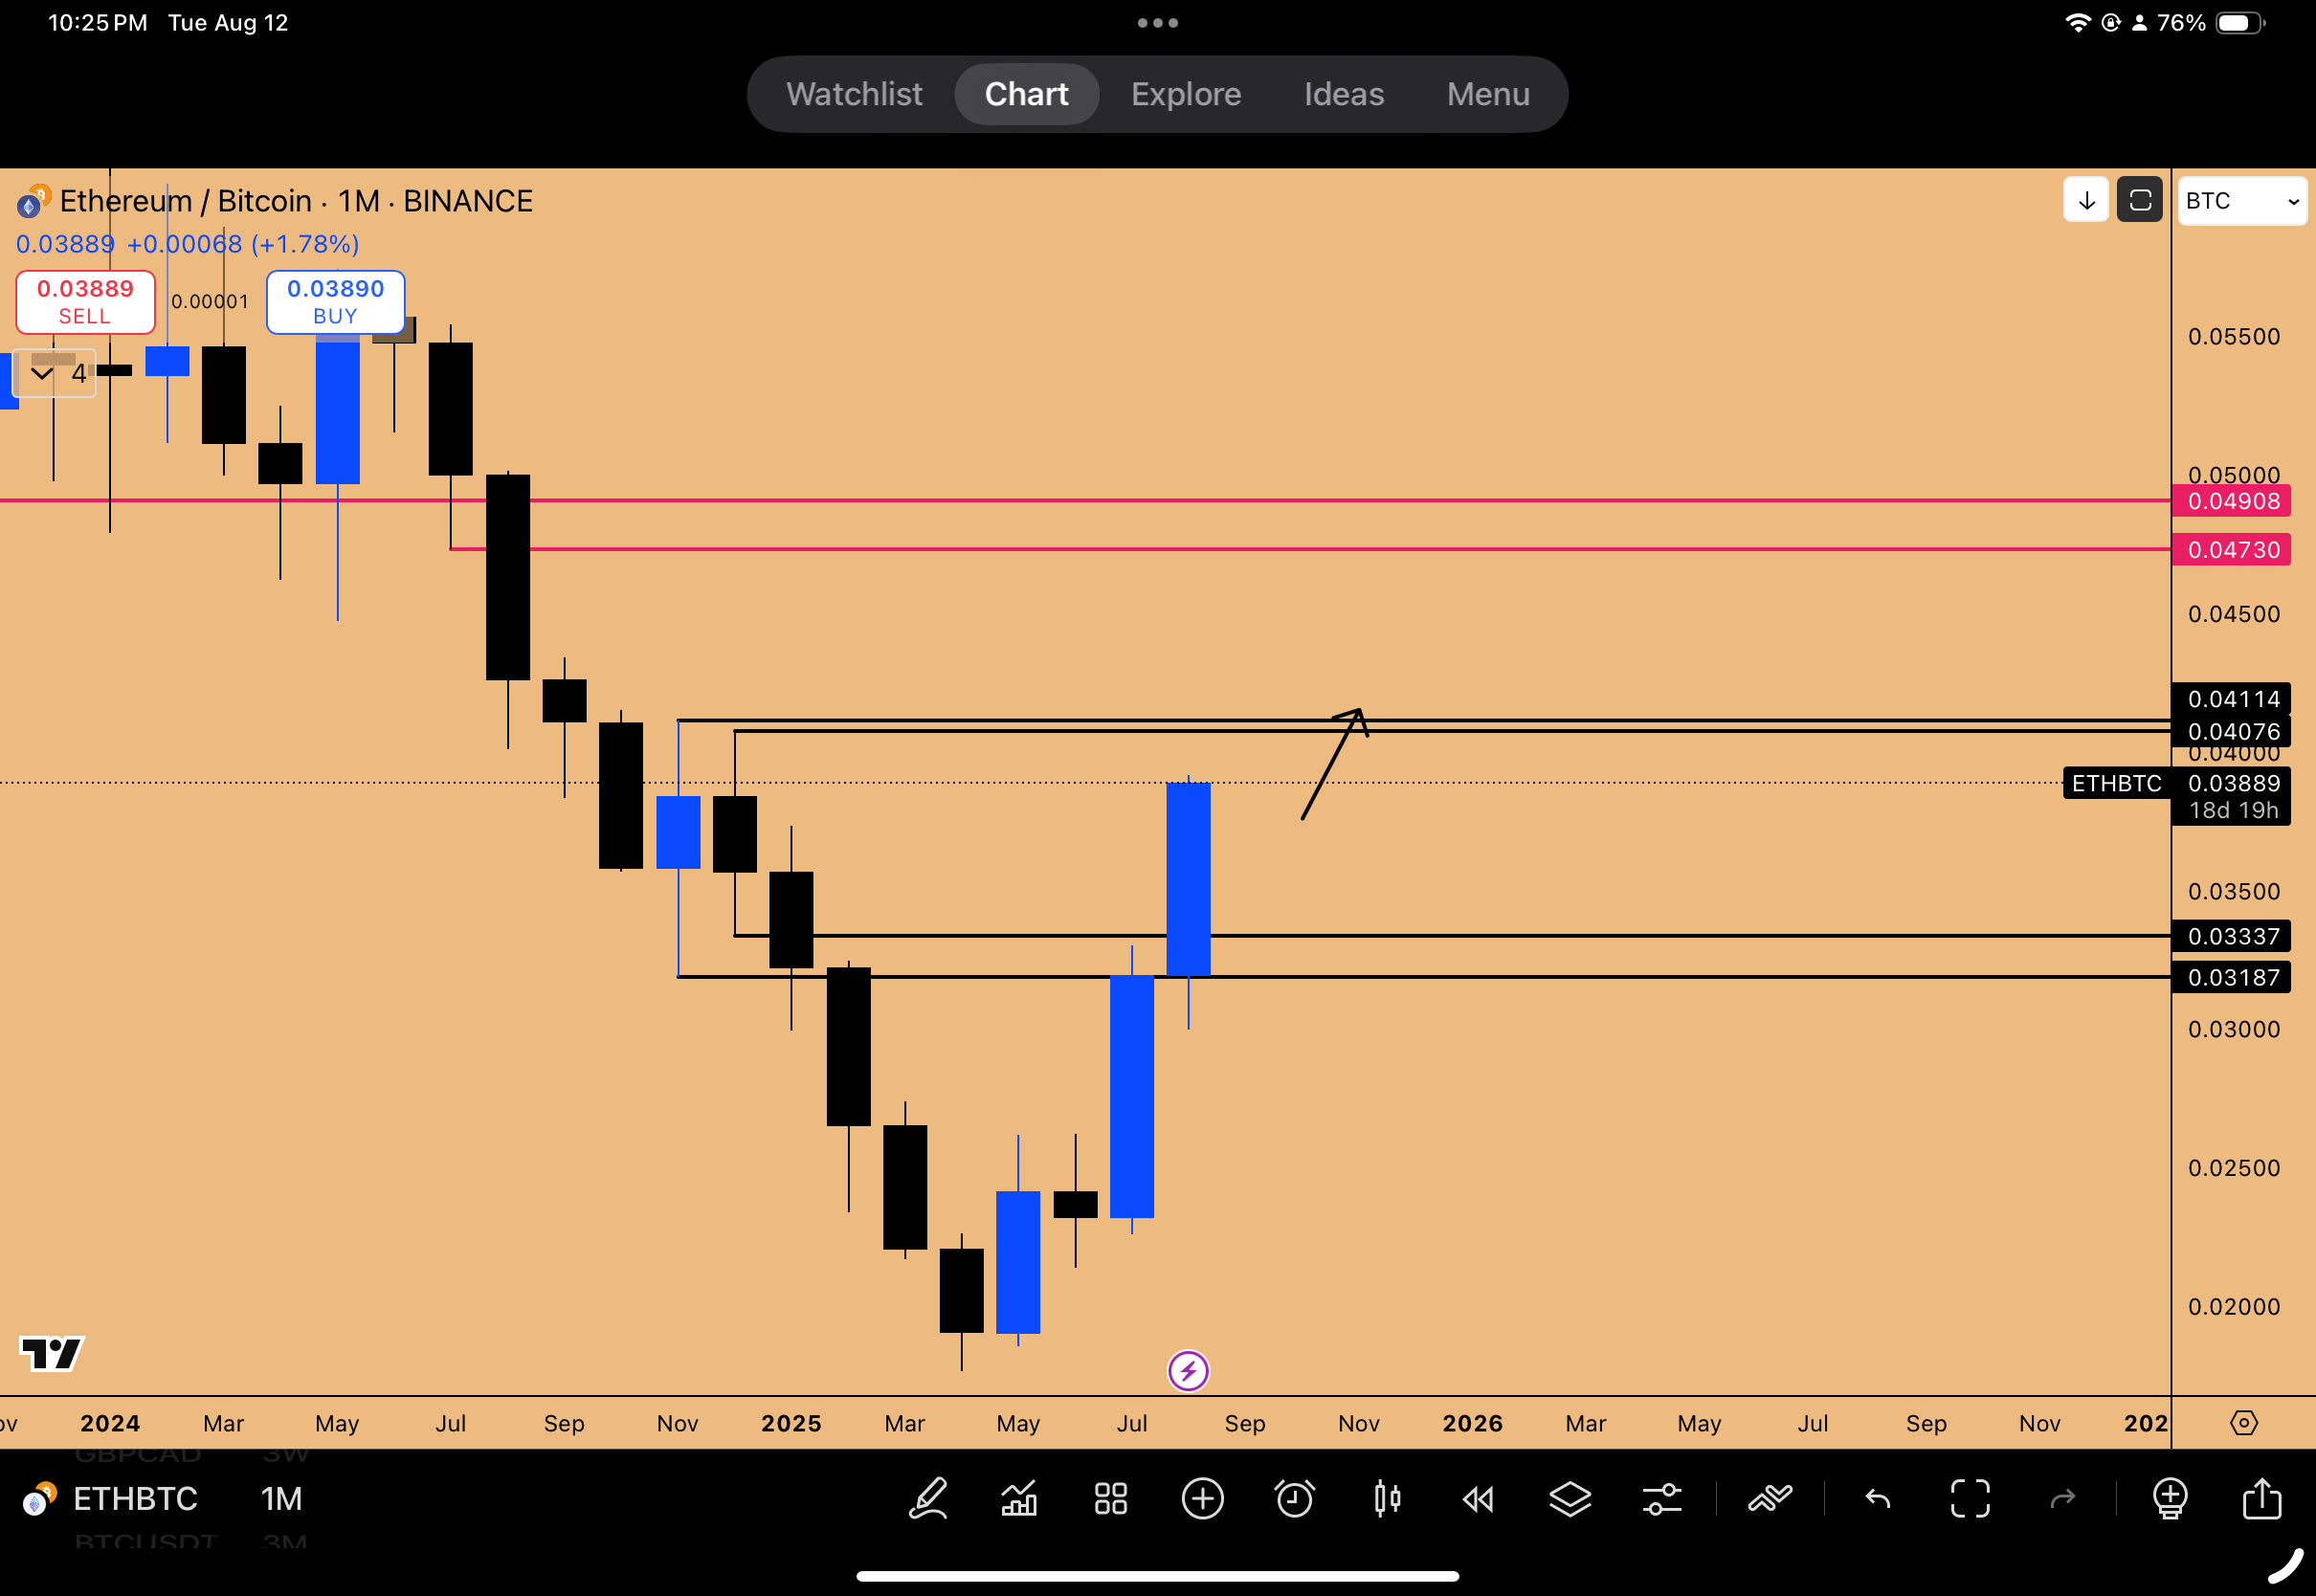
Chart 6: ETHBTC Inside Monthly Candle failure pattern in play with target
AI Narratives and Future Tech Outlook
The overarching narrative driving the current market rally is Artificial Intelligence (AI). Companies heavily involved in AI—Microsoft, Nvidia, AMD, AVGO, Google, Amazon—are the primary drivers taking the indices higher. This narrative is expected to significantly impact the future performance of key technology stocks, notably Tesla and Apple.
The Core Technical Pattern
The core pattern in play for Tesla is the inside quarterly candle failure. This suggests the draw on liquidity is to the upside, targeting all-time highs in the coming quarters. While this quarter is unlikely, a significant move is anticipated starting in October
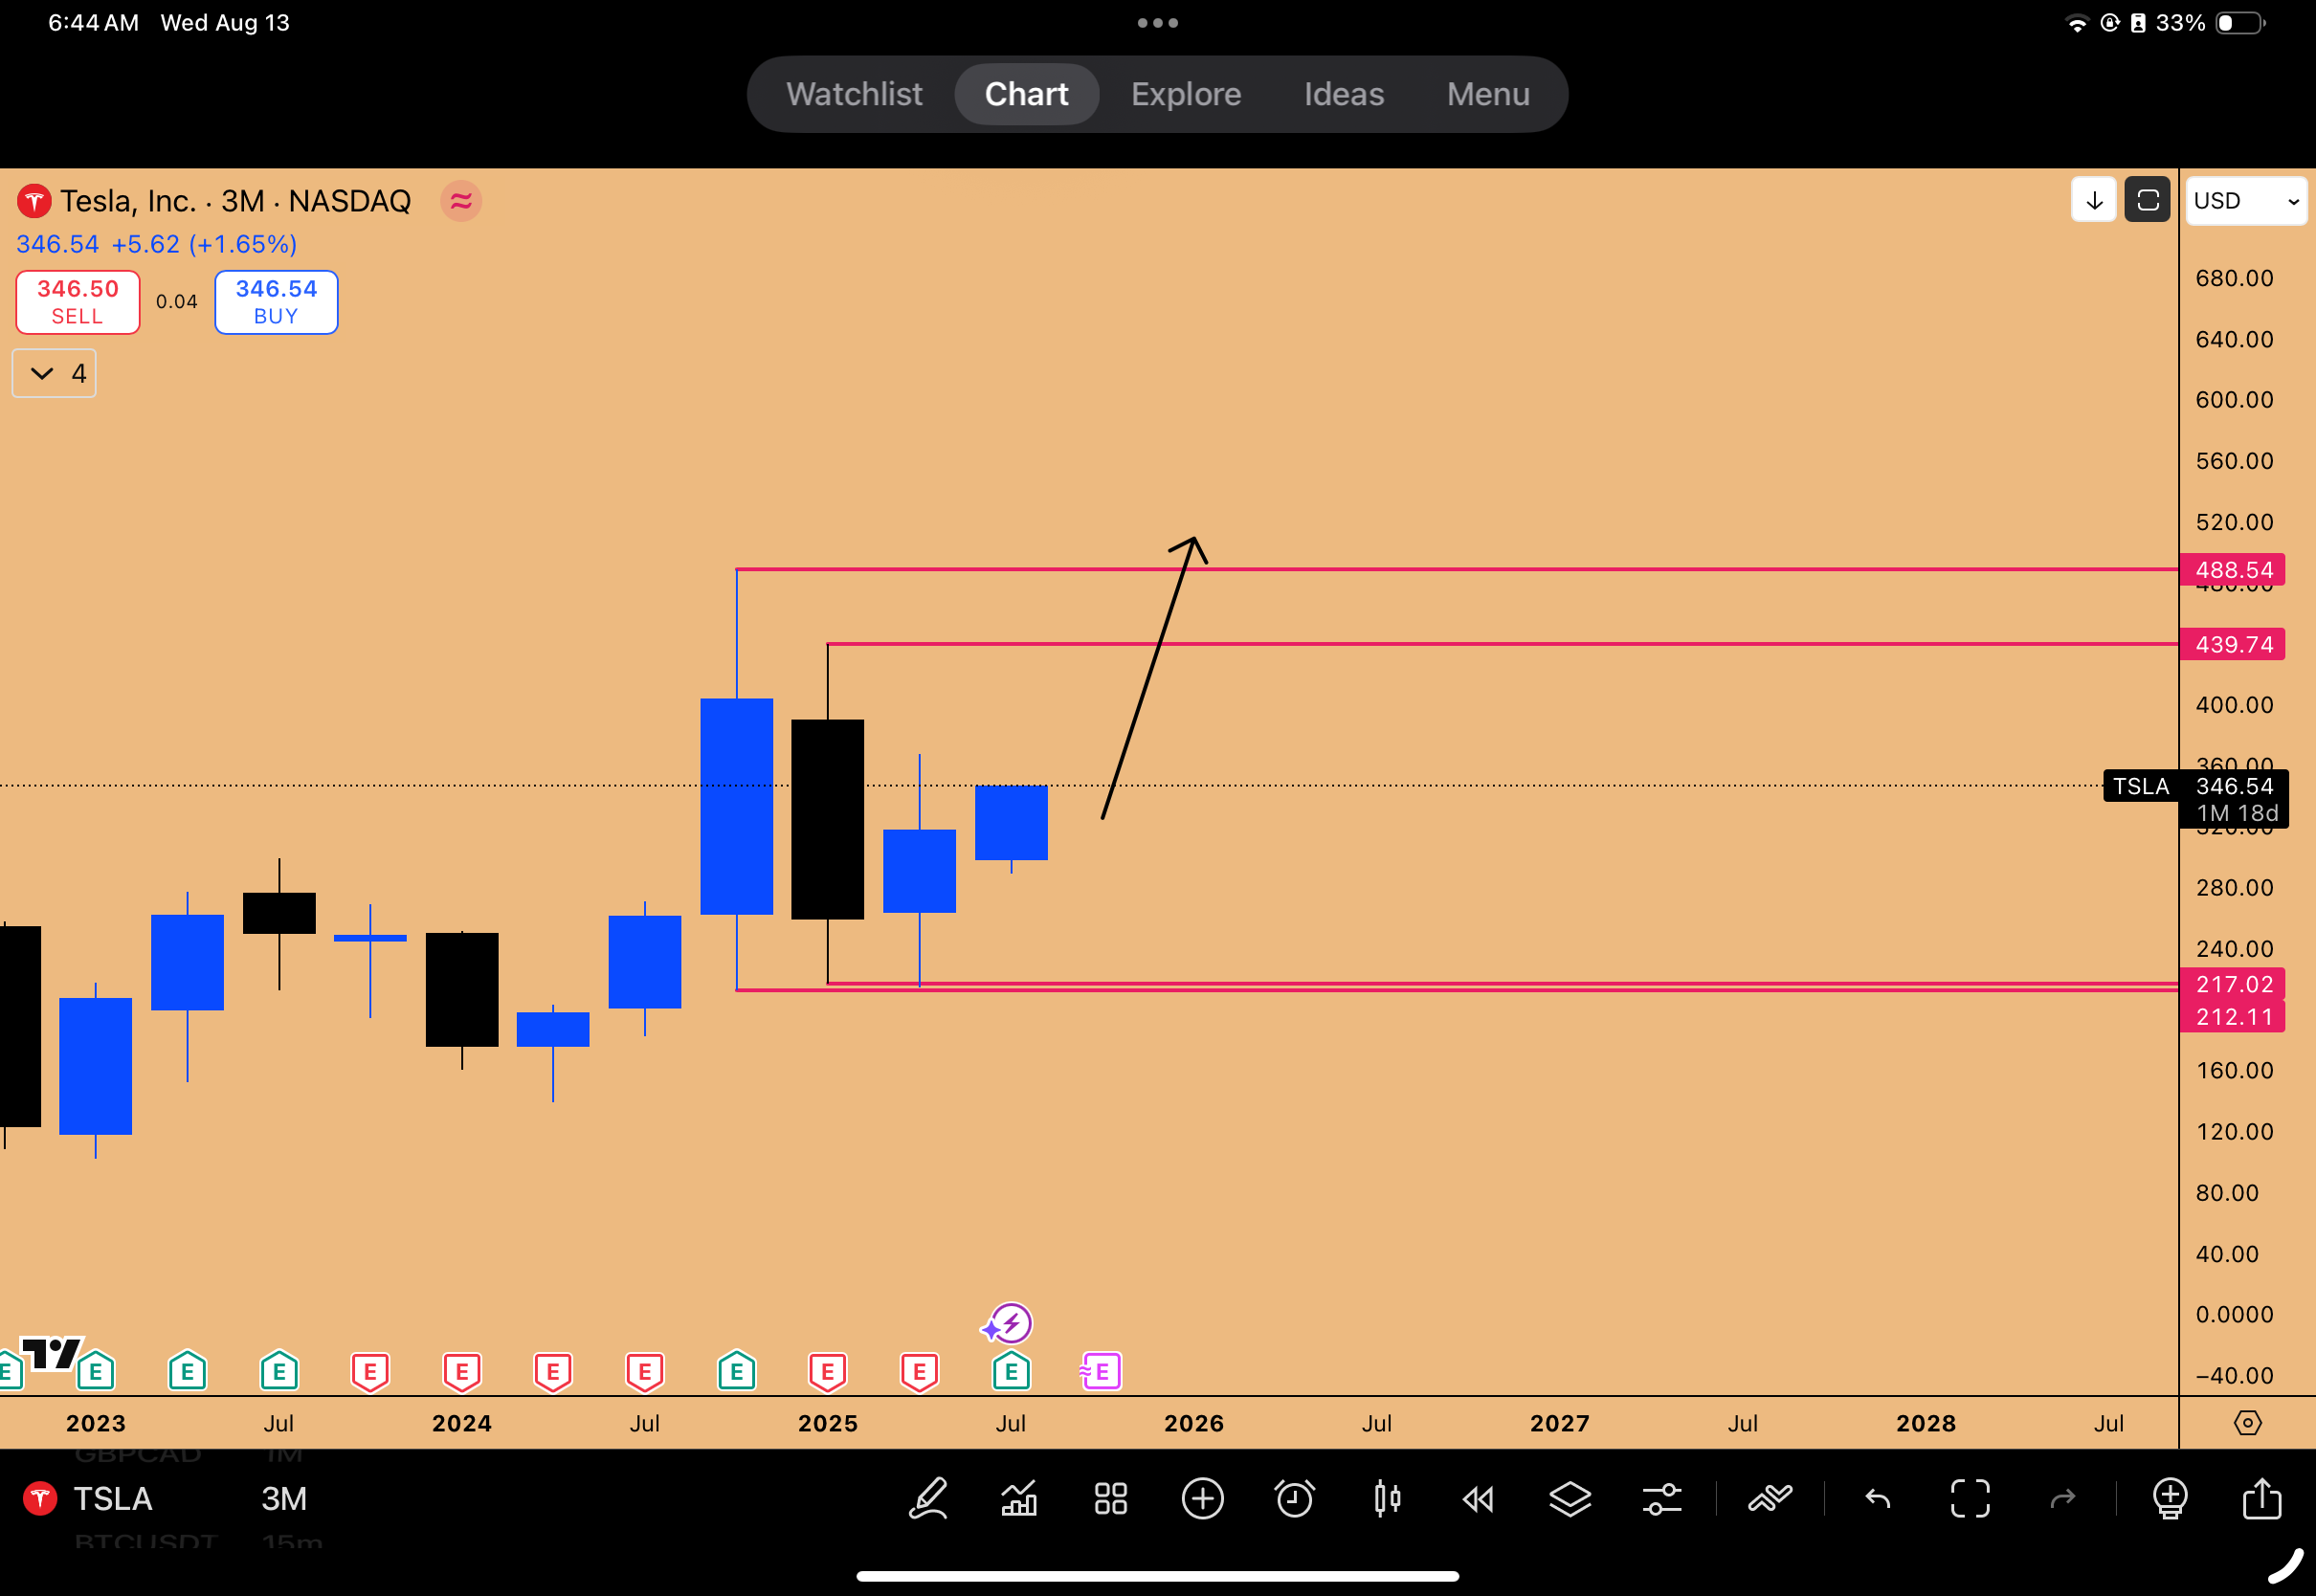
Chart 7: Inside Quarterly Candle Failure pattern in play
The AI Narrative and xAI Integration
Tesla is identified as the "OG AI company" due to its Full Self-Driving (FSD) technology, a fact somewhat forgotten by the market. The major catalyst expected to propel Tesla higher is the November shareholder vote to invest in xAI, another Elon Musk company powering up the novel Grok AI model.
“When Tesla is going to be doing the shareholder vote integrates some kind of features of xAI into Tesla for their cars that’s AI coming into Tesla.”
The integration of xAI's software capabilities, combined with Tesla's existing hardware expertise, is expected to cause a sharp increase in investment, similar to the revenue surges seen in Microsoft and Nvidia due to AI. xAI itself is innovating rapidly, with a standalone valuation reaching $100 billion.
Technicals and Sentiment: Positioning for 2026 Growth
Technically, Tesla is also exhibiting an inside two-month candle failure and is slowly rounding out. The expectation is that from October through February, Tesla should outperform nearly every other company.
Price Drives Sentiment
Market sentiment is heavily influenced by price action. Tesla has been hated over the past 2.5 years because the price was stagnant or declining, despite the company performing well.
“Price is the ultimate gauge for whether a company’s doing well or not... once price starts going higher sentiment starts going higher along with it.”
A recent shift occurred when the entire 2.5-year downtrend was obliterated in one massive monthly candle, attributed to Musk backing Trump. leading to a landslide victory during November, 2024 federal US elections. Following this vertical move, a correction and sideways consolidation occurred, which is normal.
Future Growth Catalysts (2026)
During this consolidation, Tesla continues to grow: expanding into new markets (new stores in India) and innovating. The revenue streams expected in 2026 from new products are anticipated to be insane and are not currently priced in:
Optimus robot lineup
Robotaxi rollout
Full implementation of FSD software
The integration of AI applications through xAI and other ventures is expected to highly enhance future revenue and manufacturing. “They’re positioned to become a $2 trillion company or $3 trillion company.”
Entry Strategy and Historical Parallels
The strategy involves navigating the potential volatility of September. “I’m waiting through September is because September could be that volatility keg which could take down the market.”
If September brings overall market weakness, it should be used as an opportunity to enter long positions in companies like Tesla and Apple. If Tesla sees a bearish monthly candle in September, taking out downside liquidity, it presents an ideal entry for the anticipated 2026 rally. The preference is to wait out September and re-evaluate in October.
Apple's Seasonal Strength
Apple (AAPL) is also positioned favorably for the year-end. It is currently creating a quarterly bullish order block. This signals that next quarter, opening in October 2025, Apple is expected to see an upside push to the all-time high.
Seasonality strongly favors Apple going into the year-end, as evidenced by historical rallies starting in October and January. If September sees a pullback in equities, Apple will likely come down to test the current S/R level for support at $216. This retest will be the area to enter long positions again.
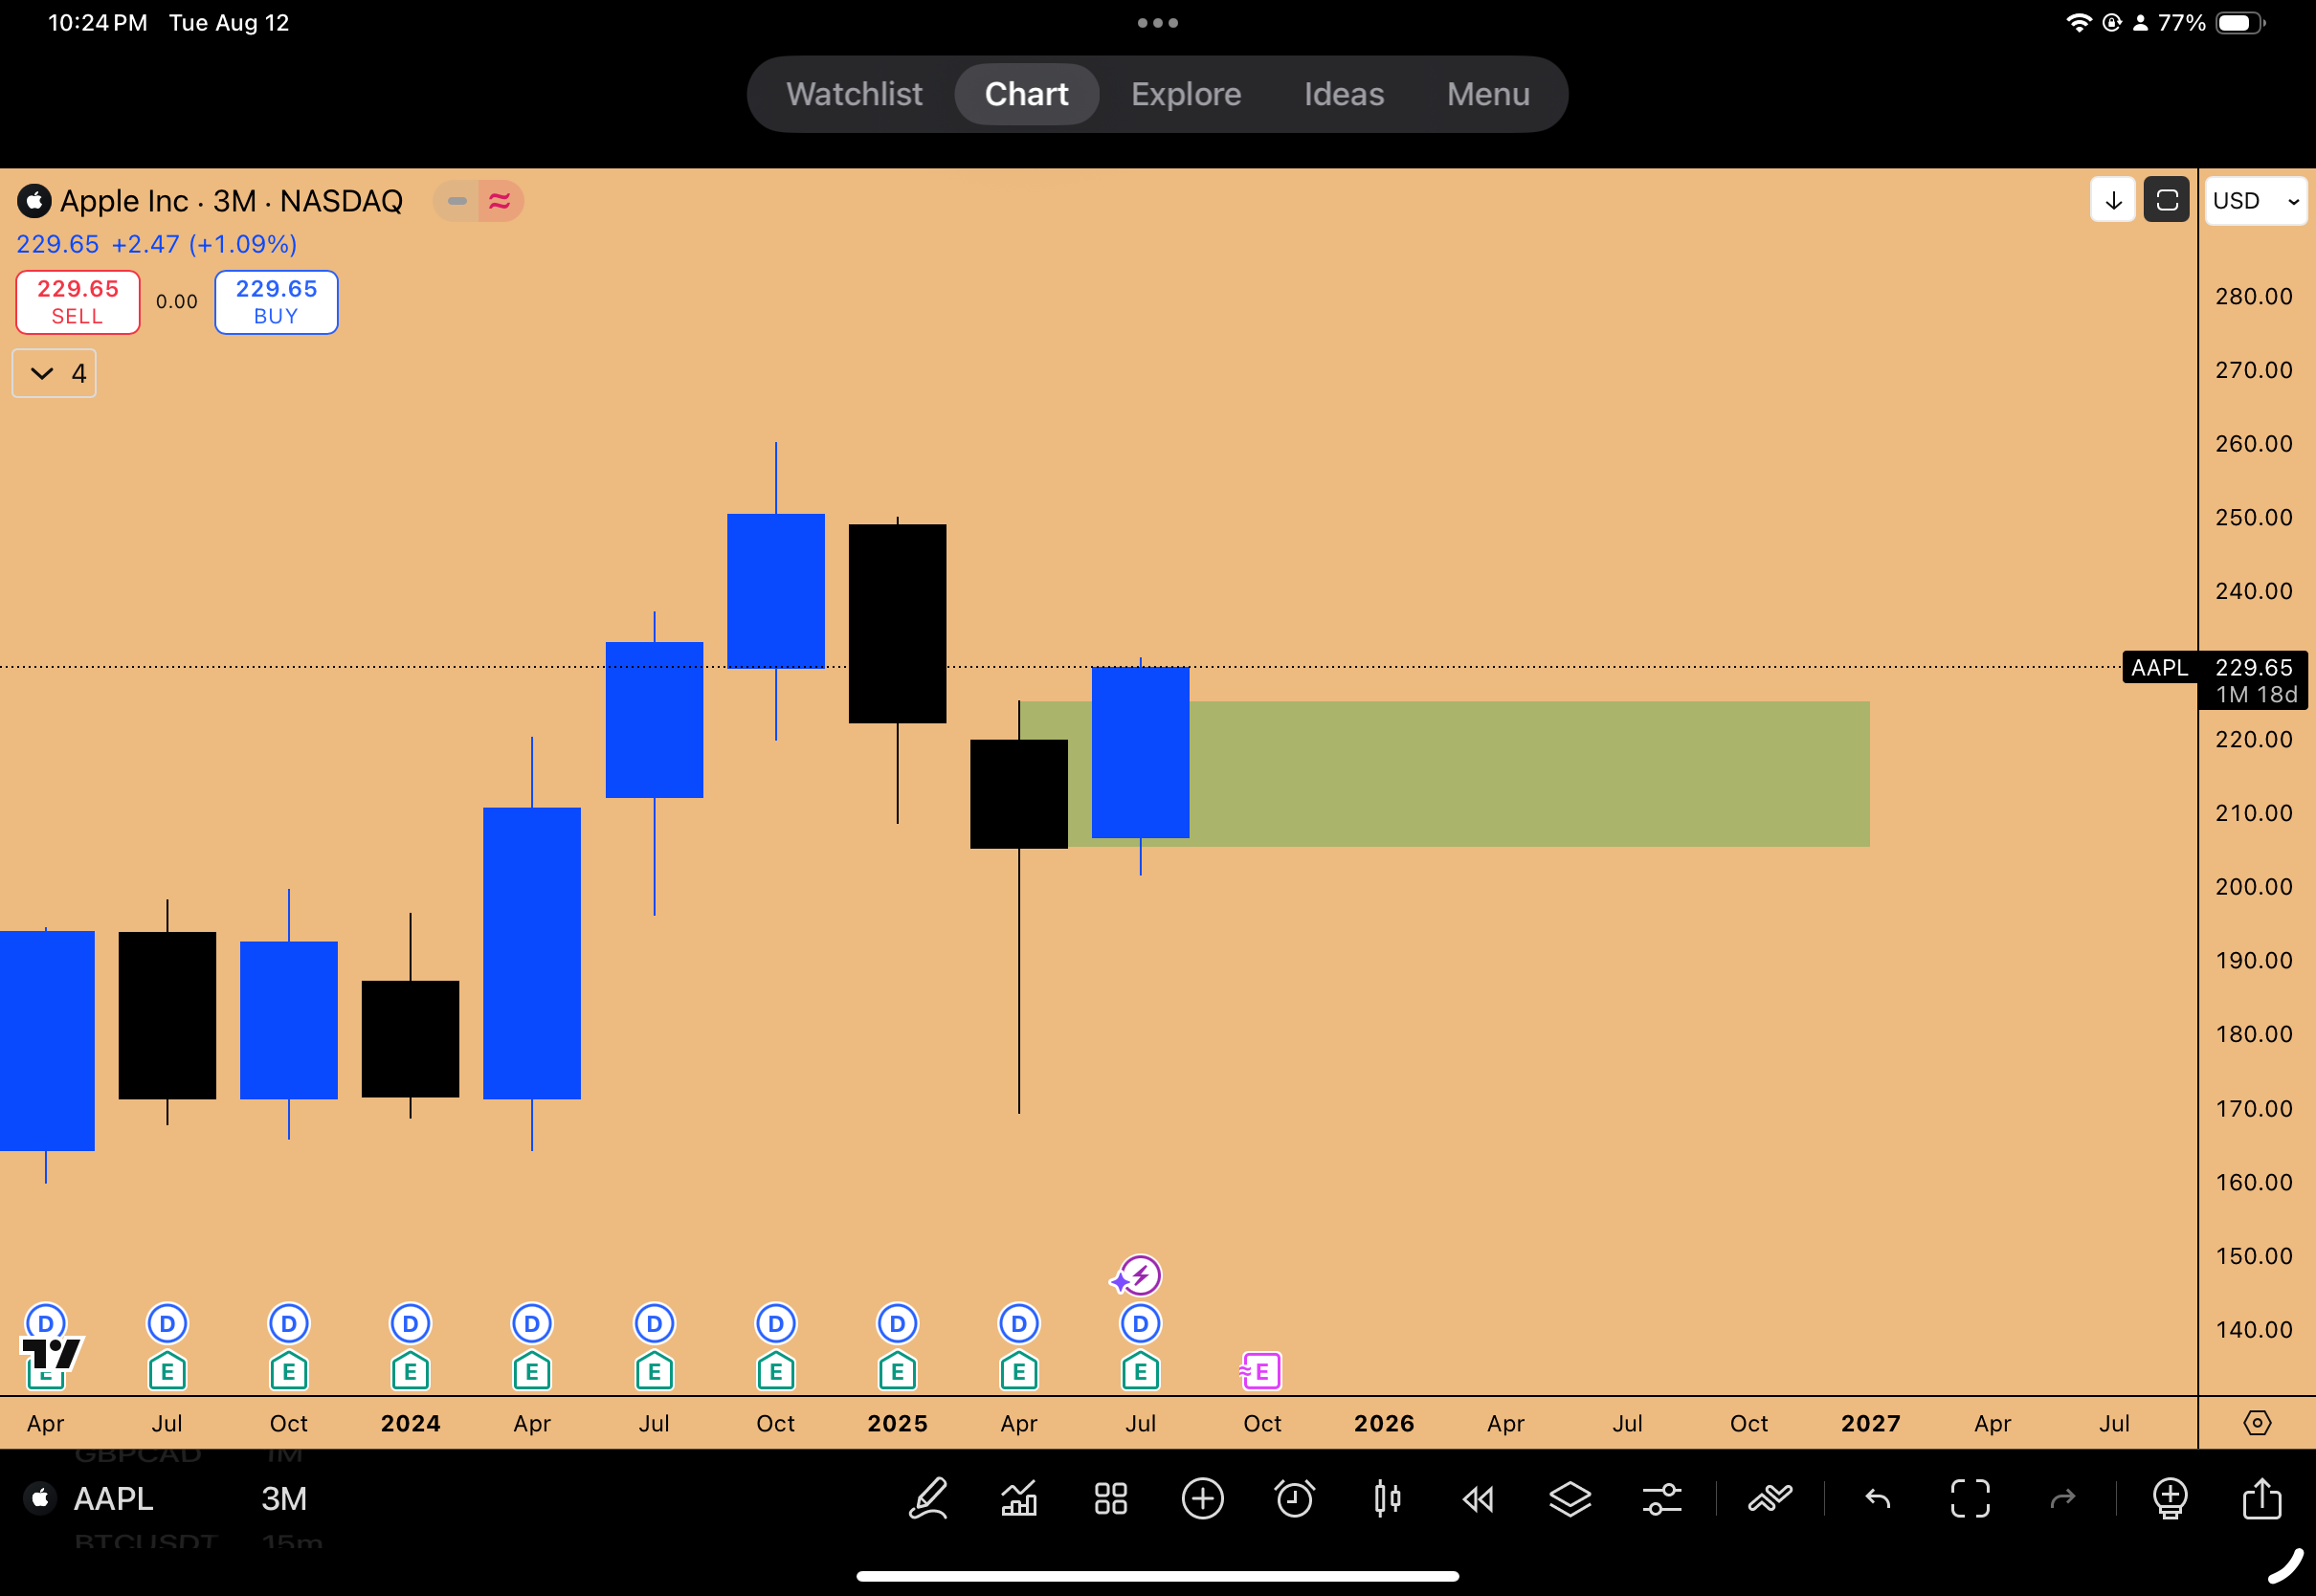
Chart 8: Quarterly Bullish Orderblock in formation for AAPL
Key Takeaways and Outlook
The current market environment is defined by critical divergences and rotational plays across asset classes. While the overall trend in major indices like the NASDAQ remains up, technical indicators and seasonal tendencies suggest caution is warranted as we approach September.
Key Insights and Actionable Strategies:
Equities Divergence: The US30 presents a compelling short opportunity based on a confirmed Market Structure Shift and an inside weekly failure pattern into resistance (4.68 R/R). Conversely, the NASDAQ, while extremely overbought (2-day RSI 75), requires a confirmed MSS before short positions can be entertained. The strategy is to focus shorts on the weakest index (US30).
September Seasonality: Historical data points to September as a seasonally weak month, often bringing 7-10% corrections. Portfolio strategy involves reducing long exposure (excluding Gold) and preparing to redeploy capital in October.
Gold's Bullish Consolidation: Gold is poised for a major breakout, supported by an ascending triangle, a double inside two-month candle, and a rare Rainbow Pattern on GLD. Despite high RSI readings, the consolidation suggests targets of 3600 and potentially higher towards 4000.
FX Dynamics: Euro strength persists against the Dollar, driven by an inside two-week failure and US administrative policy favoring a lower dollar. The 1.19-1.21 zone remains the upside target before a potential macro lower high forms.
Crypto Rotation: Capital is actively rotating from a consolidating Bitcoin into Ethereum, which is showing unprecedented strength. This favors altcoin performance in the near term. Key Ethereum support lies at 3700-3860.
AI Narrative and Tesla: The AI narrative continues to dominate. Tesla is identified as a major long-term beneficiary, with the November xAI integration vote acting as a key catalyst. Utilizing potential September weakness to position for a strong Q4 move in TSLA and AAPL is the preferred strategy.
As we move deeper into Q3, monitoring the Market Structure Shifts in equities and the resolution of the consolidation patterns in Gold and Crypto will be crucial. What's your take on the US30 short setup and Gold's Rainbow pattern? Share your thoughts in the comments—let's discuss strategies. Subscribe for more market breakdowns!
Disclaimer: This isn't financial advice – just market musings from the charts. Always do your own research.
If you enjoyed this deep dive, please share it with fellow traders!