

Market Tipping Points: Bitcoin's Bearish Signals, Gold's Super Cycle, and Critical NASDAQ Divergences

📝 Executive Summary
In the latest edition of our weekly analysis, we focus exclusively on the three assets poised to dictate money flows across the entire market in the coming months: Bitcoin, Gold, and the NASDAQ. This analysis reveals critical high-time-frame signals suggesting significant shifts, particularly as we enter September, historically one of the weakest months for risk-on assets. The recent monthly candle closes have provided crucial insights, signaling potential exhaustion in equities and Bitcoin, while simultaneously confirming an explosive breakout in precious metals.
Bitcoin (BTC) is flashing major warning signs for the first time in a long time. The monthly close confirmed an Inside 1-Month Candle Failure and an Inside 2-Week Candle Failure, patterns identical to those seen at the October 2021 market top. Furthermore, a 2-Month SFP (Swing Failure Pattern) suggests exhaustion in the uptrend. Historically, similar patterns, such as the March 2024 SFP, led to a significant 33% drawdown and several months of sideways-to-down action before expansion resumed in September 2024. The bias for the next few months is decidedly downside, targeting liquidity pools at $98,200, $93,377, and potentially an open gap (a "flat open") near $85,000. Bitcoin has historically led the market, and its current topping signal strongly implies the NASDAQ will follow suit.
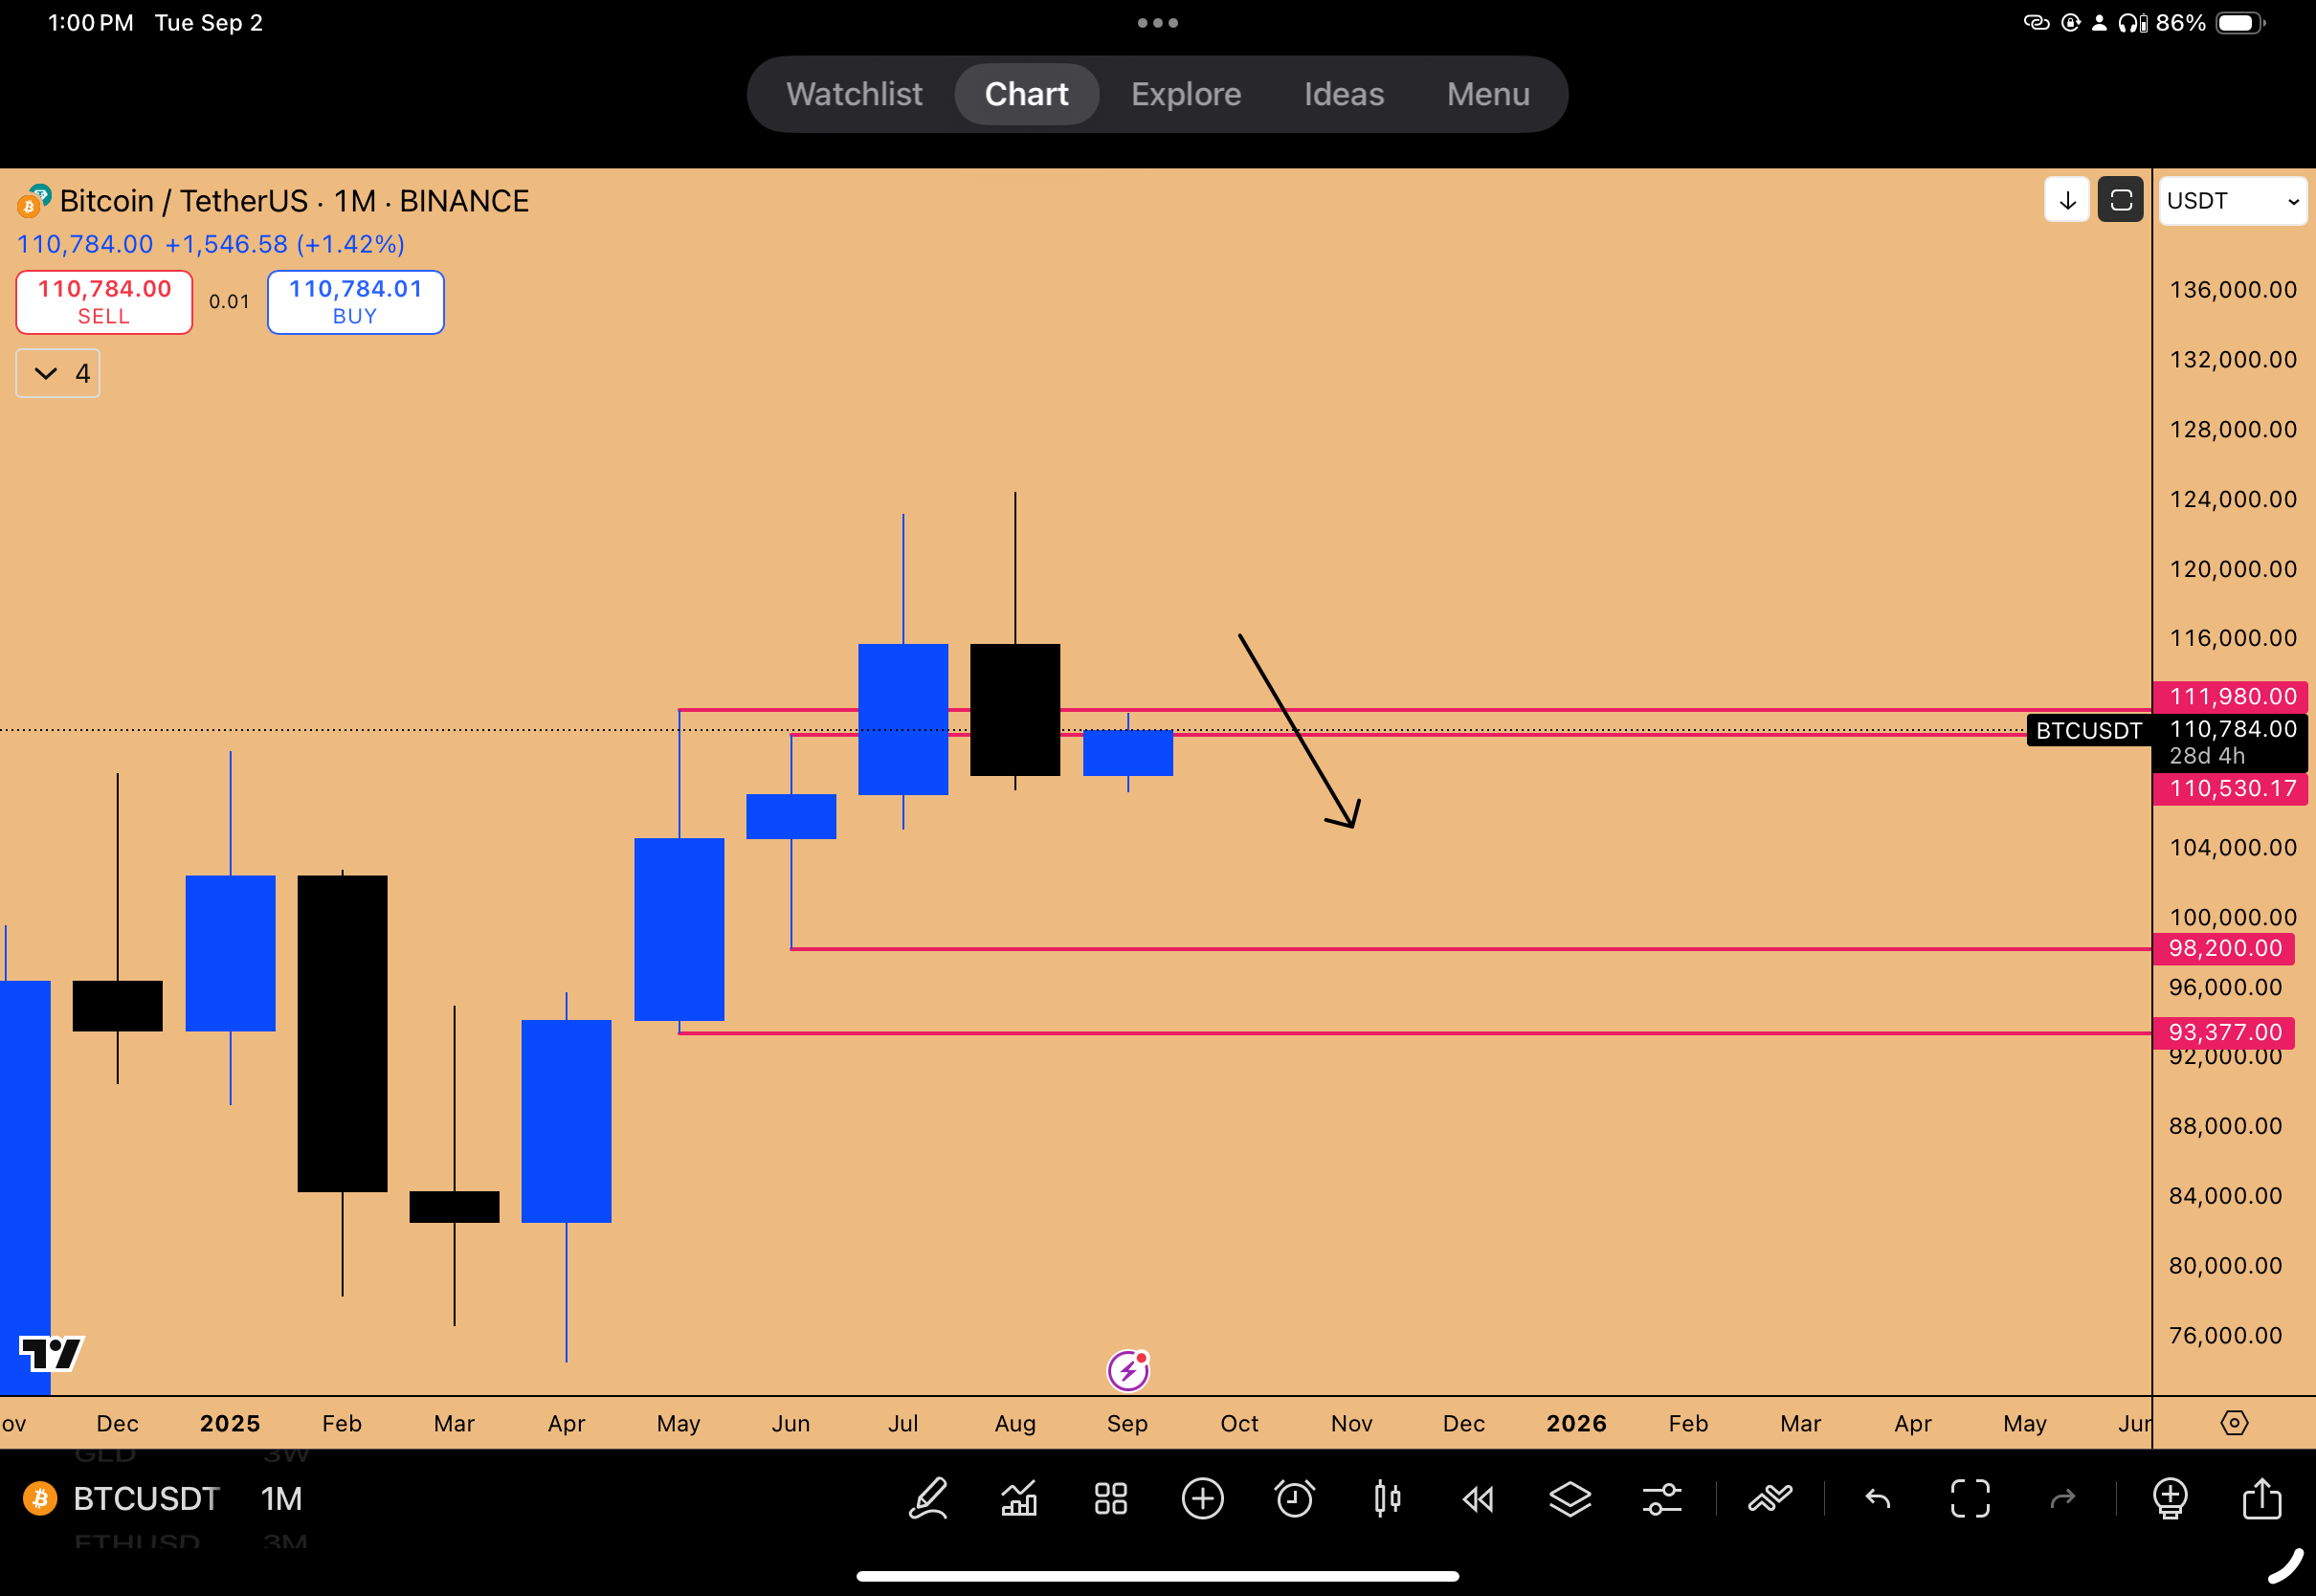
Figure 1: Bitcoin Weakness projected going into September-October
In contrast, Gold (XAU) is exhibiting incredibly bullish behavior, driven by inflation risks and geopolitical uncertainty. Gold Miners (GDX) had their “best month ever” in August, rallying 21% while Bitcoin fell 12%. Gold has broken out of a 130-to-185-day consolidation zone, suggesting an explosive run is imminent. Despite an extremely overbought Monthly RSI of 86.52, price action remains primary, indicating the asset is entering a "bubble" phase where overbought conditions persist and intensify. The next target is the R3 yearly pivot at $3,754. We are entering the "endgame" for this super cycle, reminiscent of the 2001-2011 run where the 8-month RSI reached 96 (currently at 84).
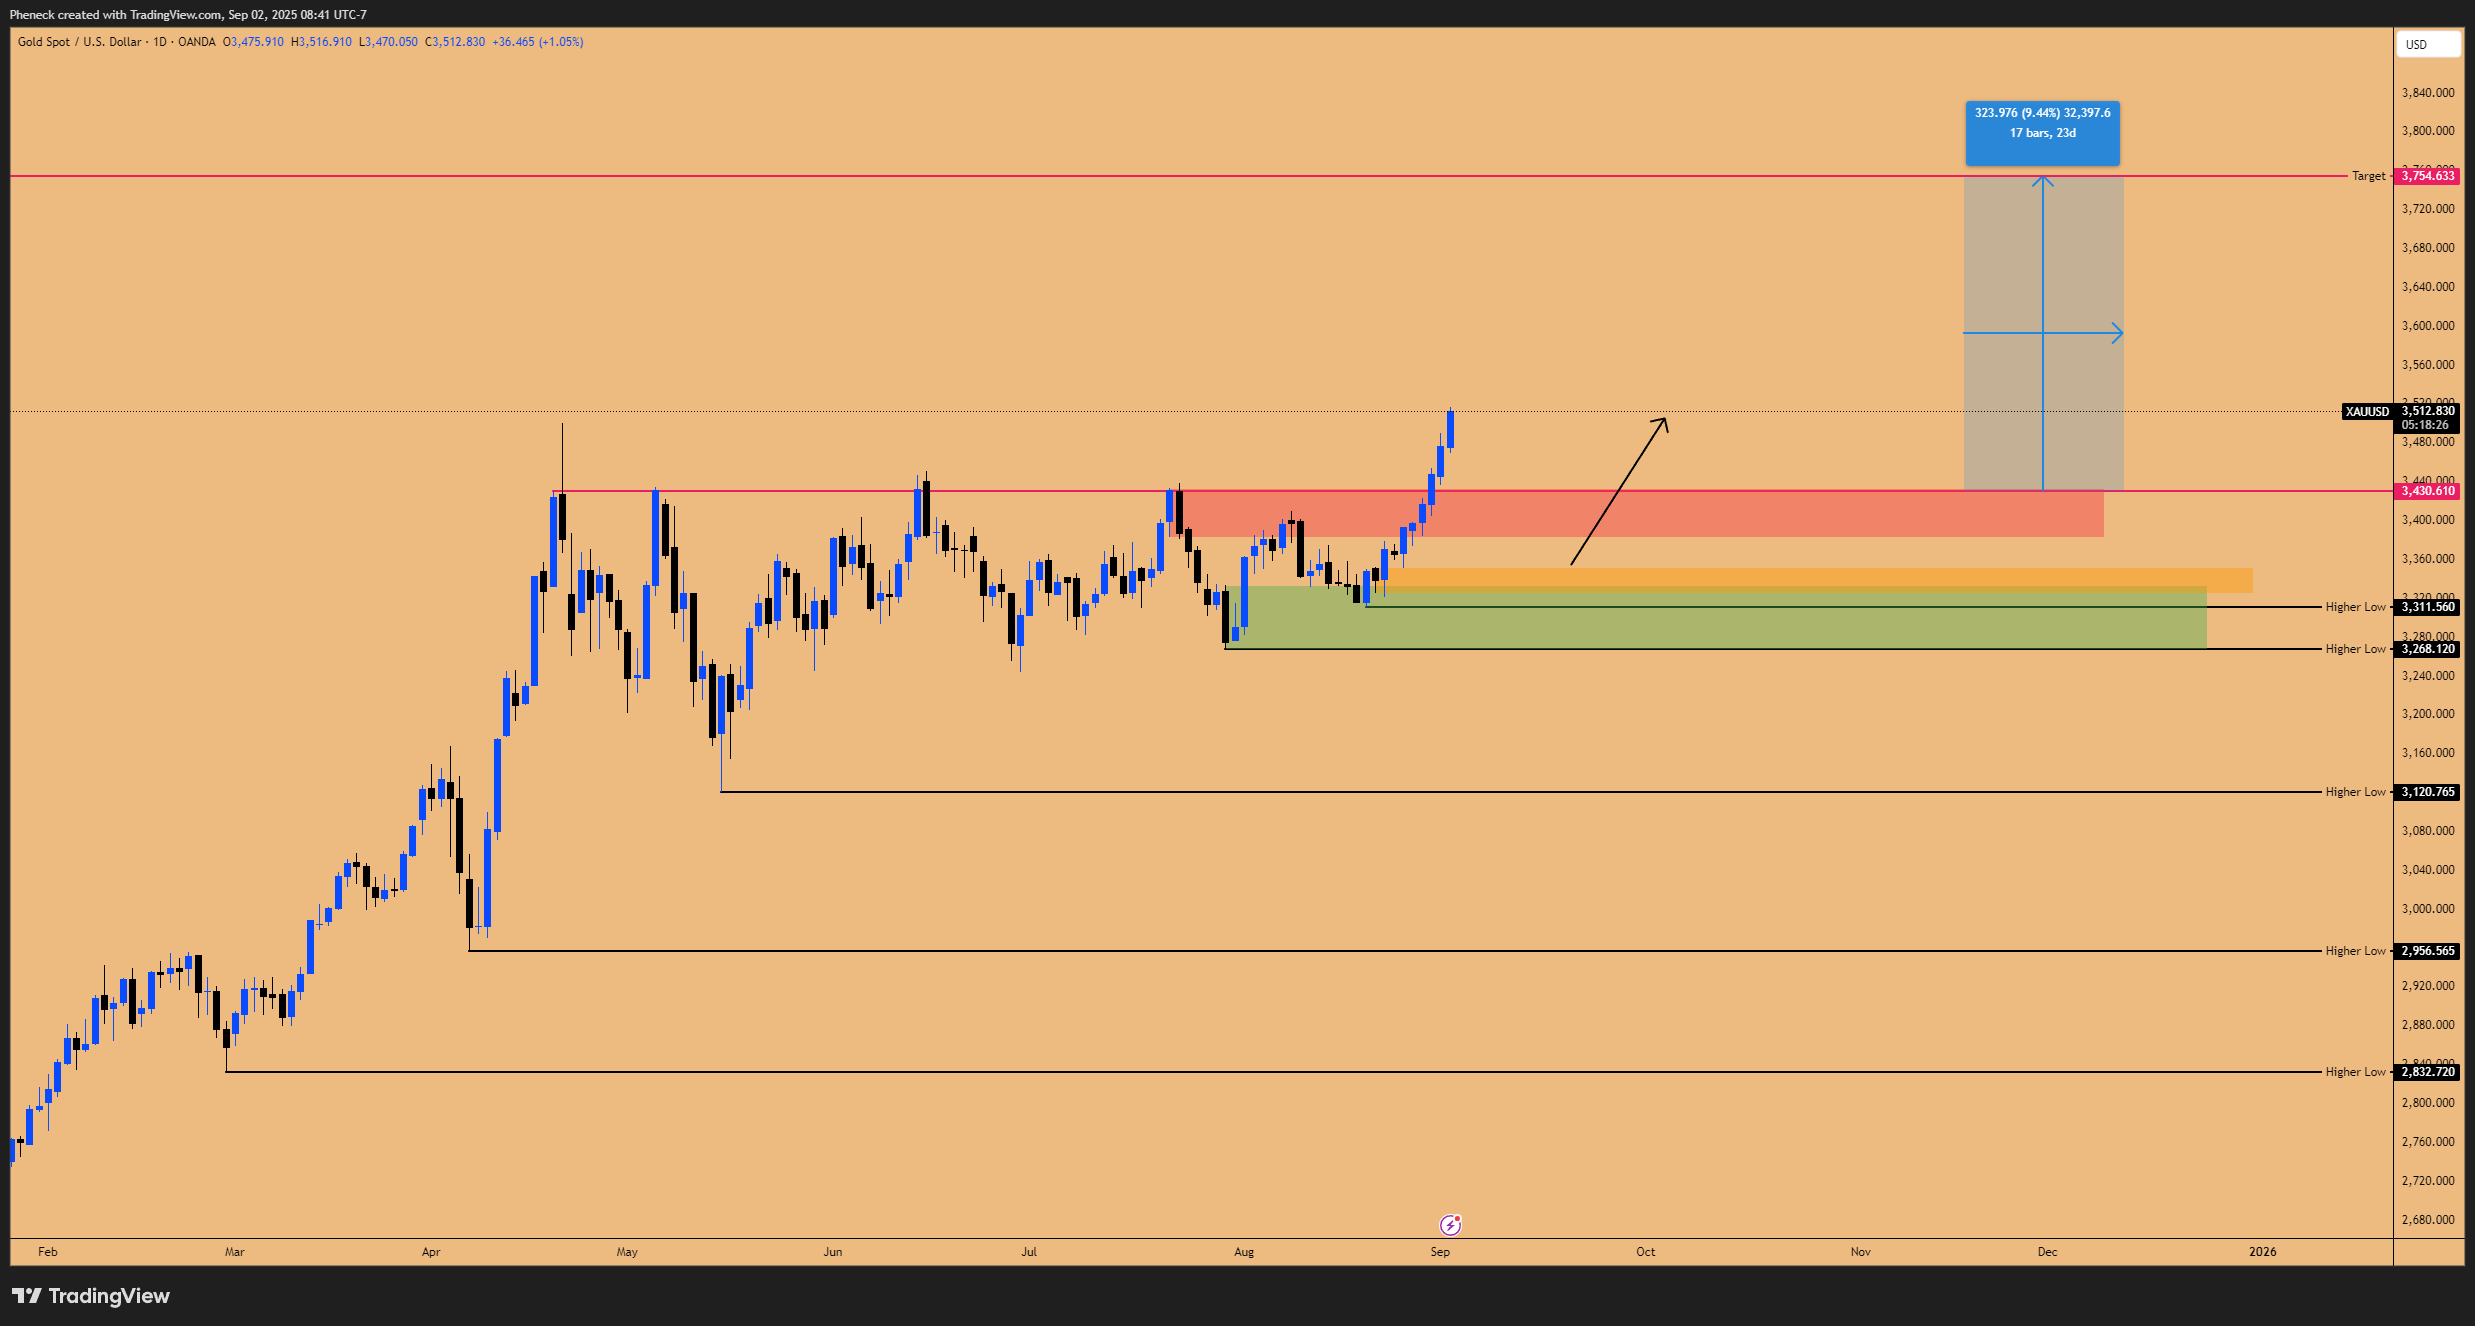
Figure 2: Gold Breakout in progress, Further upside is warranted
The NASDAQ (NDX) is showing concerning divergences. While Bitcoin has already turned down, the NASDAQ has lagged but is printing critical topping formations. A significant divergence is present: the NASDAQ is forming a lower high while the S&P 500 is forming a higher high. This raises “alarm bells”, as this signal often precedes major tops, as seen before the 2018 crash (which led to an 8% drop in 6 days) and the February 2025 correction. Weakness in key components like Microsoft, which printed a bearish monthly candle, suggests the index's recent strength, largely supported by Nvidia alone, is unsustainable. Furthermore, the Japanese Stock Index Nikkei, a global barometer for risk appetite driven by the Yen carry trade, has printed a monthly SFP, warning of a potential pullback in global equities.
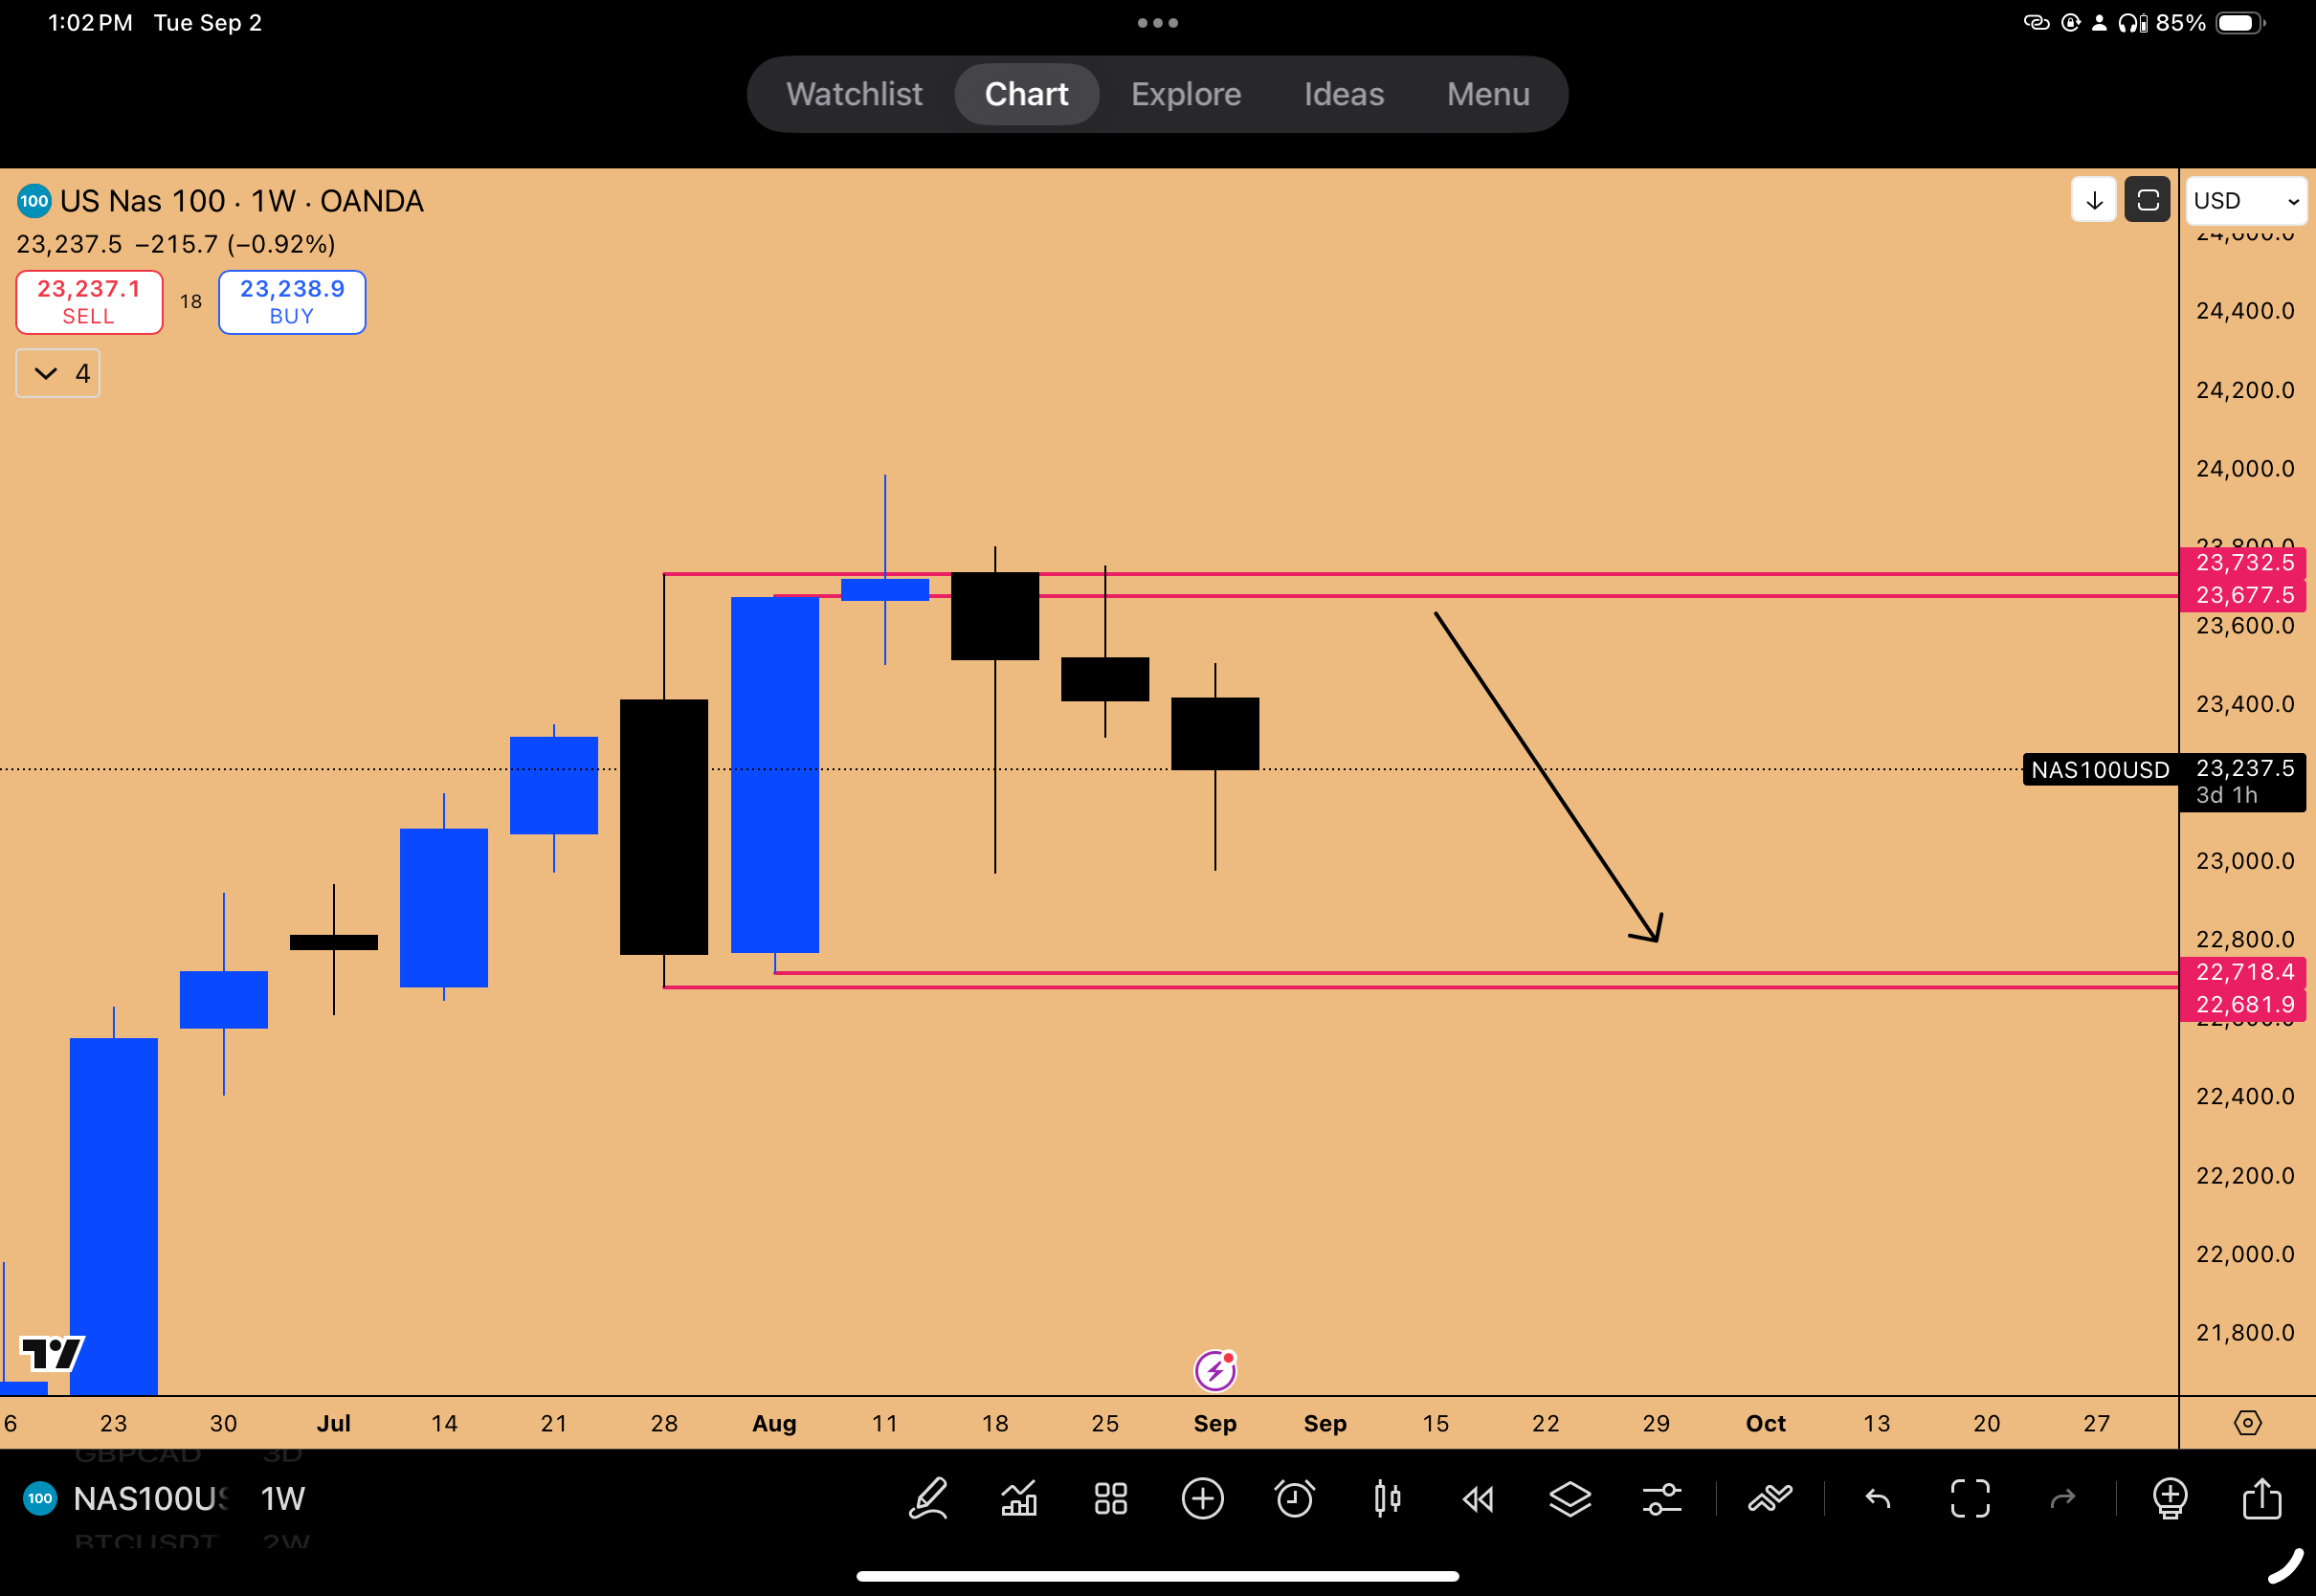
Figure 3: Inside Weekly Candle Failure on NAS100 suggesting downside till 22,718
Crucially, the macro environment remains supportive long-term. Unlike 2021, where interest rates hiked from 0% to 5%, we are now entering an easing cycle, with rates expected to drop from 4% to 2%. This, combined with massive liquidity injections (including a $45 trillion government spending bill, treasury issuance, and tariff revenue), suggests any downturn will be a correction within a larger bull market—a "buy the dip" opportunity driven by asset inflation, rather than the start of a prolonged bear market.
Key Takeaways:
Bitcoin: High-time-frame bearish signals (Inside Candle Failures, 2-Month SFP) suggest immediate downside risk. Target: $85k-$98k. Hedging via IBIT or MSTR puts is advised.
Gold: Explosive breakout from 130+ day consolidation. Entering a super cycle blowoff phase. Target: $3,754.
NASDAQ: Major SMT divergences with S&P 500 and weakness in the Nikkei signal a likely top. Downside support near 22,245.
Macro: Long-term bullish due to liquidity and rate cuts; short-term corrections are buying opportunities within the ongoing "bubble."
🔻 Bitcoin's Tipping Point: High Time Frame Bearish Signals
We just closed the monthly candle on Bitcoin, and the result is interesting but certainly “not good for bulls.” For the first time in a long time, Bitcoin is presenting significant bearish signals on the high time frames. The last time a similar high-timeframe bearish signal (a monthly SFP) was witnessed, it necessitated caution. Understanding these technical structures provides a massive edge, allowing traders to exit the market or de-risk well ahead of significant turns in market structure.
The Anatomy of the Reversal: Inside Candle Failures
The current structure mirrors the patterns observed at the top of October 2021. At that time, the market had taken the all-time high and printed an Inside 2-Week Candle Failure—taking out the highs, rejecting, and coming down. This structure should alert traders to exit the market; holding longs when this pattern appears is ill-advised.
In our current case, we have the exact same pattern holding. We just experienced an Inside 2-Week Candle Failure, accompanied by a short trigger in the form of a bearish order block forming on the daily chart. The reaction to this pattern formation should be clear: “You should not be long period. Close everything. Should not be long at all. This is a bearish pattern and you need to be out of the market.”
A week later, this bearish pattern has been playing out, resulting in a significant drop—a 13% drawdown, equating to a $17,000 drop on Bitcoin from the top. While a long position was attempted based on a previous SR level tap, the close below the SR level necessitated closing the position for a small loss (from 110,530 down to 109,700), avoiding the major drawdown.
The Inside One-Month Candle Failure Explained
Crucially, this recent price action, similar to the October 2021 top, is also confirming an Inside 1-Month Candle Failure. It is a common misconception that a bar failure only occurs if an SFP forms and the mother candle closes as a failure. This is not true in its full entirety.
If the next candle does not see any follow-through to the upside and actually comes down and closes within the range of the inside monthly candle, the entire move up and down must be considered a fakeout. This confirmed fakeout information suggests the Inside Monthly Candle Failure is valid and active.
The Two-Month SFP and Historical Drawdowns
Further emphasizing the bearish outlook, the recent close of the two-month candle reveals the formation of a Two-Month SFP (Swing Failure Pattern). This candle structure is a pin bar, suggesting exhaustion in the upside trend. When something like this prints, traders need to be on the sidelines.
To understand the potential implications, we look at the last time a significant Two-Month SFP was printed, back in March 2024.
March 2024 Example: The next two-month candle following the SFP did not immediately go lower. It attempted to rally, forming a lower high in comparison to the all-time high just printed, and then rejected, essentially confirming the subsequent candle as an SFP as well.
The Aftermath: The market faced a significant drawdown from top to bottom—a 33% drawdown. From March 2024 until the end of July 2024, the market essentially went sideways to down. It took at least three two-month candles of this price action before the market started expanding higher again in September 2024.
In our particular case, we must be careful. This SFP formation suggests the next two-month candle should not provide any follow-through to the upside. This technical outlook is compounded by seasonality, as September is traditionally one of the weakest months for risk-on assets, specifically the NASDAQ and the S&P 500. If these indices suffer headwinds, Bitcoin will inevitably suffer as well.
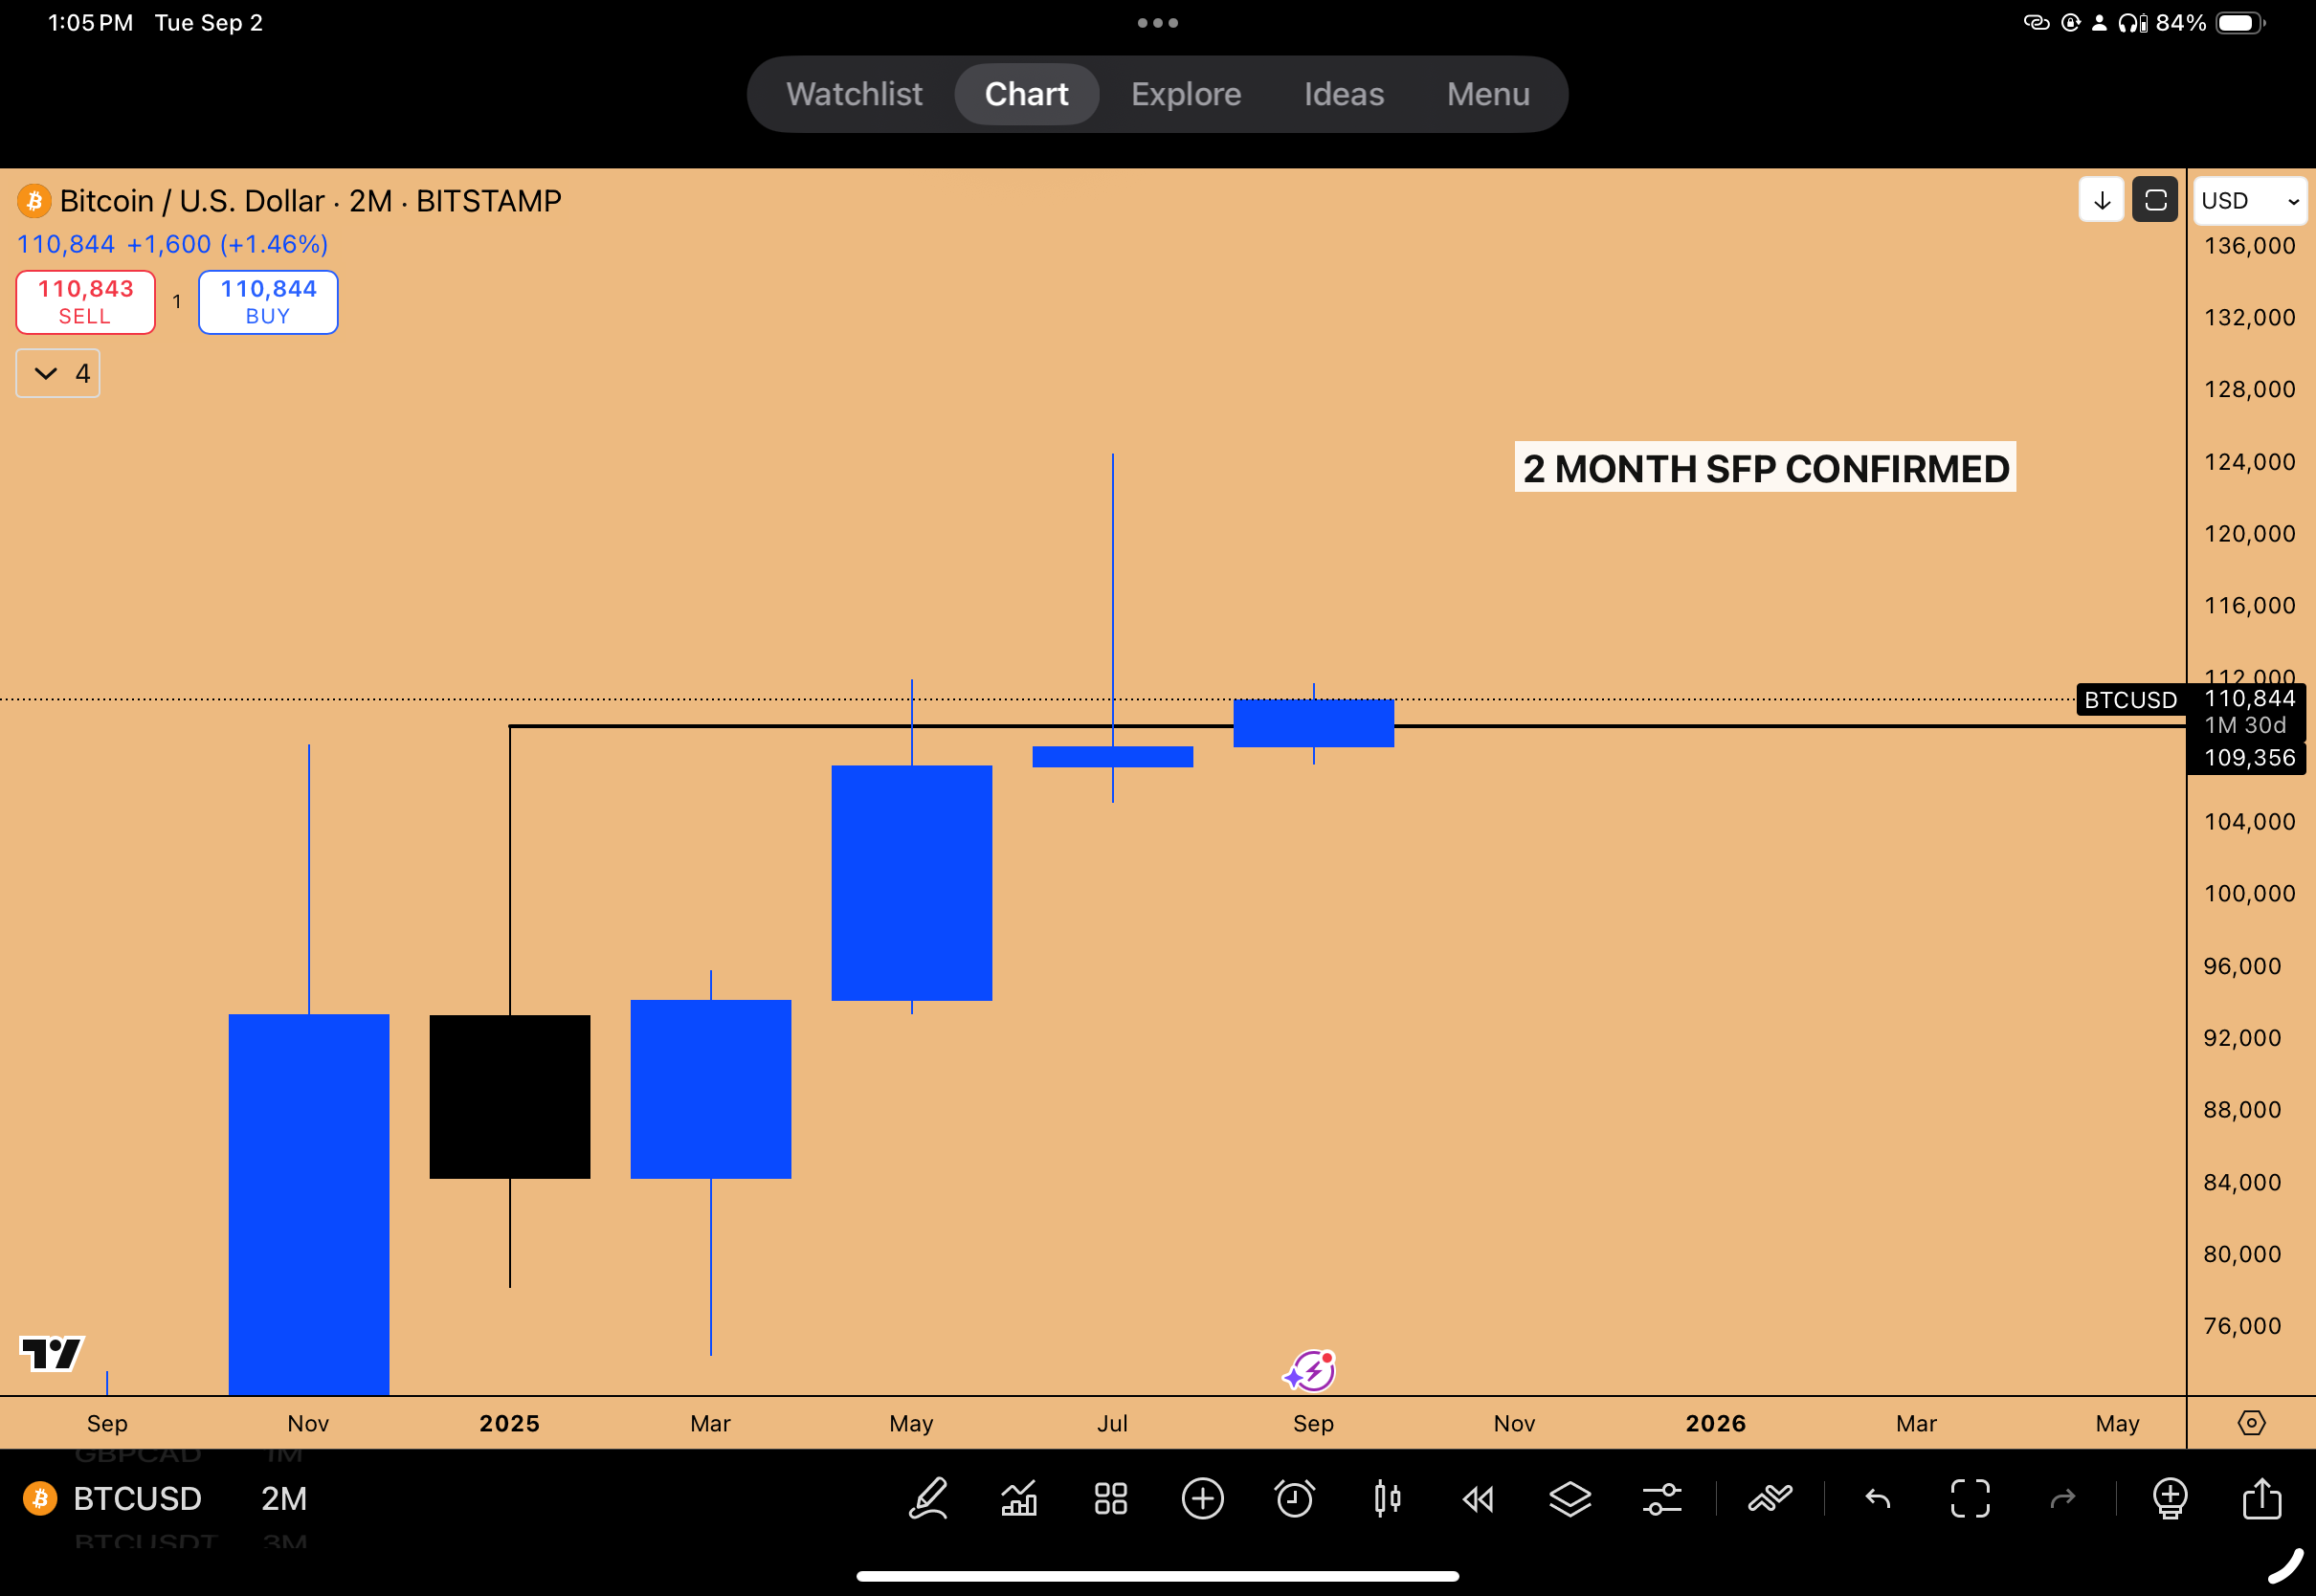
Figure 4: 2-month SFP confirmed on BTCUSD
Liquidity Targets and the Monthly Open Strategy
With the Inside Monthly Candle Failure confirmed, the draw on liquidity is now to the downside. The key targets based on this pattern are the liquidity pools sitting at $98,200 and $93,377. Traders who attempted to long the market above the $110,530 and $111,98 swing highs are currently underwater and facing losses.
Furthermore, a persistent structural inefficiency has been noted: a flat open sitting on multiple exchanges around $85,000 (an area where there is no wick). This area also contains an open gap, visible on the cash index proxy (IVIP). The time may be coming for the market to move lower and sort this thing out. If Bitcoin comes down to this $85k region, it represents a key area to entertain spot long positions, as higher time frame inefficiencies will have been filled, setting the stage for the next year and a half rally. The immediate strategy is to be hands-off and let the drawdown unfold, at least in September.
Navigating September: The Monthly Open Strategy
Given the downside bias, navigating the month of September requires utilizing the Monthly Open Strategy (detailed in the Substack newsletter Riding The 2025 Market Meltup). This is particularly critical as the new monthly open will also be the open for the two-month, four-month, and eight-month candles.
Bearish Monthly Open Strategy: If anticipating downside price action for the month, the script is flipped from the bullish strategy (where you look for the low of the month to happen right off the bat). From the monthly open, anticipate upside momentum to happen first. Once this upside push is presented, look for short triggers, such as an Inside Daily Candle Failure. If that trigger presents, short the market and look for price action to go below the monthly open and expand downward.
We anticipate a counter-trend rally higher before the next leg down, likely bouncing from the current important support zone. This counter trend rally will be prime suspect to make a lower high with respect to previous All Time High and must be shorted. It is currently difficult to determine the exact termination point of this bounce without looking at more price action data develop. However, the previous monthly open at $115,736 will serve as a key dynamic Support/Resistance (SR) level, aligning with a previous swing low.
Recent price action confirms the bearish structure, as every weekly or monthly open has held as resistance. The trend favors shorts for the next month or two, but entries should be sought on counter-trend bounces, not at current lows where the downside has already played out.
🏆 Gold's Explosive Breakout: Entering the Endgame
Whenever inflation is the risk, gold performs phenomenally well. This is currently being reflected in the performance of Gold Miners (GDX), signaling a major move in the underlying metal. Gold is presenting an incredibly bullish pattern, suggesting we are entering a phase of explosive expansion. This is arguably one of the highest probability trade setups available, potentially better than equities.
The Power of Gold Miners (GDX)
The Gold Miners ETF (GDX) provided a leading indicator for the move in gold. In the month of August, gold miners had their “best month ever.”
Gold Miners (GDX) rallied 21% in August.
In comparison, Bitcoin was down 12% for the last month.
If gold miners are breaking out in this manner, gold is certain to follow. Gold recently broke out of a consolidation zone last week and is poised to start rising significantly. Furthermore, GDX has been ripping while Gold has been moving sideways in the past 2-3 weeks, creating a notable divergence.
The Catch-Up Trade: GDX/Gold Divergence
Comparing Gold (XAU) and Gold Miners (GDX) reveals a fascinating divergence. While the two assets have moved hand-in-hand since the September 2022 bottom, GDX has recently outperformed.
Comparing the June 16th swing highs, Gold Miners are currently sitting about 15% higher, while Gold is just sitting at that swing high level now. This suggests Gold may have another 15% rally simply to catch up to what GDX has already achieved in August. It is possible GDX goes sideways while gold catches up.
Consolidation, Technicalities, and the 130-Day Sideways Action
Gold has confirmed a breakout on the daily chart, closing above the key resistance level of $3,430, which had marked the previous three tops. A key trend line, connecting the April 2024 top with the October 2024 top, has also held as support during the breakout.
A key pattern analyzed was the Double Inside Two-Month Candle. On Friday, gold invalidated this pattern on a technical basis by slightly poking above the previous two-month candle's high, rather than closing inside it. Does this technicality negate the explosive potential? No.
The reason the “Double Inside Two-Month Candle pattern” works is that it represents underlying consolidation. Price has been consolidating for 185 days. Just because a technicality occurred (breaching the high by one day) does not negate the fact that the market underwent this long consolidation. The market is still poised for an explosive run as a function of that consolidation.
More importantly, the current price action represents a breakout from a 130-day consolidation zone. This means it is getting ready to explode, and the next two months should capture that uptrend. The recent price action also confirmed a breakout on the monthly chart in the form of a bullish order block.
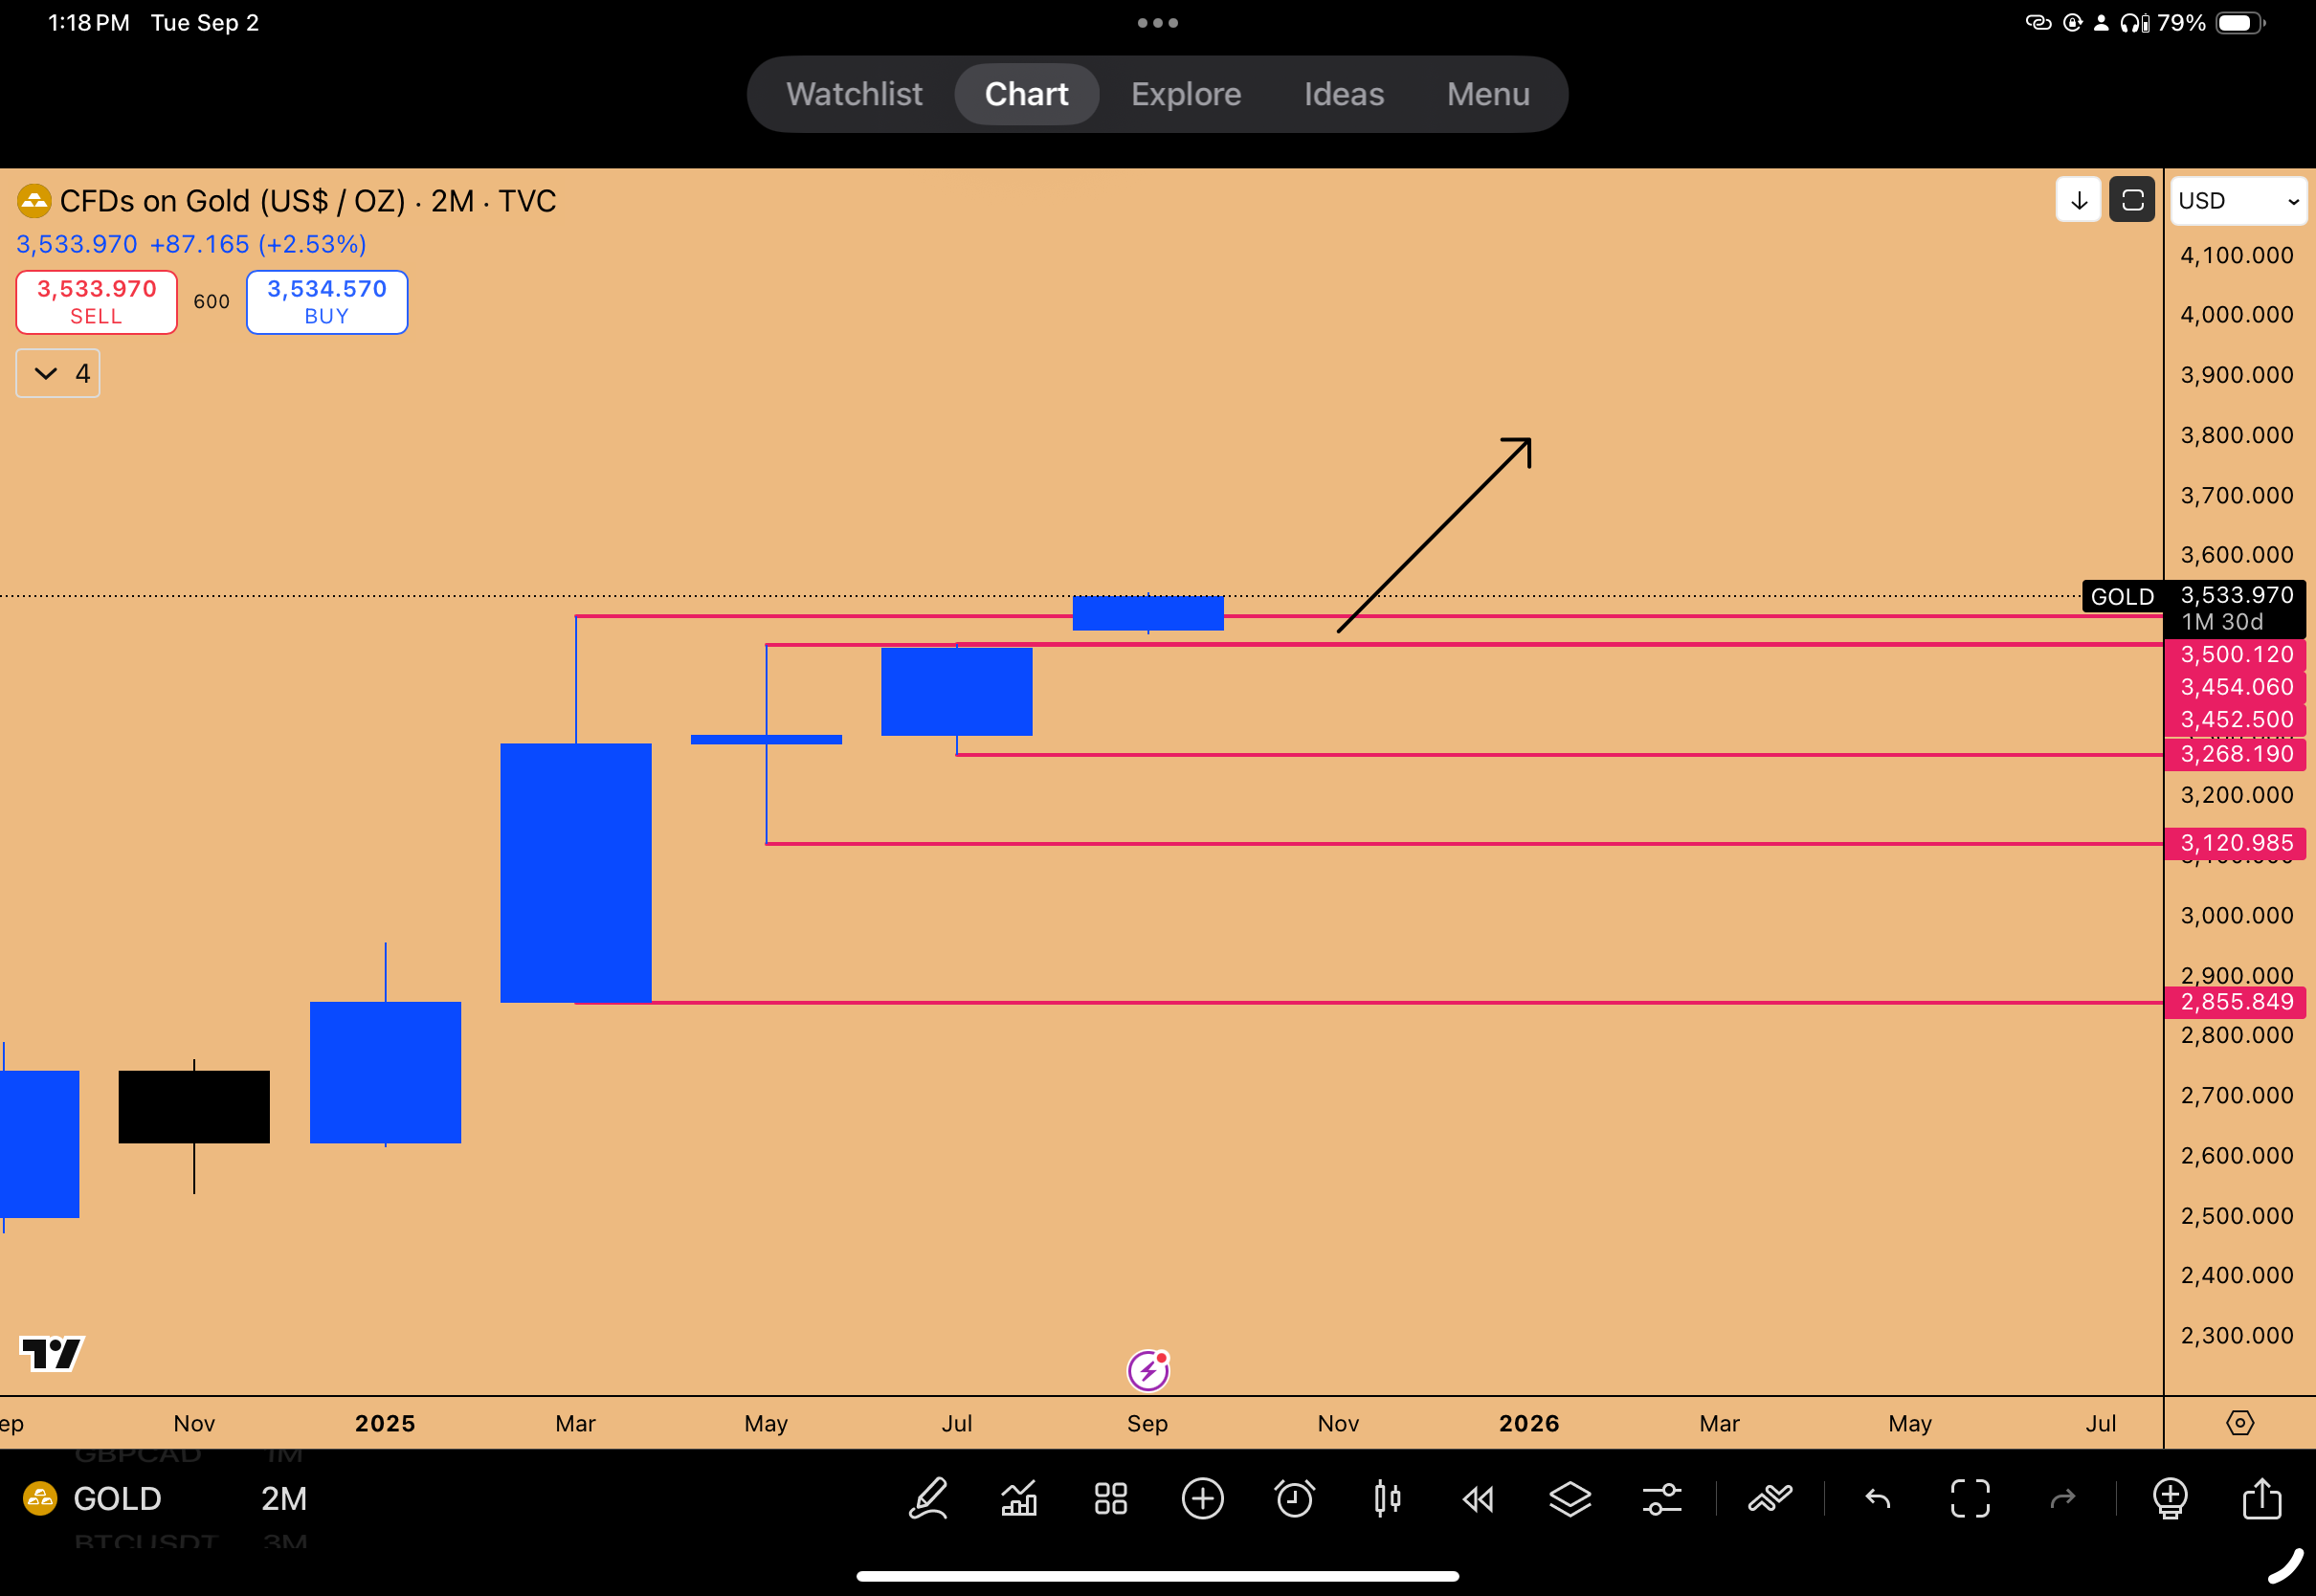
Figure 5: Double Inside 2-month candle pattern going through a breakout
Navigating Overbought Conditions and Super Cycles
A primary concern with gold is the Monthly RSI, currently sitting at 86.52. This is an extremely overbought reading. However, a core trading rule applies: indicators take a secondary role; the primary indicator is always price action. If the price indicates it wants to go higher, we do not question it.
This is characteristic of a bubble. The mind will suggest the asset is overvalued and overbought. But an asset in a bubble will keep inflating in value as long as the underlying liquidity supports it. Overbought conditions will remain overbought and get even more overbought.
🌀 The 8-Month Candle and Super Cycle Analysis
Looking at the 8-month candle, which just closed, the structure is super bullish, with the RSI at 84. Historically, during mega super cycle runs, the 8-month RSI can go much higher.
2001-2011 Super Cycle: The 8-month RSI reached 96.
Current (84): There is still significant room for the RSI to expand higher.
The candlestick formations on the 8-month chart are massive, showing much more strength compared to Bitcoin's recent 8-month candles, which appear very minute in comparison. When gold is in a super cycle, it just keeps going higher, with every candle larger than the previous one, until it forms a blowoff top (similar to the 1976-1980 run). We are still in the formation phase, not the blowoff top yet.
Historical Overbought Expansions: The "Endgame"
Past instances show that when gold reaches overbought conditions, undergoes a shallow pullback or consolidation (like the recent double inside monthly formation), the last phase is explosive. This is the blowoff top phase.
This demonstrates that gold can get extremely overbought even from already overbought conditions, and this is where the largest chunk of the moves happen. Looking at GDX printing a massive monthly candle reminiscent of the final stage, we are entering the endgame now. This phase can last for three, four, or five months and offer spectacular returns.
Geopolitical Drivers and Dollar Devaluation
Gold is performing well due to a confluence of factors: geopolitical conflicts (Russian/European wars), massive liquidity flows in the US (Treasury, government spending, Fed rate cuts), rising inflation (hot PCE numbers), and significant trust issues with the dollar.
Gold does well when the dollar goes down. The dollar (DXY) has been performing poorly since September 2022, which marked the bottom in gold. The upcoming rate-cutting cycle will put even more pressure on the dollar.
Gold as Universal Currency
Distrust between countries also fuels gold demand. If countries are at war or do not want to transact in each other's native currencies (e.g., US dollars or Russian rubles), the only way to settle trade (like oil purchases) is through gold, the universal currency. This is why central banks hoard gold, hedging against future catastrophes.
Targets and Risk Management Strategies
With the breakout confirmed, what are the targets and how should the position be managed?
Targets:
Using yearly pivots, gold has been defending the R2 yearly pivot at $3,272. The next draw on liquidity is the R3 yearly pivot at $3,754. This is roughly 9% higher than the current price and is the expected target for the next two-month candle.
Risk Management and Entry:
Every two-month candle low since the September 2023 bottom has held. We just created an Inside 2-Week Candle Failure which closed as a bullish order block, indicating an imminent explosion.
Stop Loss: The stop loss for any high time frame long position is below the recent two-week candle low at $3,311.
Existing Positions: Current long positions (entered around $3,375) are performing well. The use of options allows traders to weather minor drawdowns during consolidation as long as the core pattern remains valid.
Trailing Stop Strategy (3-Week Chart):
To ride the trend during the expansion phase, the 3-Week Chart Trailing Stop strategy is recommended (as discussed in the S&P 500 risk management webinar). This involves simply raising stop losses to the previous 3-week candle lows and continuing to raise them until stopped out. Once the current 3-week candle closes (in 12 days) with a proper propulsion, this strategy will be implemented starting from the current 3-week candle low. This is the time to be in the market, not getting out, due to the expansion expected in the new monthly, two-month, and four-month candles.
🇺🇸 NASDAQ and Global Indices: Divergences and Correlations
Analyzing the NASDAQ requires understanding its key correlations, not just with other US indices like the S&P 500, but critically with Bitcoin and the Japanese Nikkei. Current analysis reveals significant divergences and warning signs stemming from these relationships.
The Critical NASDAQ-Bitcoin Linkage
Bitcoin's market cycles, dating back to 2018, have been a function of the NASDAQ's price action. NASDAQ’s algorithm is attached to Bitcoin’s algorithm on an alpha-beta perspective.
2018 Collapse: The final drop in Bitcoin (breaking the $6k support) was caused by the 2018 collapse in the NASDAQ, which fell 20% due to the reverse repo market blowing up. The bottom in December 2018 coincided for both assets.
COVID Crash (2020): The collapse and the subsequent phenomenal run-up occurred simultaneously in both the NASDAQ and Bitcoin. (A mid-cycle correction occurred in Bitcoin due to the Coinbase IPO profit-taking, but it recovered as NASDAQ held up).
2021 Top and Bear Market: The November 2021 top occurred when the NASDAQ topped out due to the rate hike cycle sucking liquidity out, bringing both assets down along with it.
Current Bull Run: The recent bottom and the ongoing bull run have been led by the NASDAQ.
Bitcoin reacts because the NASDAQ reacts to broader economic impacts (like Fed decisions). It's an association mechanism. If Bitcoin is currently indicating it wants to top out, we must assume the NASDAQ is also going to top out.
As detailed previously, Bitcoin has been leading the market. For example, Bitcoin bottomed first after the March 31st dip and made an all-time high on May 12th, whereas the NASDAQ lagged until June 23rd. Now, Bitcoin is giving a clear top signal, while the NASDAQ has not yet confirmed its top but is lagging.
Bitcoin topped out on August 13th and has been down since then, breaking below the August 3rd low. The NASDAQ, which topped around the same time, has not yet broken that low. This divergence suggests the NASDAQ needs to catch up to the downside, following Bitcoin’s lead. Traders must actively navigate by comparing swing highs and lows across these assets; when one leads, the others catch up.
🇯🇵 Nikkei, the Yen Carry Trade, and Global Risk Appetite
The Nikkei is the global barometer for risk appetite and moves in parallel with the NASDAQ. The recent monthly candle close on the Nikkei is concerning.
Nikkei Warning Signal: The Nikkei has formed a Monthly SFP (Swing Failure Pattern) after taking out the inside quarterly candle high. If the next monthly candle rejects lower, this will have a corresponding effect on the NASDAQ. The NASDAQ will not go higher if the Nikkei comes down.
Historical Correlations:
If the Nikkei undergoes a pullback, it spills over to the NASDAQ. Examples include the February 2025 top and the infamous July 2024 Yen carry trade collapse, where the Nikkei drop caused a corresponding peak and drop in the NASDAQ. While the NASDAQ typically outperforms the Nikkei during rallies (currently 12% more growth compared to the Nikkei since the July 2024 high), it will not escape a downturn if the Nikkei turns lower.
The Mechanics of the Yen Carry Trade
The correlation exists because the Japanese central bank keeps interest rates artificially low (0%). This provides a funnel for other economies to borrow cheap capital from Japan, convert it to US dollars, and invest it in hyper-growth US assets (Nvidia, Apple) via the NASDAQ. Hedge funds capture 10%, 15%, 20% profit, close the positions, and return the principal amount to Japan interest-free. If the Nikkei starts going down, it implies this cheap capital is becoming unavailable, forcing traders to liquidate their NASDAQ positions, causing a spillover effect.
⚠️ The S&P 500 Divergence: A Major Top Signal
A critical trigger is currently present between the S&P 500 and the NASDAQ, signaling a potential market top.
The Divergence: The NASDAQ is forming a Lower High. The S&P 500 is forming a Higher High.
This divergence, combined with the formation of a Bear Block, sets off “alarm bells all over my mind happening that you need to be out of the market.” This pattern repeatedly shows up in top formations. You never want to see the NASDAQ (the main growth engine) being the weaker index. If the NASDAQ undergoes a pullback, the S&P 500 will follow.
This discrepancy suggests that while some funds may be overleveraged in the S&P 500, many others are taking profits in the growth sector (NASDAQ), evidenced by the lower high.
Historical Examples of SMT Divergences
2018 Crash Precursor: Before the massive drawdown in 2018, daily chart divergences appeared where the NASDAQ was not performing while the S&P 500 was attempting higher highs. This indicated something was happening underneath the surface. Shortly after, the index dropped 8% in 6 days, and the S&P 500 followed down 7-9%.
February 2025 Top: This top was also marked by an SMT divergence. On February 18th, 2025, the S&P 500 made a higher high on the next daily candle, while the NASDAQ made a lower high. The market subsequently underwent a free fall.
The current divergence is massive and concerning, especially when combined with the fact that Bitcoin, the proxy for the NASDAQ, has already entered a downtrend.
📉 Microsoft Weakness, Nvidia Strength, and Downside Targets
Why is the NASDAQ behaving weakly and failing to push higher? It's because one of its biggest participants, Microsoft (MSFT), is not participating.
MSFT vs. NASDAQ: Microsoft printed a bearish monthly candle, while the NASDAQ printed a bullish monthly candle. This is a major cause for concern and suggests the NASDAQ must catch down to Microsoft.
Microsoft also has an Inside Month Candle. If we undergo a drop next month, it should be bought. Microsoft has a history of forming quarterly bullish order blocks that are never breached. A pullback would likely test the supports inside the quarterly candle bullish order blocks have been formed.
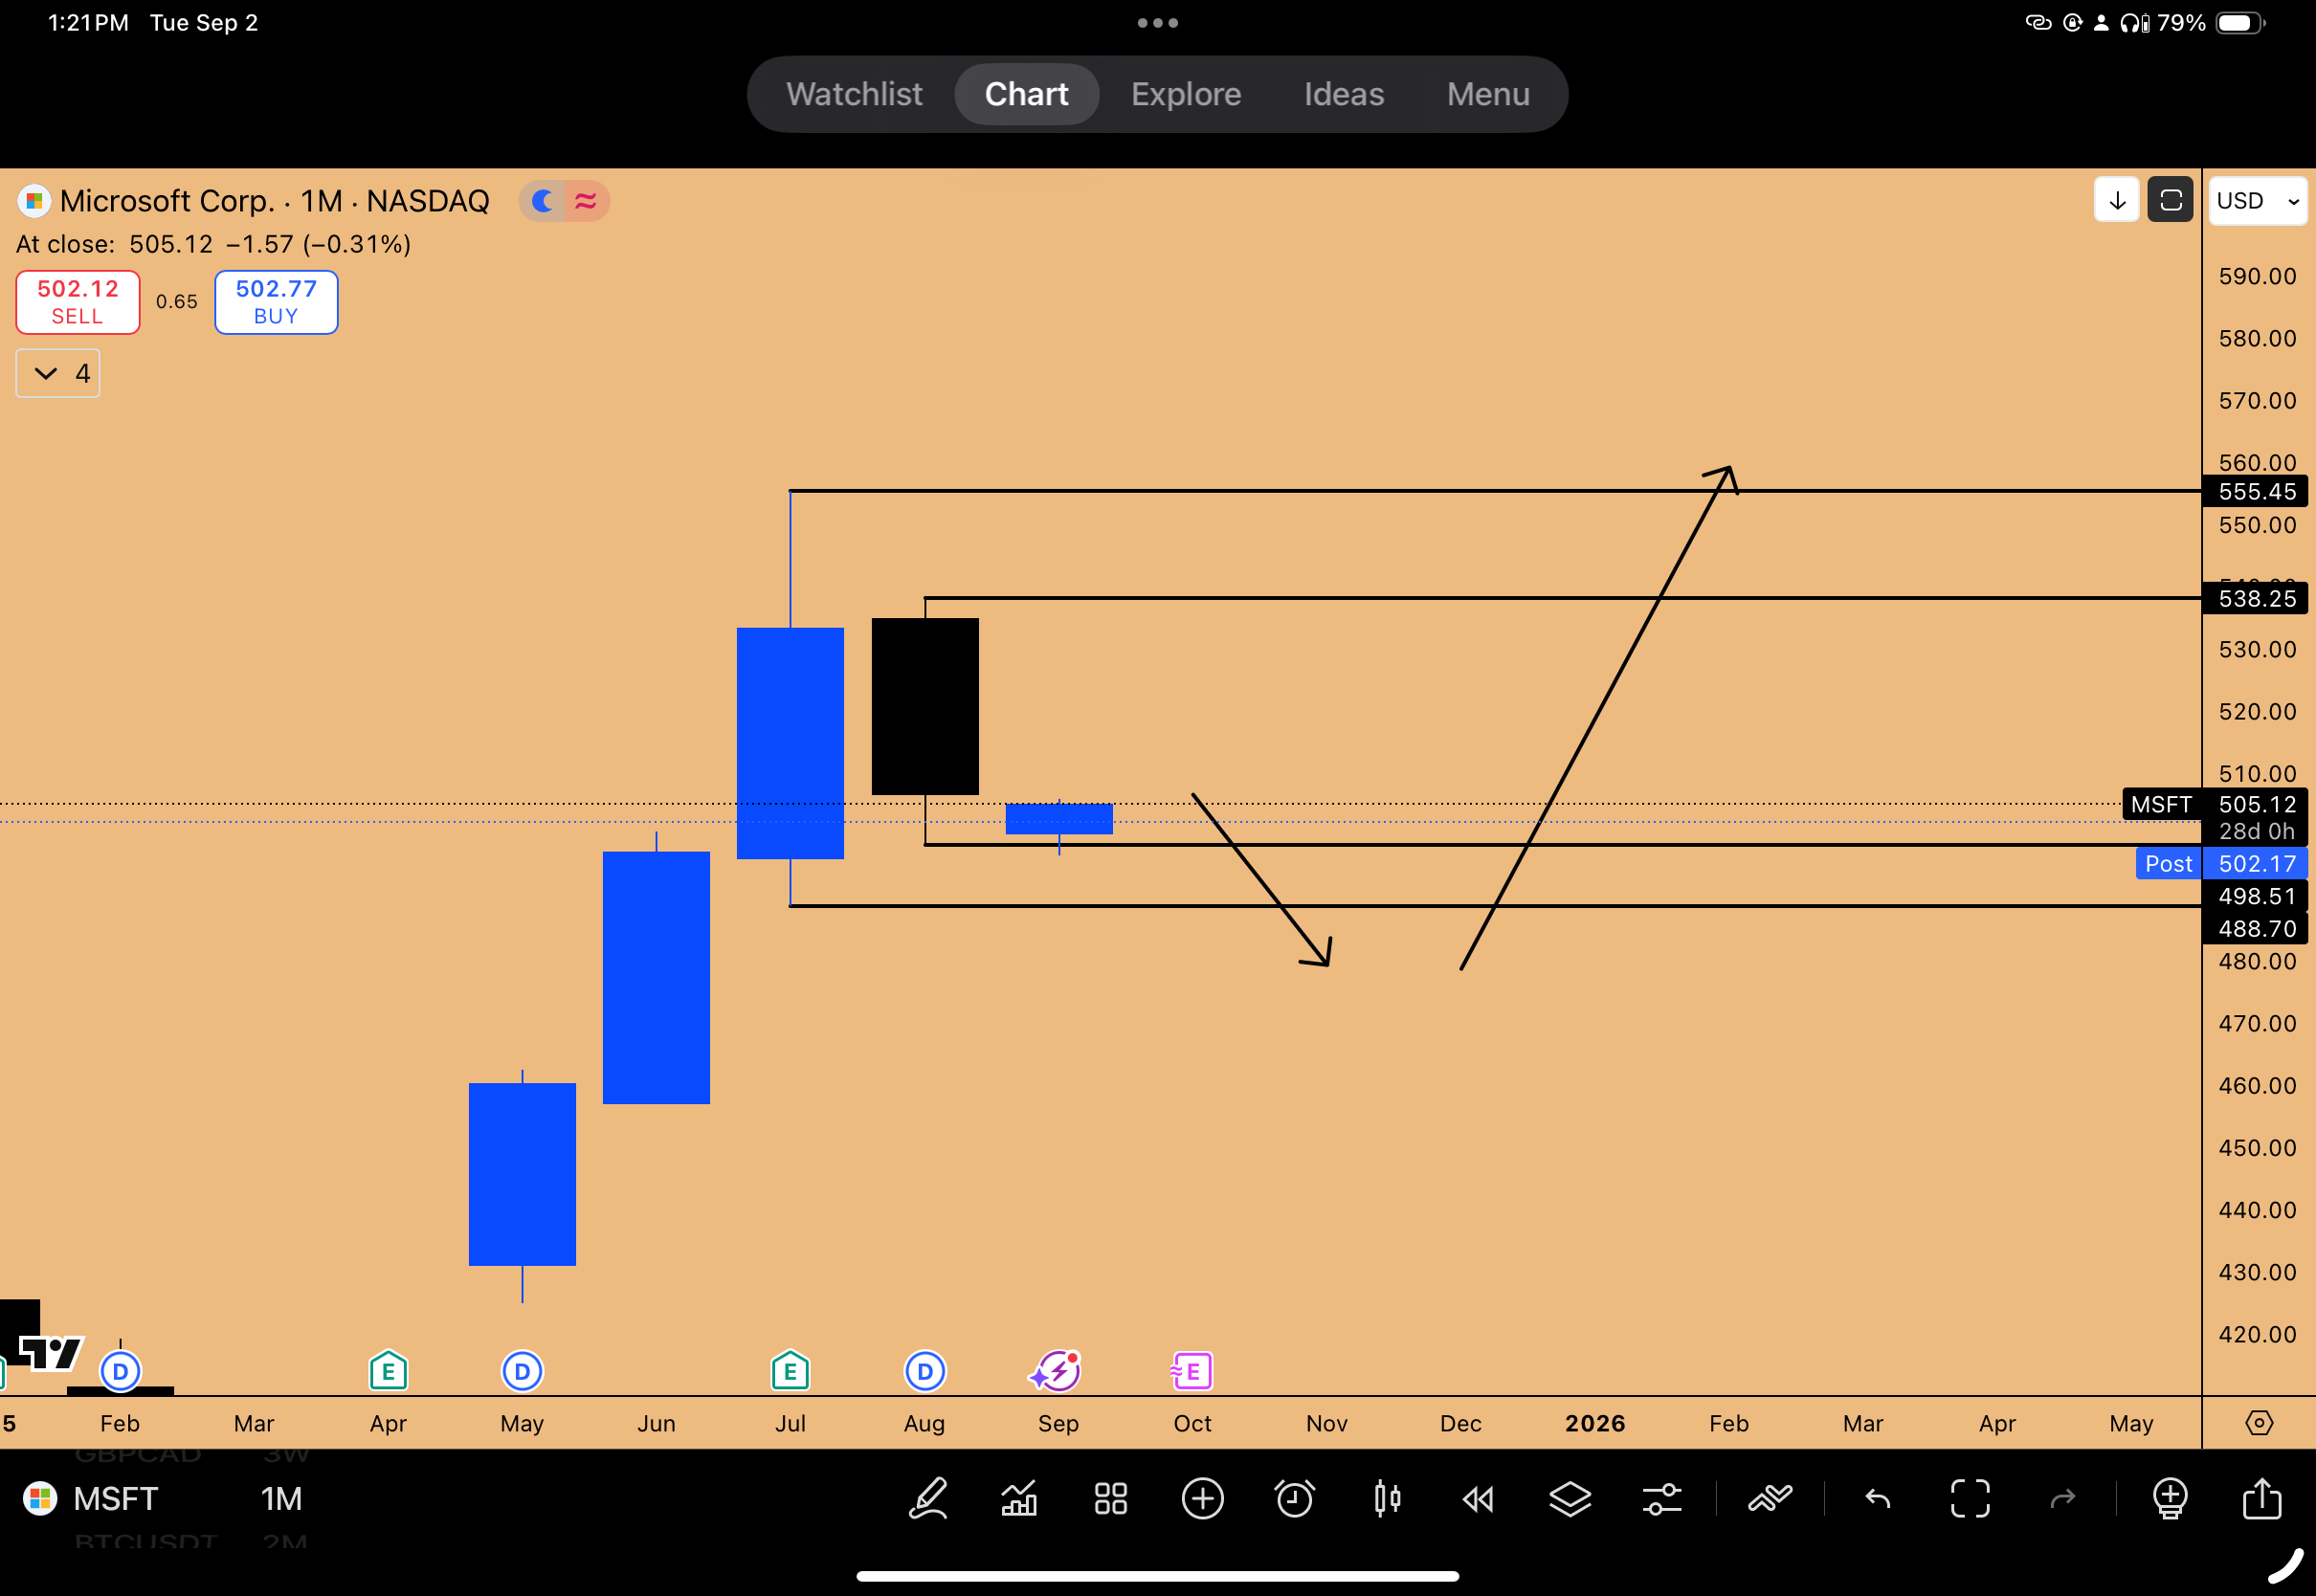
Figure 6: Inside Monthly Candle Pattern in formation
The Role of Nvidia (NVDA):
The entire reason the NASDAQ is behaving the way it is (holding up) is because of Nvidia. The bullish monthly candle in the NASDAQ is essentially the monthly candle of Nvidia.
Downside Targets and Supports:
If Nvidia undergoes a pullback to test its respective all-time high level for support, and Microsoft drags the index down, the NASDAQ should come down to test its key support levels.
Key Support Levels: 22,245 and 22,133.
These levels correspond to the previous all-time high SR levels and the previous two-week bullish order block. Tapping these levels would offer the best risk-reward ratio for re-entering long positions. While the divergences signal a topping formation, it does not guarantee a full-on crash like 2018; however, it strongly indicates the need to be on the sidelines and avoid opening new long positions currently.
📚 Technical Analysis Deep Dive: Q&A
In this section, we address specific viewer questions regarding market cycles, correlations, and the methodology behind the analysis presented.
The Strategy Behind Analyzing Multiple Time Frames
Q: I noticed you went through multiple time frames today (two weeks up to six months) to mark out inside bar patterns. Are there specific time frames you look at strictly, or do you just go through all until you find the pattern present?
A: The approach is to go through all timeframes until a pattern is present. Time frames must be viewed as a global mesh network; they are all interconnected.
The Methodology: An entire year (one yearly candle) can be broken down into 12 months, four quarters, three 4-month candles, or six 2-month candles. Cycling through multiple time frames allows us to stitch them together to make sense out of whether the market is undergoing consolidation or expansion.
Spotting Consolidation: Consolidation presents in the form of an Inside Bar candle. Short consolidations appear on weekly/daily charts; large ones appear on monthly/two-month charts. By cycling through all frames, it is very hard to skip a consolidation altogether.
The Edge: The job of a trader is to position ahead of a breakout when consolidation is happening to ride the entire trend. The Inside Bar strategy is the best strategy known to spot these consolidations and understand that they are at the cusp of breaking out. It provides the lowest risk with the highest risk ratio to position in any kind of trades before the trend starts unfolding.
🔮 Key Takeaways and Outlook
As we navigate the coming months, the focus remains squarely on Bitcoin, Gold, and the NASDAQ, which are showing clear, yet divergent, signals. The high time frame analysis indicates a period of potential correction for risk-on assets and a simultaneous explosive phase for safe havens.
Bitcoin and NASDAQ Outlook:
Bitcoin has printed significant bearish signals, including Inside 2-Week and 1-Month Candle Failures, and a 2-Month SFP. This suggests exhaustion and a downside bias for the immediate future, targeting liquidity down to $98,200 and potentially the $85,000 gap. Bitcoin is leading the market, and the NASDAQ is expected to follow. The NASDAQ is showing critical divergences (lower high vs. S&P 500 higher high) and internal weakness (Microsoft's bearish monthly candle), signaling a likely top, further supported by the Nikkei's Monthly SFP. Downside support for the NASDAQ is near 22,245. September seasonality further supports a cautious approach to equities and crypto.
Gold Outlook:
Gold is in an incredibly bullish posture, breaking out of a 130-185 day consolidation. Driven by inflation and geopolitical factors, and confirmed by the 21% rally in Gold Miners (GDX) in August, Gold is entering a super cycle "endgame." Despite extreme RSI readings (86.52 monthly), the price action suggests a blowoff top phase is beginning, targeting the R3 pivot at $3,754.
The Macro View:
The long-term perspective remains bullish. The massive liquidity injections ($45T government spending) and the upcoming rate-cutting cycle (4% down to 2%) define the current environment as a bubble driven by asset inflation. While immediate technicals suggest a downturn in risk assets, this is viewed as a correction within a larger bull market, not a repeat of the 2021 bear market. These pullbacks represent significant buying opportunities for long-term positioning into 2026.
As we head into the new month, utilize the Monthly Open Strategy to navigate the anticipated volatility. Watch for the counter-trend bounces in Bitcoin to establish short/hedge positions, and manage the explosive uptrend in Gold using the 3-week trailing stop strategy.
What's your take on these setups? Are you hedging your Bitcoin exposure or aggressively longing Gold? Share in the comments—let's discuss strategies. Subscribe for more market breakdowns, including the upcoming Quarterly Outlook report on September 30th!
Disclaimer: This isn't financial advice – just market musings from the charts. Always do your own research.
If you enjoyed this deep dive, please share it with fellow traders!