

Market Top Warnings: Bitcoin/MSTR Parallels, Cash Index Inefficiencies, and Extreme AI Concentration Risk

📈 Executive Summary
The current research is a comprehensive analysis dissecting critical developments across Bitcoin, major indices, and US equities as we navigate a market flashing significant warning signs.
This week’s major catalyst is the Jackson Hole Symposium on Friday, where Federal Reserve Chair Powell is expected to signal interest rate cuts starting in September. While this fundamental backdrop appears bullish, the underlying technical structure suggests a starkly different reality: exhaustion is entering the market, bullish participants are fatigued, and momentum is waning.
This analysis argues that we are witnessing the formation of a midterm market top, not a simple pullback. The signatures observed indicate active distribution, characterized by price action designed to stop out late longs while preventing easy short entries through multiple stop runs.
The cryptocurrency market, particularly Bitcoin, is exhibiting a striking parallel to the March 2021 market top. We are observing significant bearish divergences (higher highs in price, lower highs in RSI) on weekly and daily charts, coupled with a critical inside 2-week candle failure inversion that is confirming now.
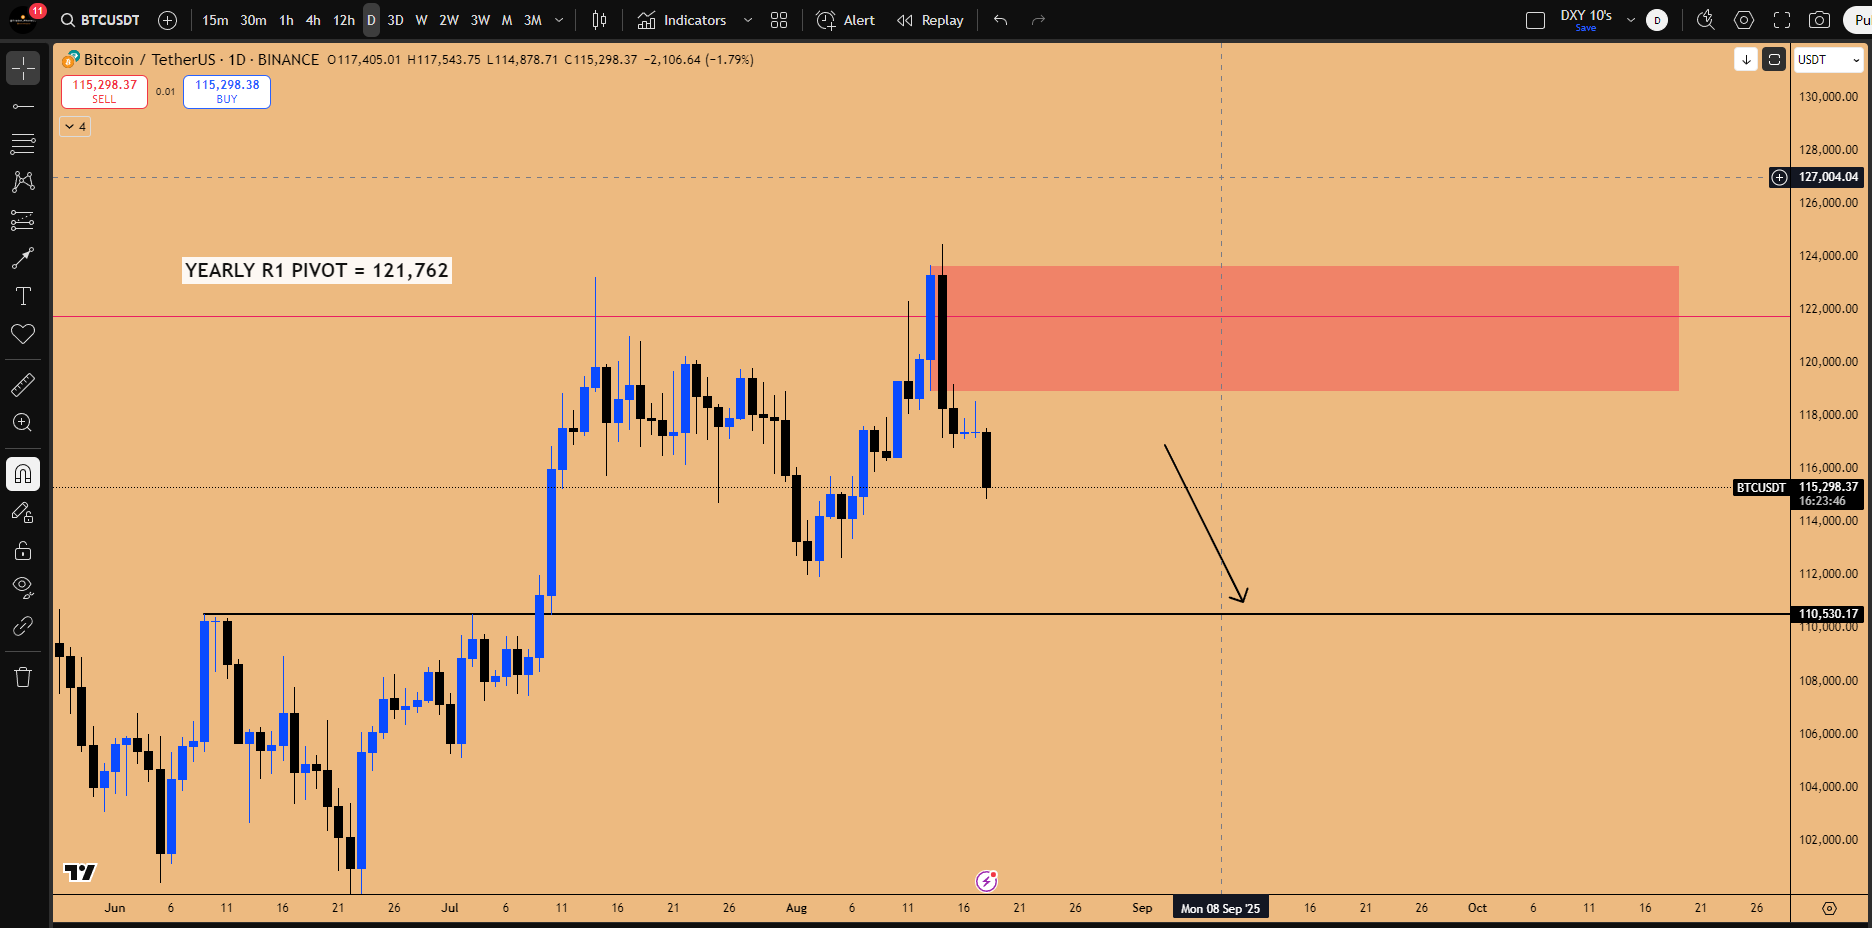
Bitcoin has been struggling for a month at the R1 Yearly Pivot ($121,767)—a level historically associated with drastic trend reversals, as Bitcoin is now a mature asset controlled by Wall Street algorithms. Crucially, MicroStrategy (MSTR), the "poster child of Bitcoin," is leading this bearish structure, exhibiting the exact topping pattern from 2021 (making a lower low after a higher high), suggesting reverberation effects for Bitcoin are imminent.
The critical support level is $111,980; a monthly close below this risks triggering a significant inside monthly candle failure. The explicit advice is clear: “Don't be long on the market. Period.”
In the equities market, the analysis emphasizes the paramount importance of Cash Indices (DJI, SPX, NDX) over futures charts. Institutional money flow dictates market movements based on the cash index. We identify major downside inefficiencies, notably "Flat Opens" (candles with no wick) and significant open gaps on the weekly and 3-week charts for the Dow Jones and S&P 500. Historically, these inefficiencies act as magnets for price, necessitating a correction to "sort them out."
Furthermore, the NASDAQ is exhibiting extreme concentration risk. While Microsoft (MSFT) has been lagging post-earnings, the entire index is currently being driven solely by Nvidia (NVDA), exhibiting a near 100% correlation. This dangerous dependency hinges on NVDA's earnings report on August 27th, identified as the primary catalyst capable of triggering a market-wide pullback.
We also explore the ongoing AI revolution, analyzing the vertical moves in stocks like AVGO (10 consecutive 2-week bullish candles) and the fundamental strength of Google (GOOGL) due to the powerful integration and superior capabilities of its Gemini AI models.
What does this mean for your portfolio? The immediate strategy demands extreme caution, protecting capital, and preparing dry powder for the anticipated correction (August-September window) to deploy in high-potential assets like Solana (SOL) and leading AI equities.
Key Takeaways from this Analysis:
Midterm Top Formation: Evidence suggests distribution and exhaustion across risk assets, signaling a potential top rather than a mere pullback.
Bitcoin's Critical Juncture: The confluence of the R1 Yearly Pivot resistance, the March 2021 parallel, and the MSTR leading indicator points to significant downside risk.
Cash Index Supremacy: Institutional algorithms prioritize the cash index; monitoring gaps and "Flat Opens" on DJI and SPX is essential for anticipating downside moves.
Nvidia as the Linchpin: NASDAQ's reliance on NVDA makes the August 27th earnings report the most significant catalyst for the immediate market direction.
Strategic Positioning: Avoid new longs on Risk on Assets such as BTCUSD, take profits, and wait for confirmed monthly closes below $111,980 on Bitcoin before considering aggressive short positions.
📊 Market Exhaustion and the Midterm Top Hypothesis
As we look at the setups for the coming week across Bitcoin, indices, and US equities, the market is anticipating clarity on the timeline for interest rate cuts. The Jackson Hole Symposium is scheduled for this Friday, where Powell is expected to speak about finally wanting to lower interest rates, potentially starting in September.
While this should theoretically cause the market to behave bullishly, the current technical landscape advises strongly against entering long positions due to concerning signatures emerging in the price action.
Distinguishing a Pullback from a Midterm Top
There are certain signatures showing up which suggest that exhaustion is entering the market. Market participants who have been bullish are getting fatigued and losing their momentum, a trend prevalent in the cryptocurrency markets as well.
It is crucial to understand that the current market behavior is different from a standard pullback formation. The signatures being witnessed have more to do with a midterm market top being printed. This distribution phase is characterized by specific, deceptive price action setups.
The way the market is setting up, “it's stopping out people who are trying to go long at the top and it's also making sure that not many get a chance to enter short because it's carrying out stop run’s before going down.” This pattern, observed multiple times in the past, signals a potential inflection point demanding caution.
⚠️ Bitcoin at the Crossroads: The March 2021 Parallel and Critical Levels
The current setup in Bitcoin strongly mirrors historical precedents that suggest a significant reversal may be imminent. The confluence of bearish divergences, critical pattern failures, and historical parallels paints a precarious picture for the near-term trend.
The March 2021 Blueprint and Bearish Divergences
The current market structure is strikingly reminiscent of the top formed in March 2021. In that instance, the market printed an inside 2-week candle. It then spent approximately four weeks running the highs of that candle, rejected, came higher for a resistance test, and subsequently went through a “massive flush in the market.”
The credibility of this parallel stems from accompanying signals, primarily bearish divergences being printed across the board. Looking back at March 2021, the market became extremely bullish and overbought in February 2021. As the price continued to print higher highs, the RSI was concurrently printing lower highs.
This divergence was drastically present not only on the daily chart but also on the weekly chart. The weekly RSI was making lower highs while the weekly price was making higher highs, indicating a loss of momentum on a week-over-week basis
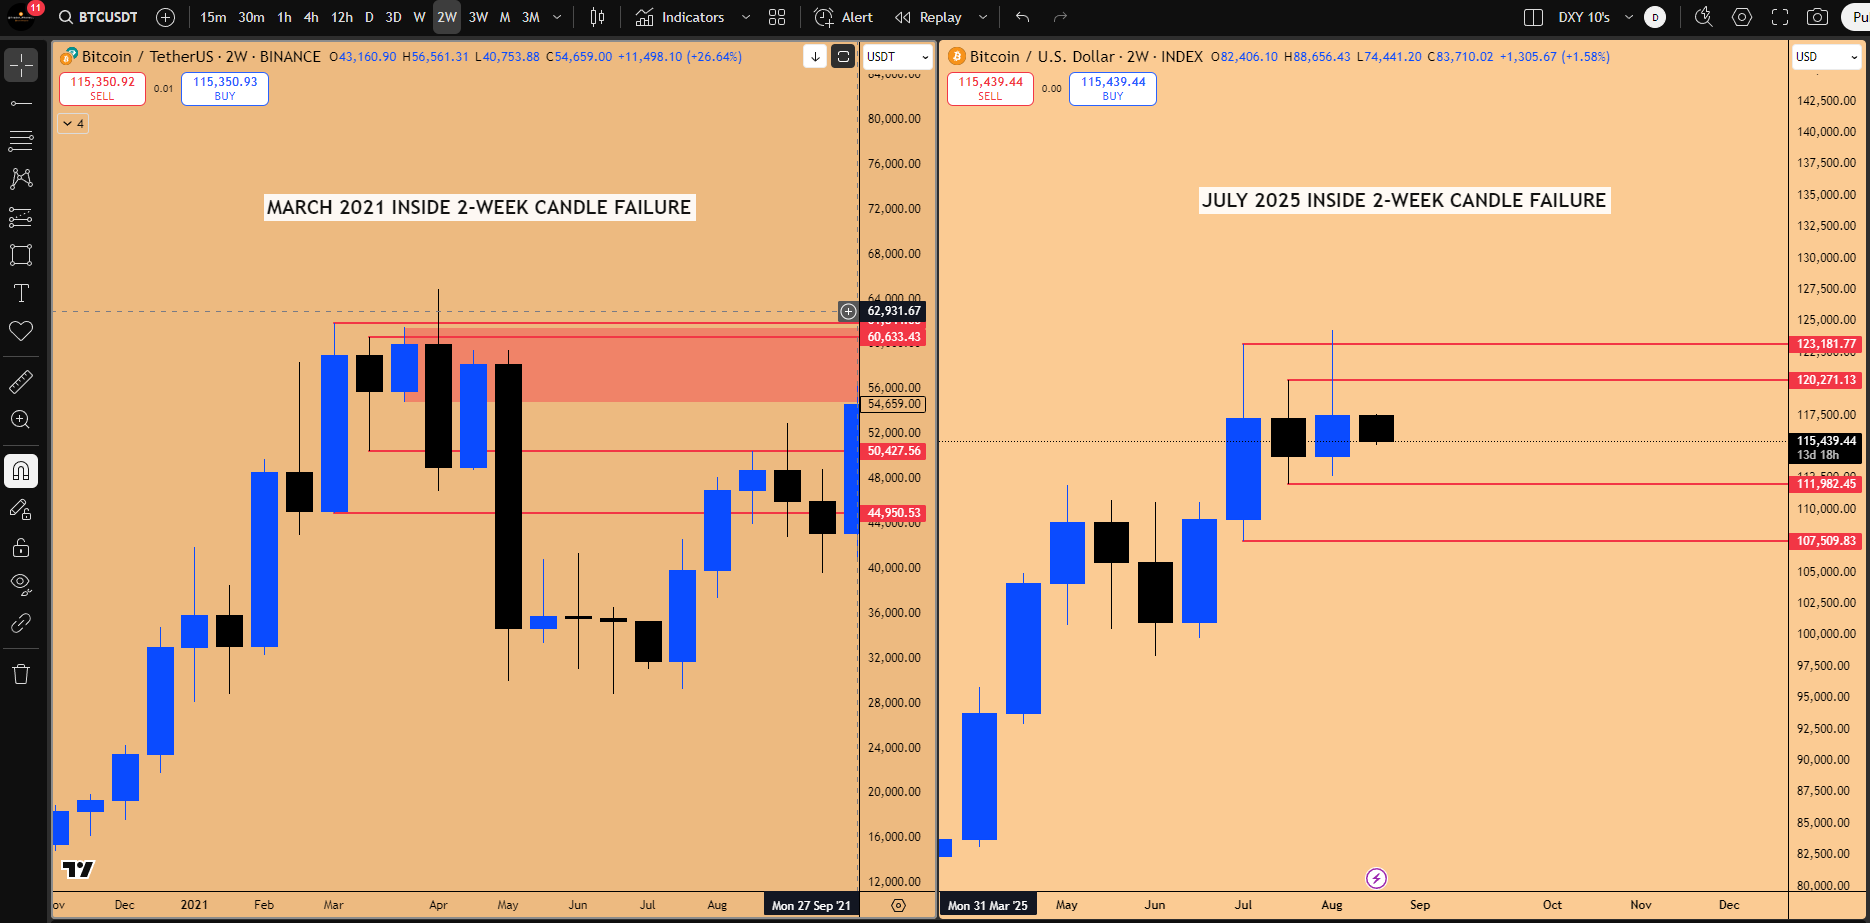
Figure 1: March 2021 Inside 2-week Candle Failure vs July 2025 Inside 2-week Candle Failure
✅ The Confirmation Sequence: When Price Agrees with Weakness
Divergences by themselves do not matter as much; they only start mattering when the price starts agreeing with them. In the 2021 case, the agreement—indicating the price was overstretched and ready to reverse—came when the inside 2-week candle failure confirmed (Refer to Figure 1 above).
The process involved:
Rejection: Running the highs of the inside candle and seeing a proper rejection.
Confirmation: The critical step was closing the candle as a 2-week bearish order block. This is where the price agreed with the extended RSI, confirming a resistance formation.
Market Structure Break (MSB): Price came down, confirming the bearish block, and then bounced.
The Ideal Short Entry: The bounce created a lower high in comparison to the market high. This followed the MSB and provided the highest probability short entry before the significant downturn.
🚧 Critical Technical Levels: 2-Week Failures and Monthly Risks
Bitcoin is currently exhibiting a highly precarious pattern on the 2-week chart: a bearish inside 2-week candle failure. On confirmation, the near-term trend is in jeopardy. The advice is explicit: “Don't be long on the market. Period.”
Invalidation Level: The bearish thesis is invalidated only if the next 2-week candle turns bullish and closes above the $123,225 high.
Resistance Zone: Continued rejection of the $120,000 and $123,000 highs confirms the bearish outlook.
Downside Targets (Draw on Liquidity): $111,920 low and eventually the $107,429 low.
The implications extend significantly to the monthly chart. The monthly candle closes in the next 14 days. If these next two weeks are bearish, the market risks closing below the critical SR level at $111,980.
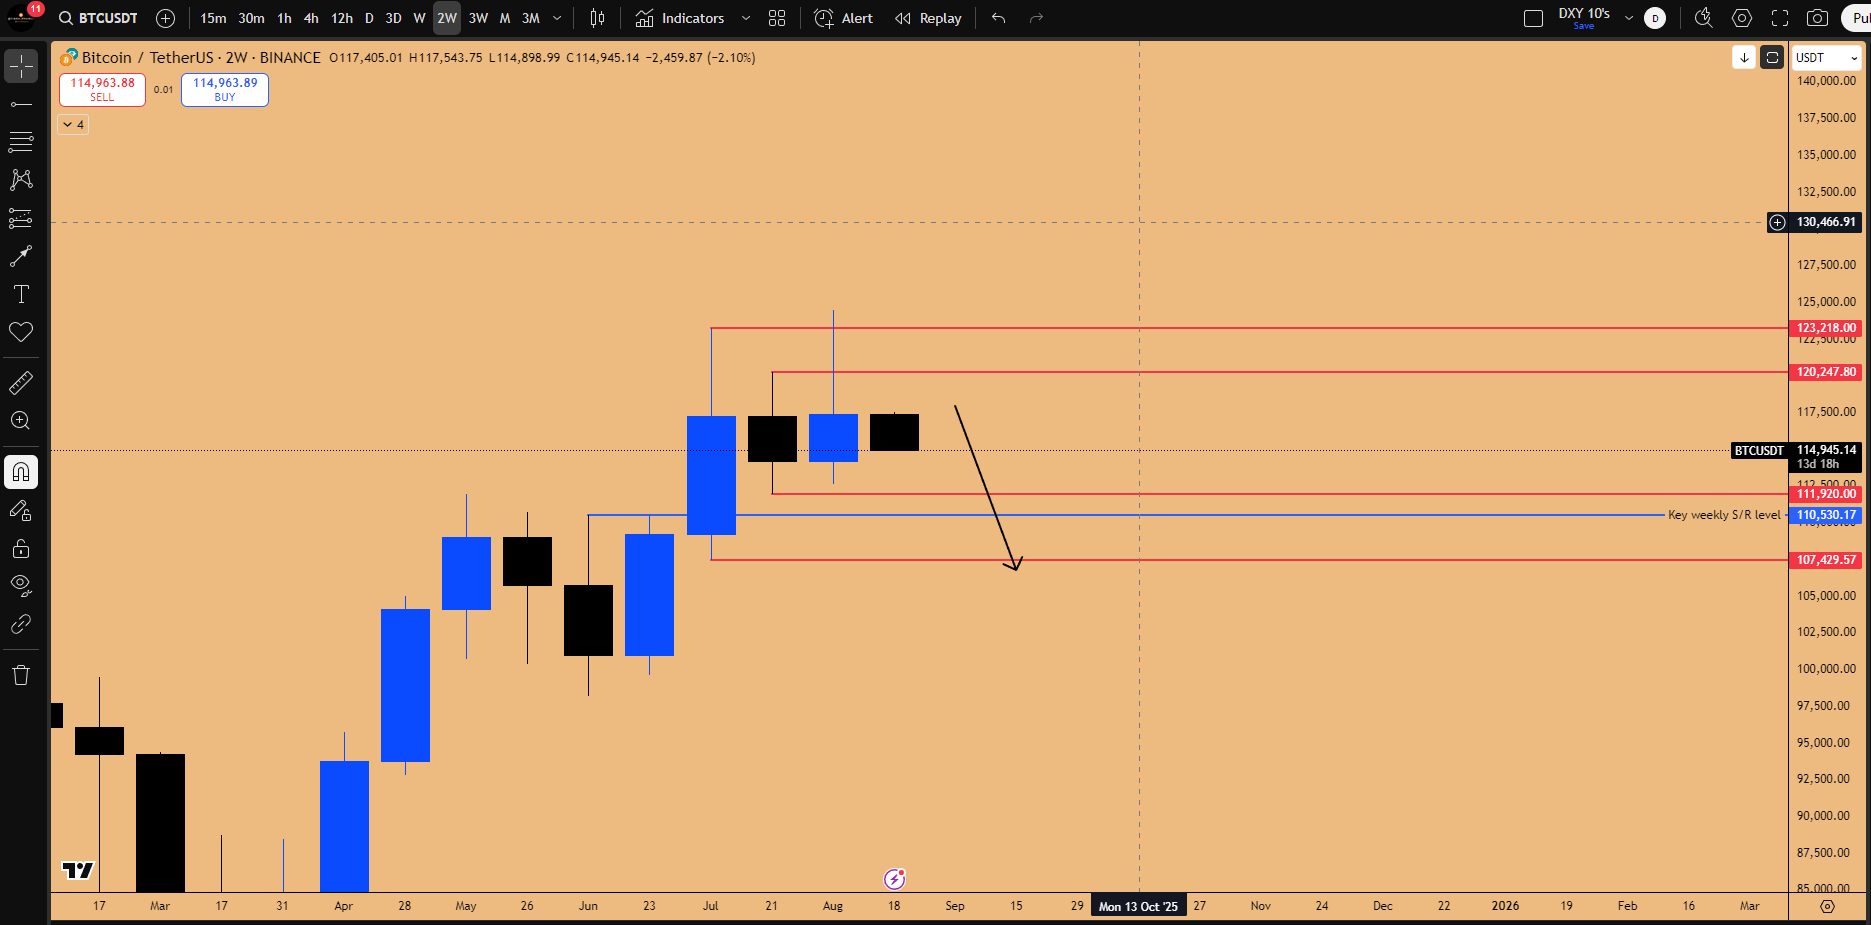
Figure 2: Inside 2-week candle failure confirmed, implying downside liquidity being the magnet for price.
🐦 The MSTR Canary: MicroStrategy as the Leading Indicator
The importance of monitoring MicroStrategy (MSTR) cannot be overstated, as it looks “extremely similar” to the Bitcoin structure in March 2021. MSTR is the "poster child of Bitcoin," and their price action is almost identical because MSTR's business model is centered on buying Bitcoin. If MSTR stock is behaving like it's trying to top out, it will have reverberation effects on the Bitcoin market.
MSTR Showing the Hand Ahead of Time
The MSTR/BTC Monthly Divergence:
A key divergence occurred regarding the monthly structure, highlighting MSTR's weakness. While both assets formed an inside monthly candle in May 2025:
In July 2025, MSTR saw a fakeout to the upside and closed as a Swing Failure Pattern (SFP). on the monthly chart, suggesting downside price action to unfold.
Bitcoin did not close as an Inside Monthly Candle failure; it closed higher, suggesting it was diverging from MSTR
“Because MSTR did not [make a new high] and was already going lower. Bitcoin is now being given the memo that it needs to start following MSTR and go down along with it.” This is a significant warning sign for the market structure shift happening in real-time, demanding that traders take profits and avoid new long positions.
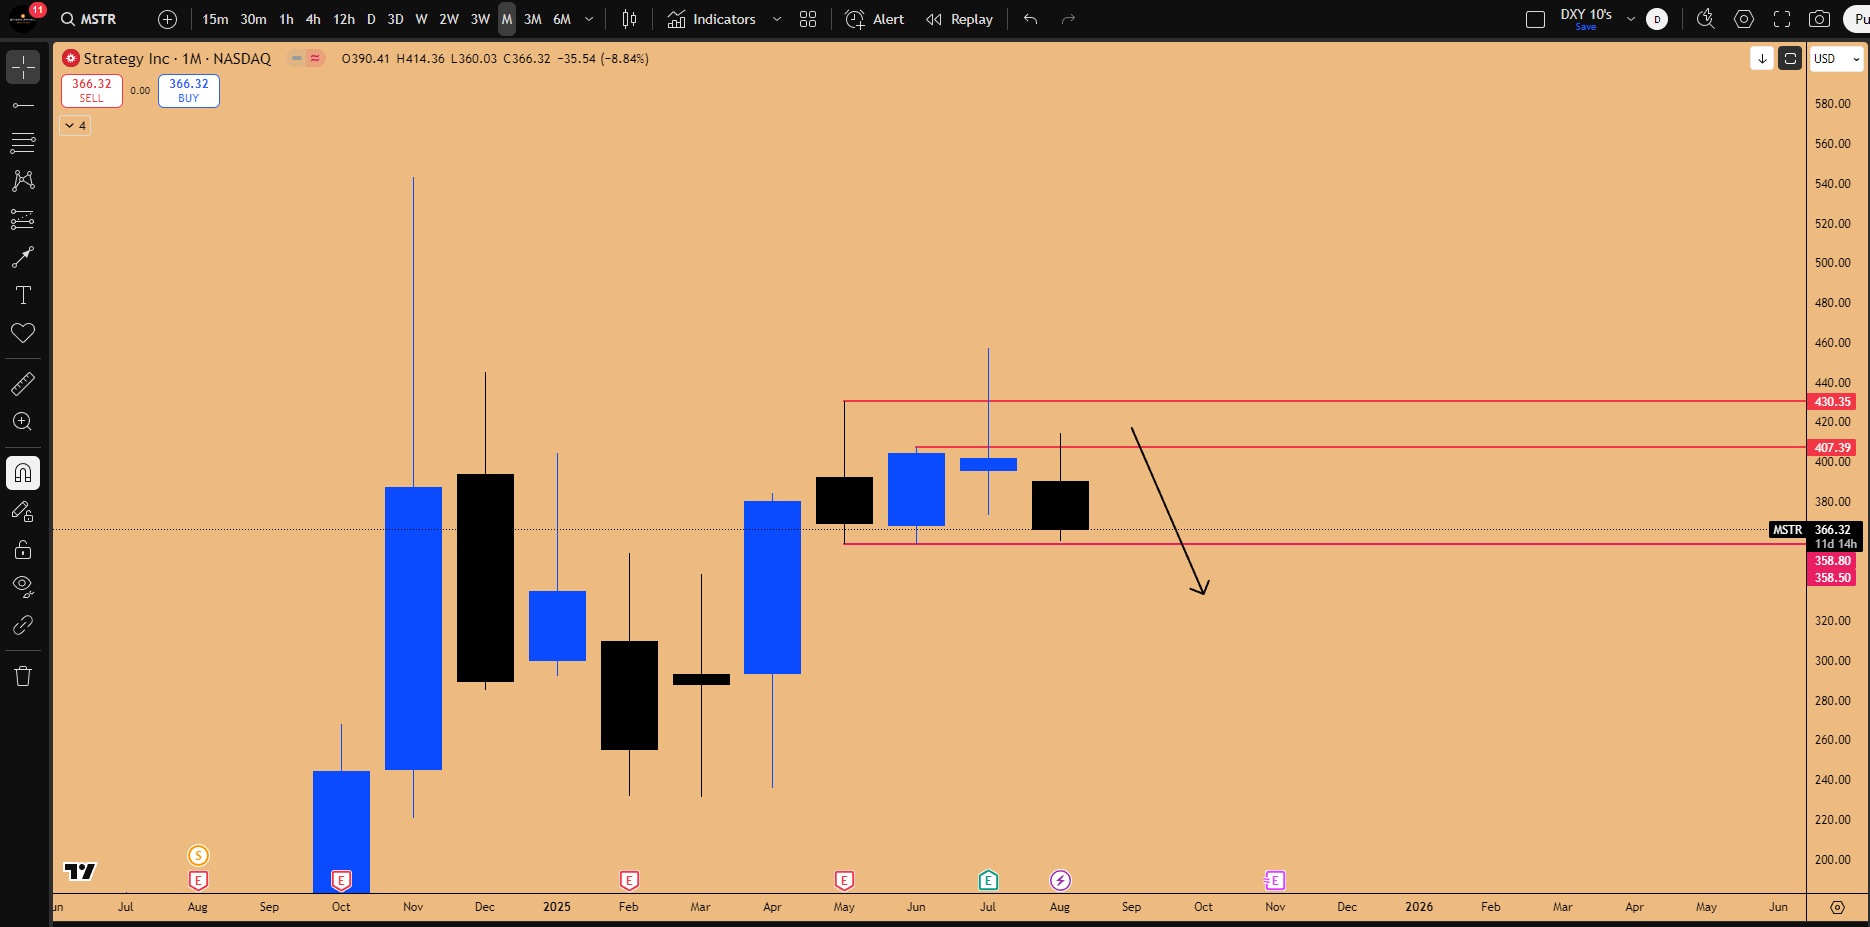
Figure 3: Inside Monthly Candle Failure on MSTR
🚦 Trading Strategy for BTC: Caution Before Confirmation
The current environment presents warning signs, not confirmed triggers. This means “you don't enter longs. That's it.” Stay on the sidelines, be patient, hold onto capital, and let the market develop.
Shorting is premature. There is no market structure break in NASDAQ at the moment, so calling a top prematurely is risky.
The Confirmation Trigger:
Wait for Bitcoin to take out the $111,920 low and, more importantly, wait for the monthly candle to close. If it closes below the inside monthly candle highs ($111,980 and $110,530), then that would be a short trigger for altcoins or Bitcoin altogether.
Bitcoin Trading Zones: The market is currently noise between two key zones:
Support/Long Entry: $110,500 (110k). If this level is tapped (equivalent to $63 on IBIT), long it, but only anticipate a bounce play to create a lower high with respect to All Time High.
Resistance/Short Entry: $120,000 (120k) region is strong resistance. Once the bounce reaches this area (the bearish order block), short it.
🤔 How to Utilize Yearly Pivots (The R5 Rule and Q&A)
Understanding how to set up and interpret these pivots is crucial for anticipating market inflection points.
The R5 "Blind Short" Rule:
A critical rule for the Pivot Point Standard indicator is the Yearly R5 Pivot. “Anytime the market goes to the R5 pivot that's a blind short. You just go blind short of the market. Any asset doesn't matter.”
Example: Joby Aviation (JOBY): Following a macro triangle breakout, JOBY rallied almost 192%. It topped out precisely at the R5 Yearly Pivot, tagging it to the exact cent before rejecting heavily. This indicates the extension for the year is likely complete.
Example: Archer Aviation (ACHR): Rejecting from its R1 Yearly Pivot.
These examples demonstrate that even smaller companies respect these pivots because Wall Street algorithms are wired to trade them, and the same algorithms are now running Bitcoin.
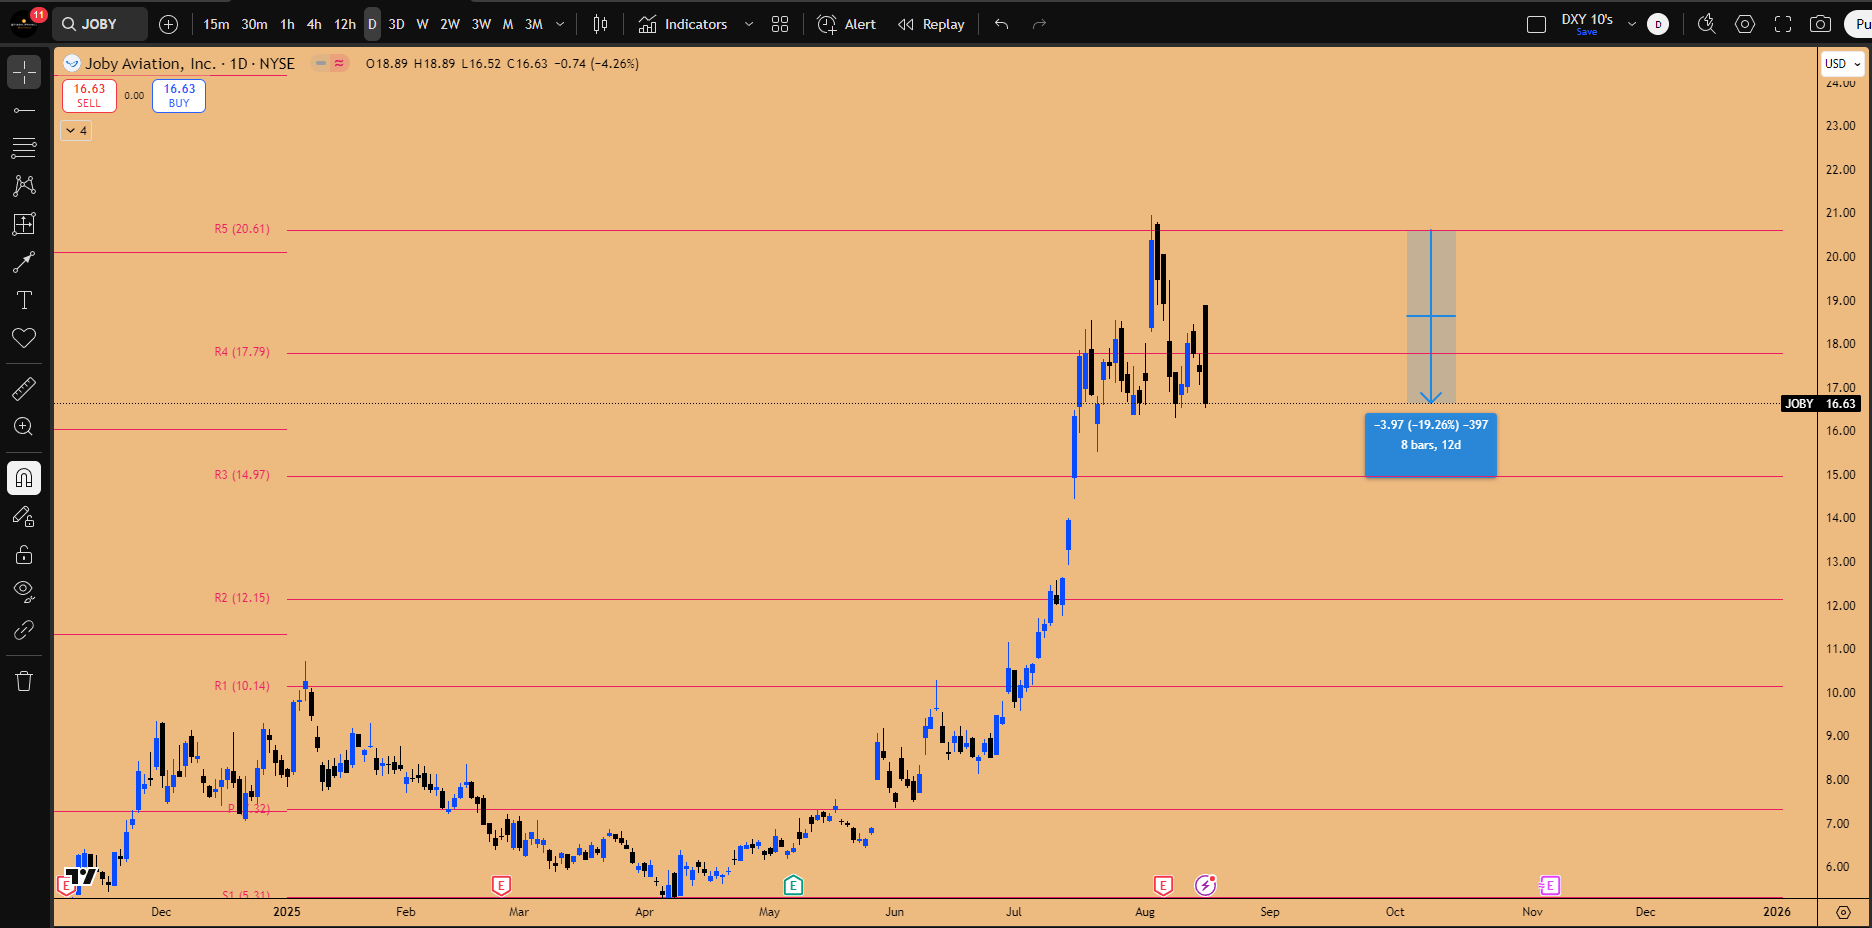
Figure 4: 20% downside witnessed on Joby Aviation from R5 Yearly pivot rejection
💰🔄 Ethereum and Altcoin Strategy: Institutional Rotation
While the Bitcoin outlook suggests caution—if Bitcoin goes down 5%, altcoins will suffer significant downside—specific setups and catalysts are emerging in Ethereum and Solana, driven by institutional interest and favorable regulations.
Ethereum (ETH): Targeting the Value Zone
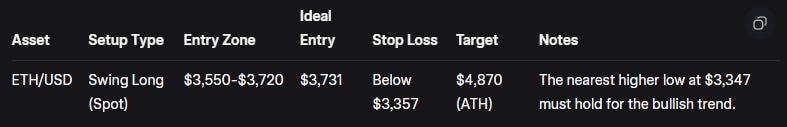
For Ethereum (ETH), the focus is laser-focused on a key support zone where the real value currently lies. The current price action is in the middle of nowhere, and engagement is not advised. A short might even be considered if a proper trigger forms at all-time highs.
The ideal scenario is a pullback to the 25% range level at $3,870. This support zone can be refined down to the daily support zone between $3,550 and $3,720. This area offers an amazing risk-reward ratio for a swing long position.
Ethereum Spot Long Setup:
While a bearish order block exists on Ethereum, mirroring Bitcoin, shorting ETH is not advised as it remains one of the strongest altcoins. If Bitcoin pulls back toward $110,000, Ethereum will follow, but the extent is uncertain due to the strength in the ETH/BTC pair.
The macro range analysis supports this entry. Price recently rejected the 25% range level ($3,870), tagged the midpoint of the sub-range ($3,377), and rallied toward the all-time high. Since the highs have not been stopped out (swept), any pullback to $3,870 is a long opportunity.
(Note: In response to a viewer question, the levels used are custom ranges drawn in a previous live stream, not Fibonacci levels.)
ETH/BTC Dynamics and Maturity (Q&A)
The primary reason for Ethereum's recent strength is the ETH/BTC chart, driven by an inside monthly candle failure.
Draw on Liquidity (Target): 0.04144. Once reached, Ethereum may start correcting.
Support Zone: 0.03187. A pullback to this level constitutes one of the best long setups for Ethereum.
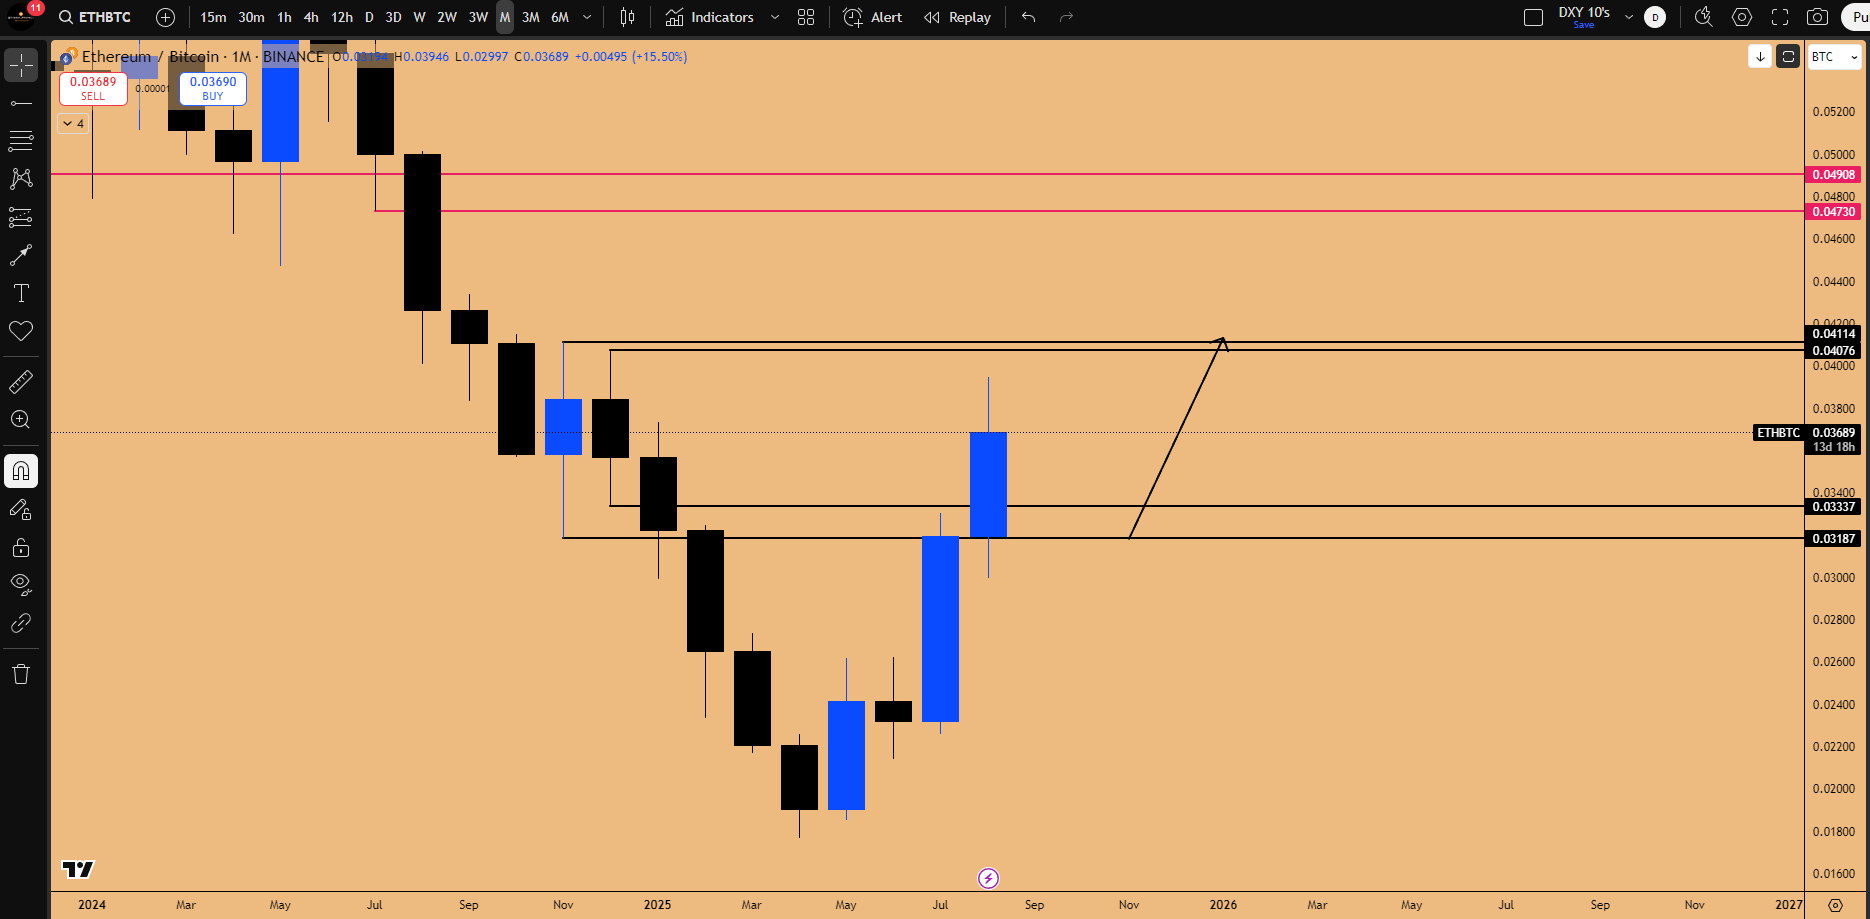
Figure 5: ETH/BTC Inside Monthly Candle Failure pattern in play
⚛️ Solana (SOL): The Long-Term Institutional Play
A longer-term strategy is developing for Solana (SOL). The fundamental catalyst driving Ethereum—companies opening Ethereum treasuries and institutional investment—is expected to happen for Solana as well.
This institutional investment should cause Solana to double, targeting at least $400. The strategy is to open a spot long position (no leverage) and hold it for the next 3 years.
Solana is currently a "cheaper deal." While Ethereum is near its all-time high, Solana has significant room to catch up. The move to the previous all-time high alone represents a 54% return.
Entry Strategy: Wait for Bitcoin's correction to resolve (assessing in October). If Solana corrects to the downside liquidity at $155 or $161, spot positions will be entertained.
💰 Indices Deep Dive: The Supremacy of Cash Indices and Inefficiencies
Analysis of the major indices reveals critical insights derived from the differences between futures contracts and the underlying cash indices. Understanding these dynamics is essential for anticipating market moves and avoiding traps, as institutional money flow dictates the true market direction.
The Importance of Cash Indices (DJI, SPX, IBIT)
It is essential to pay attention to the cash indices for any major asset class, as inefficiencies often appear on the cash index but not on the 24/7 futures charts (which eliminate overnight/weekend gaps).
Bitcoin: Cash index ETF is IBIT. Gaps on IBIT almost always get filled.
S&P 500: Cash index is SPX.
Dow Jones: Cash index is DJI.
NASDAQ 100: Cash index is NDX.
🔬 Case Study: The US30 Short Failure and "Gut Feeling" (Quiz Recap)
A recent analysis of US30 (Dow Jones Futures) highlighted a significant learning moment regarding the interplay between futures and cash indices, and the nature of "gut feeling" in trading.
The Initial Setup (US30 Futures): A strong short setup was identified at a key resistance zone (bearish order block). The plan was to short at 44,055 with a stop at 44,700.
The Conflict and The "Gut Feeling": Despite the mechanical entry process providing a lucrative risk/reward ratio on a “Short Setup”, it was noted during our discussion in Discord Indices Discussion channel that there is a conflict at hand:
“My gut feeling was telling me, that I'm going to get stopped out on this.” The market indeed punched higher, invalidating the setup. Did not matter how good the short setup looked, I would have been taken out of the market.
Reason for US30 to invalidate the Short Setup:
The Cash Index (DJI) Lag: Critical realization was the difference between US30 and the DJI cash index. The higher timeframe pattern was the inside two-month candle failure, targeting the all-time highs.
While US30 futures chart showcased that all-time high had been breached, the DJI cash index had not yet reached its all-time high. This is paramount because institutional algorithms prioritize the cash index. Options contracts are executed on the cash index. Option dealers punching billions of dollars worth of orders do so through ETFs like DIA.
“If the draw in liquidity is to the upside to all-time highs and that all-time high has not been hit on the cash index then you have to be somewhat wary of the fact that the cash index is going to go higher until the all-time highs do get taken out in the cash index.”
The Essence of Gut Feeling in Trading: This scenario demonstrates that "gut feeling" in trading is often rooted in previously processed, reliable information, such as the DJI chart structure. This information, though perhaps consciously forgotten due to information overload or analysis paralysis, remains active in the subconscious, serving as a warning against a potentially flawed trade.
↔️ Analyzing Market Inefficiencies: Gaps and "Flat Opens"
Now that the DJI has met its upside liquidity target, attention shifts to inefficiencies that could draw the market lower.
A major inefficiency exists on the DJI 3-week chart: an open gap between 43,588 and 43,724.
Critically, this gap features a "Flat Open" on the weekly chart.
“A flat open is a phenomenon... where whenever there's no wick to the candle that is an insanely inefficient market structure and price almost always comes down to revisit it to sort out the flat open.”
The Dow Jones is also technically showing an inside weekly candle failure (closing below the all-time highs and the previous week's high), providing a mild short trigger. Since the upside liquidity has been taken out and the market is rejecting, the draw on liquidity is now this downside inefficiency.

Figure 6: Open Inefficiency in the form of “Weekend Gap” on DJI Cash Index
SPX Historical Precedents and Gap Fills
This inefficiency is not isolated. The cash index for the S&P 500 (SPX) shows the exact same inefficiency—a flat open with no wick on the weekly chart. Furthermore, the recent thrust in SPX has been “insanely inefficient,” leaving open gaps on the weekly, 2-week, and 3-week charts. Historically, the market never allows these high-timeframe open gaps to remain unfilled indefinitely.
Historical Examples of Inefficiency Resolution:
Yen Carry Trade Collapse: A previous significant open gap (flat open) existed on SPX. The Yen carry trade collapse caused the market to puke. It stopped precisely at the flat open, neutralized the inefficiency, and reversed higher.
2022 Rate Hike Cycle: During the downtrend, the market left multiple inefficiencies overhead. When the rate hike was announced in March 2022, a massive short squeeze rally occurred, targeting and closing these inefficiencies before the downtrend resumed.
Inefficiencies on the cash index drive the market. Algorithms prioritize sorting out open gaps on timeframes above the weekly chart.
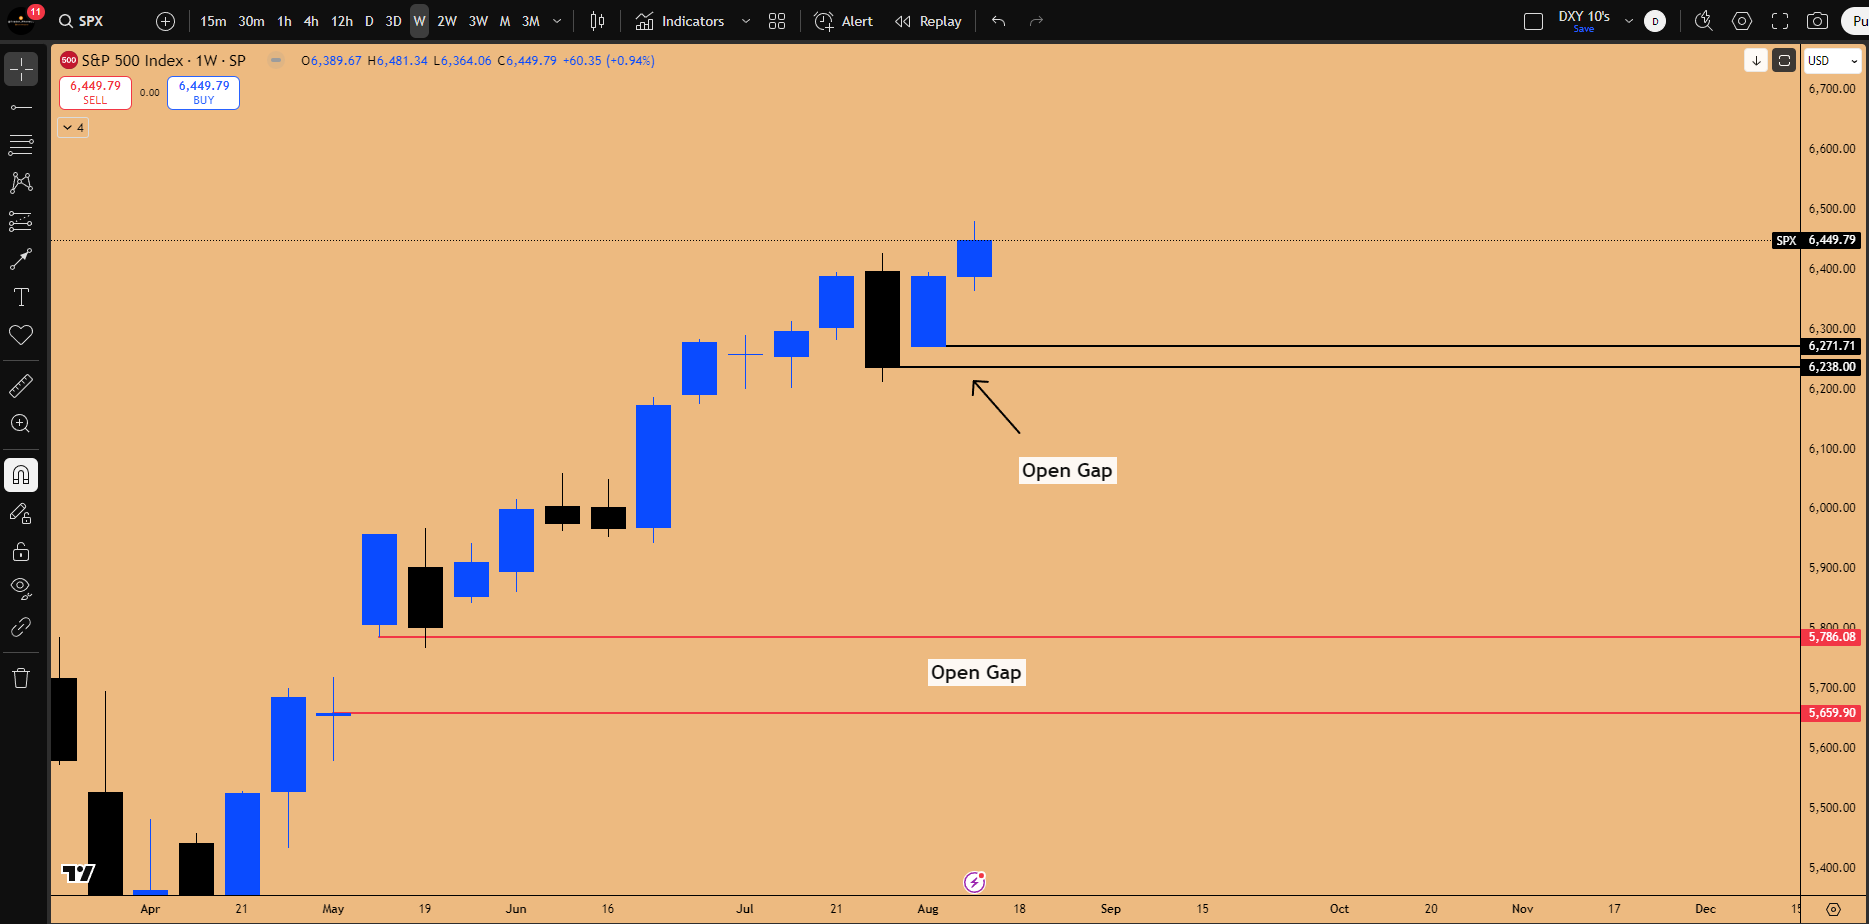
Figure 7: Open Gaps on SPX500 CASH INDEX
Strategy: Dry Powder and The Timeline for Correction
These potential gap fills often require a massive catalyst, resulting in swift downside. This is why maintaining dry powder is essential. Missing these opportunities, like the rally from the April lows, means missing out on phenomenal, potentially “career making trades.”
Timeline and Limitations: While some historical gaps (like those from the COVID crash requiring a 50-66% drop) may never be filled, the market prioritizes gaps opened within the past quarter. If a correction to fill the current gaps is to happen, it must happen now (August-September). Once October begins, positioning will shift toward the anticipated bullish first half of 2026.
🤖 Concentration Risk and the AI Revolution
The US equity market, particularly the NASDAQ, is exhibiting unprecedented behavior driven by the AI revolution, leading to significant concentration risks and vertical rallies in key semiconductor stocks.
NASDAQ's Dangerous Reliance on Nvidia (NVDA)
The NASDAQ index (NDX) is heavily influenced by Microsoft (MSFT), Apple (AAPL), and Nvidia (NVDA). However, a dangerous divergence has emerged.
Microsoft (MSFT) Divergence: Microsoft experienced an unprecedented event: a massive 7% monthly open gap due to earnings reported on April 30th. Microsoft has never created a monthly gap like this in its history, leaving no historical precedent for how it will resolve.
Crucially, Microsoft is not the one driving the NASDAQ in the past two weeks. Since August 1st, Microsoft has actually been going down following its earnings rejection (two bearish weekly candles). Despite this weakness in Microsoft, the NASDAQ has continued to push higher.
The Concentration Risk: Historically, the trio carried the index. Apple lagged and detached. It was primarily Microsoft and Nvidia. Now that Microsoft is lagging, the NASDAQ algorithm has shifted to be influenced solely by Nvidia (NVDA).
“The algorithm for NASDAQ started shifting to just Nvidia only. And that's extremely extremely dangerous.”
The index is now 100% copying Nvidia's price action on a day-over-day basis. If Nvidia misses its earnings and goes down, it will take the entire NASDAQ index down with it, regardless of what other companies are doing.
The Critical Catalyst: August 27th Earnings: Nvidia reports earnings on August 27th. This is the only catalyst in play this month that could provide the anticipated market pullback. If NASDAQ is meant to pull back, Nvidia must pull back, and earnings are the mechanism for that to occur.
🚀 The Vertical Rally in Semiconductors (AVGO)
The trend this earnings season has been for stocks to go down post-earnings (e.g., Netflix dropped 10% post-earnings). The semiconductor sector (SMH) has yet to see this correction. AVGO (Broadcom) is exhibiting historical price action, having gone mostly vertical.
AVGO on the 2-week chart has printed 10 consecutive 2-week bullish candles in a row. This is unprecedented; historical analysis shows previous rallies stopped at six or eight consecutive candles. This extreme extension suggests that at least one or two bearish 2-week candles (a pullback) are imminent.
The anticipated pullback, likely triggered by Nvidia's earnings, should target the retest of the past all-time high. This area will be the ideal entry for swing long positions (including LEAP option calls) going into March or June of next year, anticipating a super bullish first half of 2026.
AVGO and Yearly Pivots: AVGO exemplifies the utility of Yearly Pivots and the significance of S1 pivots. The bottom was printed exactly at the Yearly S1 Pivot. It rallied from there to the R1 Yearly Pivot, resulting in a 105% return in 98 days. Prices rarely visit S1 pivots (typically only during massive crashes like COVID or the 2022 bear market), signaling a time to invest heavily.
Money is flowing into AI, specifically the chip sector due to infrastructure development. This will eventually shift (e.g., to software), but significant money is still to be made in the chip sector over the next year.
Apple (AAPL): Buybacks Over Innovation
Apple (AAPL) has definitively broken out. The focus is on the quarterly candle close (in 1 month 13 days). If it closes as a quarterly bullish order block, it presents a long position targeting new all-time highs (another 12% rally). An ideal entry would be a pullback to the S/R level at $215 to retest the breakout (supported by a 3-week bullish order block).
Despite criticism that Apple is not innovating in AI, the chart remains bullish, consistently making higher lows since 2018. It is expected to make a new all-time high. The driver is not innovation, but massive stock buybacks.
A massive stock buyback was announced in the May 2025 earnings call, and the window opened in August. This is the equivalent of the company providing stimulus checks to invest in the stock.
“If the company has this much cash then they're using it to pump their stock. If they're telling you they're going to pump their stock then believe them don't try to question it.”
Google (GOOGL): The AI Software Juggernaut
Google (GOOGL) is positioned as one of the best AI companies, consistently beating OpenAI. The experience using Google's Gemini Ultra subscription (with the 2.5 Pro model and Deep Think) reveals amazing capabilities that suggest massive future revenue surges.
The Gemini Ecosystem and Tools: Google's AI ecosystem is vast, featuring seven state-of-the-art models compared to competitors like Grok (xAI), which has one.
Competitive Advantage and Integration: This capability leverages Google's vast data repository (YouTube, Google Search), something Grok cannot currently match and may take 1-1.5 years to achieve.
Crucially, Google is uniquely integrating the software side of AI into everyday products, boosting productivity massively:
While Microsoft is integrating AI for businesses, Google is integrating it for regular users across all applications. Google should not be viewed merely as a search company, but as a vast enterprise (Search, YouTube, AI) positioned to capture significant market share.
💡 Key Takeaways and Outlook
The current market landscape is defined by clear signals of exhaustion and potential topping patterns, particularly in Bitcoin and its proxy, MicroStrategy. The parallel to the March 2021 top, characterized by bearish divergences and inside candle failures, combined with the rejection at the R1 Yearly Pivot ($121,767), demands a defensive posture.
The immediate strategy is caution: avoid new longs and protect capital. Critical levels to watch on Bitcoin are the $111,980 support (a break risks a monthly bearish shift) and the $123,225 resistance (a break invalidates the bearish thesis).
In the indices, the distinction between cash and futures is paramount. Institutional flow dictates that cash index inefficiencies (open gaps, flat opens) must be respected and act as downside magnets. The NASDAQ rally is highly precarious due to extreme concentration risk, with Nvidia acting as the sole driver. This makes Nvidia's August 27th earnings a crucial catalyst for a potential market-wide pullback.
The AI revolution continues to drive specific equities. While semiconductors like AVGO appear overextended after historic vertical runs (10 consecutive 2-week bullish candles), companies like Google are demonstrating superior AI capabilities and integration (Gemini), positioning them for massive growth. Apple's recent strength is driven primarily by stock buybacks rather than innovation.
As we head into the Jackson Hole Symposium and the crucial Nvidia earnings, watch for confirmation of the 2-week failure in Bitcoin and any signs of weakness in the NASDAQ. If a correction occurs (likely August-September), utilize dry powder to enter long positions in high-quality assets like Ethereum (targeting the $3550-$3720 zone) and Solana (targeting $155-$161 for long-term spot holds), anticipating a very bullish 2026.
What's your take on these setups and the potential market top? Share in the comments—let's discuss strategies. Subscribe for more market breakdowns!
Disclaimer: This isn't financial advice – just market musings from the charts. Always do your own research.
If you enjoyed this deep dive, please share it with fellow traders!