

Masterclass: Anatomy of a “Worst Trade,” The 4 Pillars of Success, and Q4 Market Outlook


Executive Summary
Welcome to a special deep-dive session. While we usually focus strictly on forward-looking analysis, today we are taking a crucial detour into a trader’s worst nightmare: The Worst Trade. By dissecting anonymous submissions from our community, we are uncovering the psychological traps that lead to “cave brain” decision-making, revenge trading, and the erosion of capital.
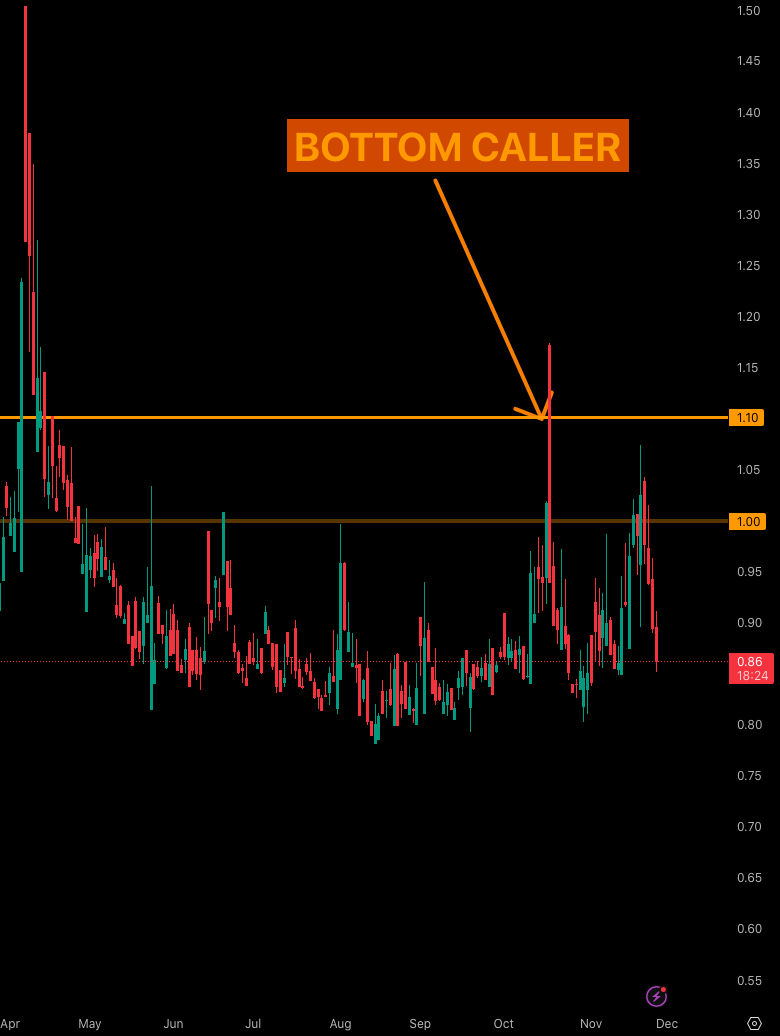
The market context for this session is critical: It is Wednesday, November 26, 2025. We are approaching month-end, and with Thanksgiving in the US, liquidity is diluted. However, the signals are clear. We are deep-diving into our Risk Indicator Suite, which currently suggests a continued “risk-on” environment despite recent wobbles. We are seeing Real Yields dipping below 1.8%, credit spreads finding a ceiling, and our proprietary “Bottom Caller” indicator successfully identifying the S&P 500 floor last week.

In this post, we will cover:
Psychological Autopsies: A step-by-step breakdown of failed DAX, Bitcoin, and USD/JPY member trades, identifying exactly where “process” was outsourced to “emotion.”
The 4 Pillars: Redefining how Edge, Risk, Execution, and Psychology must interact to prevent account blow-ups.
Market Outlook: Why indices (S&P, NASDAQ, DAX) are poised for a mid-December rally, and why we are avoiding Oil despite a bullish chart due to geopolitical variables.
FX & Crypto: The massive gap-fill opportunities in Yen pairs (up to 1000 pips) and the specific “Stablecoin Dominance” level (9%) that acts as the line in the sand for a crypto meltdown.
What does this mean for your portfolio? If you are holding shorts in this environment, you may be fighting a risk-on tide. If you are day-trading, are you recognizing when you are “asking for trouble” by shorting the hole? Let’s dive in.
The Anatomy of Failure: Analyzing “Worst Trades”
We stripped down anonymous submissions to understand where trades go wrong. These aren’t just bad luck; they are structural failures in decision-making.
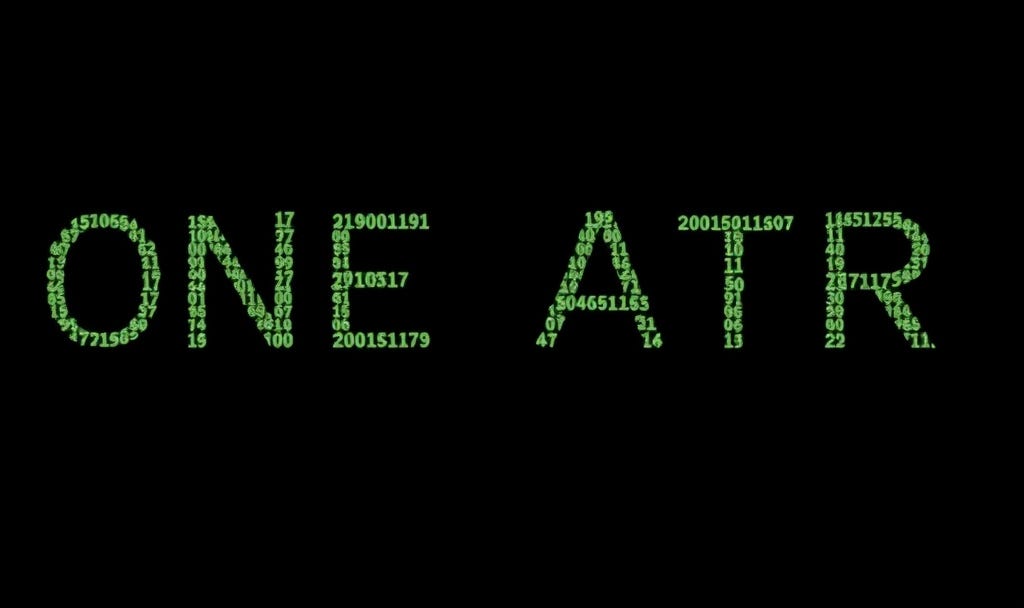
Case Study 1: The DAX Short and the “One ATR” Trap
The first case involved a trader shorting the DAX. The setup seemed plausible to them a continuation of a downward move. However, the execution was fatal.
The Error: The trader shorted when the market was already down one full ATR (Average True Range) from the daily open.
The Reality: In day trading, once an index moves one ATR, it is “fairly stretched.” Shorting here is “asking for trouble.” Unless you are expecting a catastrophic crash, these levels are where snapbacks occur.
The Trap: The trader sold the exact bottom. The market drifted, then snapped back. The trade eventually returned to break-even, offering a “golden ticket” out.
The Psychological Fail: Instead of scratching the trade at break-even, the trader got greedy, hoping the breakout would finally happen.
The “Cave Brain” Takeover
This example perfectly illustrates the “Cave Brain.” When the trade went to break-even, the trader outsourced decision-making to emotions.
In Loss: The brain wants to “escape danger.” It forces you to hold, hoping to get back to zero.
In Profit: The brain fears losing the gain. It forces you to close too early.
The Result: The cave brain assumes the return to break-even is “good fortune” and doubles down on the original bad idea. The outcome was a significant loss on a trade that offered a free exit.
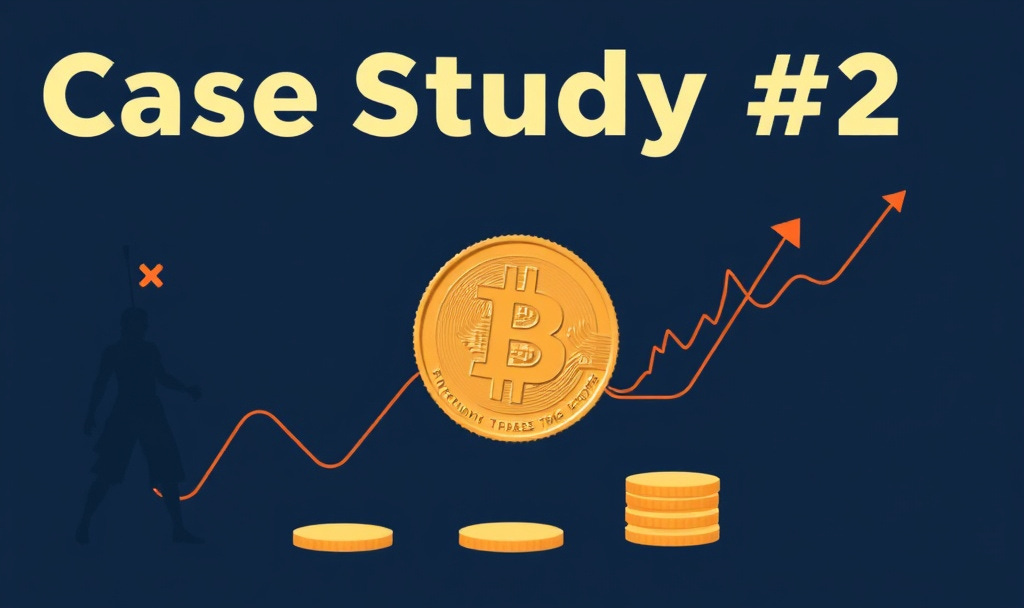
Case Study 2: Bitcoin and the Revenge Trade Cycle
This scenario highlights the danger of winning and losing in quick succession.
Trade 1: Shorted Bitcoin at 93k/95k. Won the trade (Quick TP).
Trade 2: Attempted to long the knife catch immediately after. Stopped out.
The Result: One win, one loss. The PnL is flat.
The Psychology of FOMO
The trader immediately entered a third trade. Why? Because the brain wants to return to the state it was in 30 minutes ago the state of being a “winner.”
The Behavior: This drives FOMO entries. It is no longer about the chart; it is a fight for survival of the ego.
The Escalation: The trader held onto a losing position for an hour, then added to the position at the Stop Loss area to “save it.”
Key Takeaway: You cannot “save” a trade. Trying to save a trade is an emotional attempt to deny reality. Two or three episodes of this behavior will send an account to zero, regardless of your technical skill.

Case Study 3: USD/JPY and the “Hope” Strategy
The trader shorted USD/JPY based on a “gap close” theory.
The Stats: We know statistically these gaps fill. However, on bigger gaps, the market can take 6 to 8 months to find the peak, and price can travel 800 to 1200 pips away from the gap before reversing.
The Mistake: The trader entered early based on “hope.”
The Lesson: “Hope” implies you have outsourced the trade to emotions. If USD/JPY continues to rally (which the data suggests it might), the trader is tied up in a red trade for months. The emotion will eventually force a double-down or a panic exit, likely right before the actual reversal occurs.
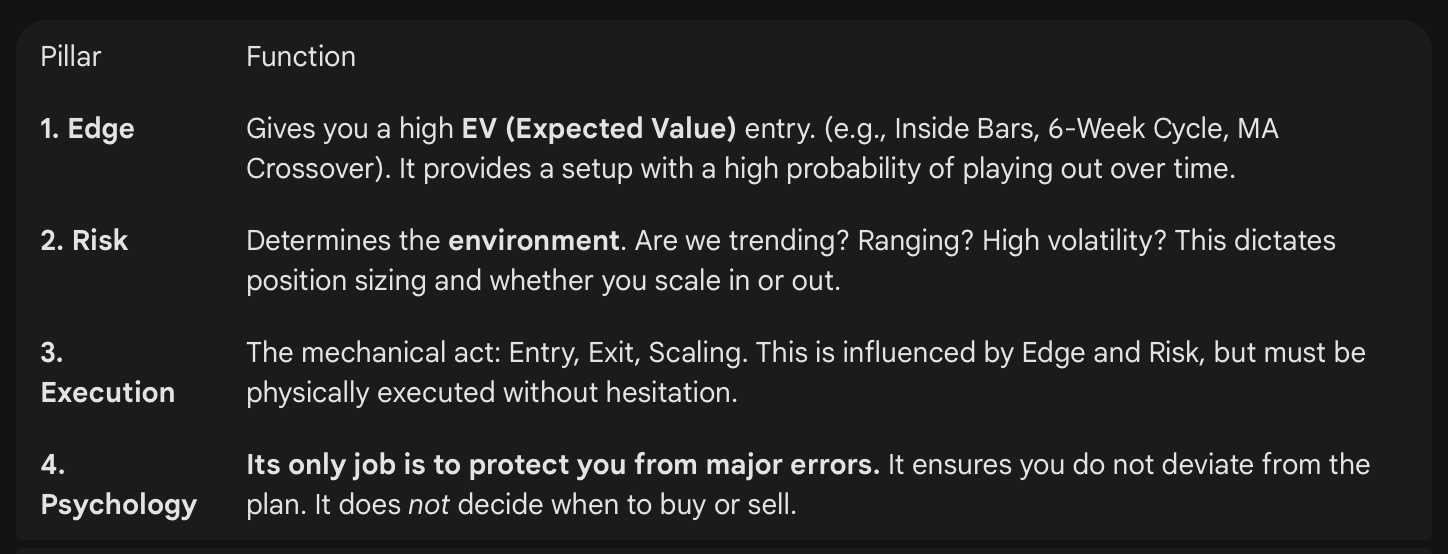
The Four Pillars of Trading
To combat the “Cave Brain,” we must strictly categorize our trading activities into four distinct pillars. Psychology is not there to decide your entry or exit.
Market Analysis: The Risk Suite
We use a specific suite of indicators to determine if we are “Risk-On” or “Risk-Off.” Currently, the data supports a bullish bias.
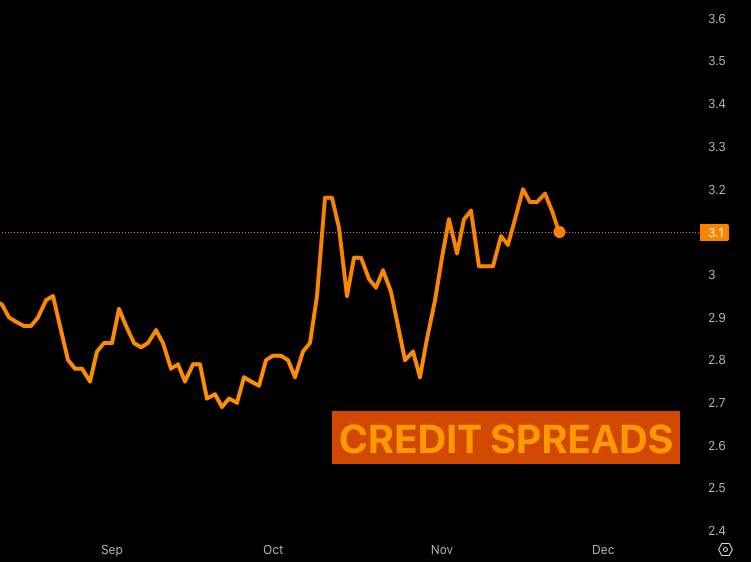
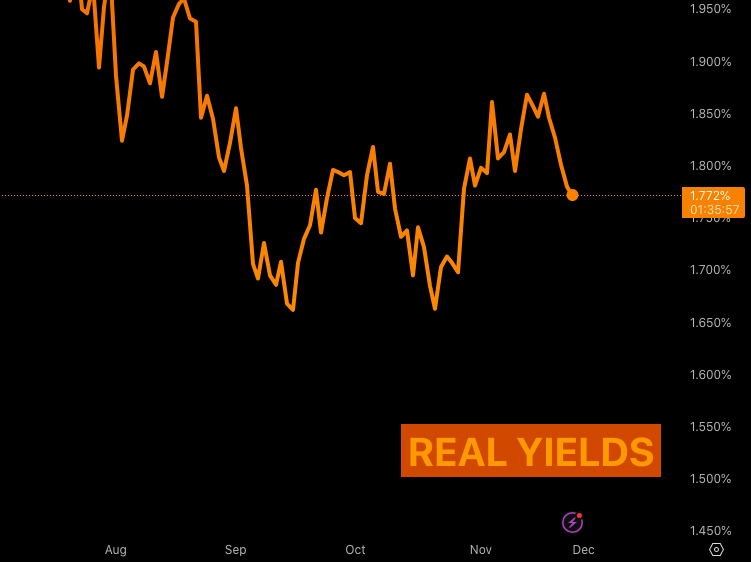
Real Yields & Credit Spreads
Real Yields: Currently sitting just under 1.8%. Since mid-September, this was moving up, but it is now dipping. When Real Yields move down while stocks move up, we are in a classic Risk-On environment.
Credit Spreads: This measures the difference between government and corporate bond yields. Spreads have been rising (bad), but as of Monday/Tuesday, they found a ceiling.
Bitcoin Correlation: If we invert the credit spread chart, massive spikes in spreads usually mark a bottom for Bitcoin. The current cooling of spreads is positive for the crypto risk complex.
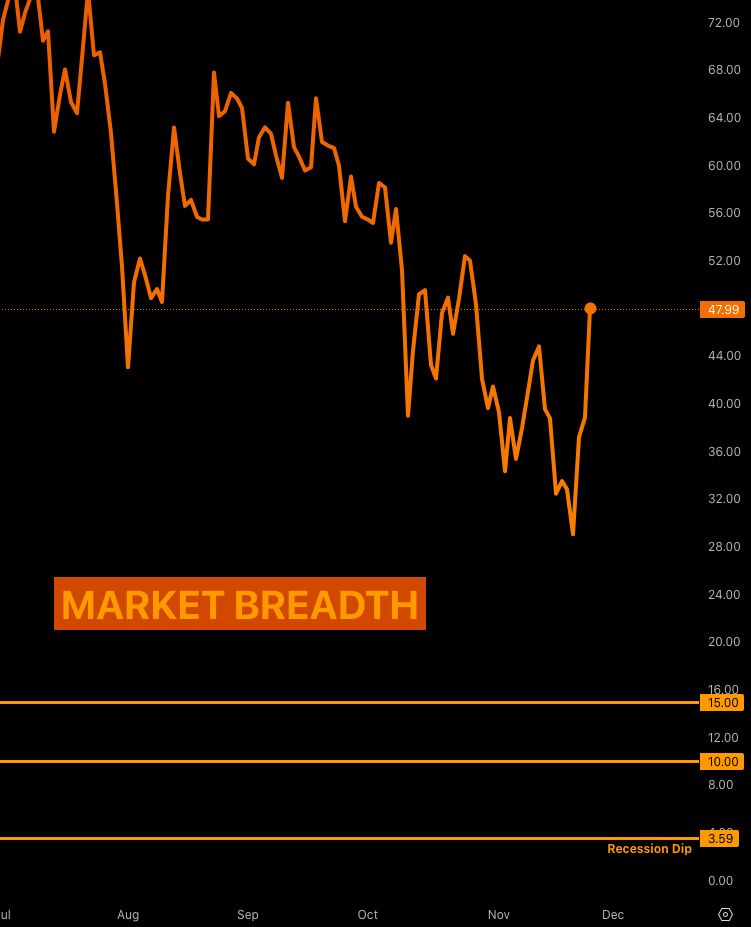
Market Breadth
Stocks >50-Day MA: This metric is moving back up. We aren’t in “recessionary dip buying” territory yet, but the market is finding a bid.
Bottom Caller Indicator: This proprietary tool performed perfectly last week, identifying the S&P 500 bottom. It remains a key signal for our bullish stance.
Indices and Commodities Outlook
Equities: The Bullish Cycle Continues
DAX: Pushed out of its 6-week cycle. It is unlikely to move back toward the 24,800 handle in this FED cycle. We anticipate a push higher starting mid-December (around the 16th/17th).
S&P 500: Bounced cleanly off our 75% time level (approx. 6600). Now pushing 6800.
NASDAQ: Analyzing the 6-peak cycle, it refused to push down from the 24k level. It has climbed 1100 points since the recent lows.
Outlook: The liquidity grab and fake-outs last week suggest the path of least resistance is UP.
Commodities: Gold and The Oil Dilemma
Gold: Showing zero signs of fatigue. It had an interim top on Oct 17th (4400), dipped to 3891, and has since rallied $200-$300 to trade at 4155. We remain long (some from 3300).
Oil ($58): While the chart looks bullish, we scratched our long trade at break-even.
The Risk: Potential conflict between Venezuela and the US could cause volatility. However, war does not always mean “up.” The US may release strategic storage to dampen inflation.
The Verdict: Too many “unknowns” (war news vs. supply release). We do not want to profit from war stories or get caught in policy-driven volatility.
FX Deep Dive: The Yen Opportunity
The Yen pairs are setting up for what could be the trade of the year just not yet.
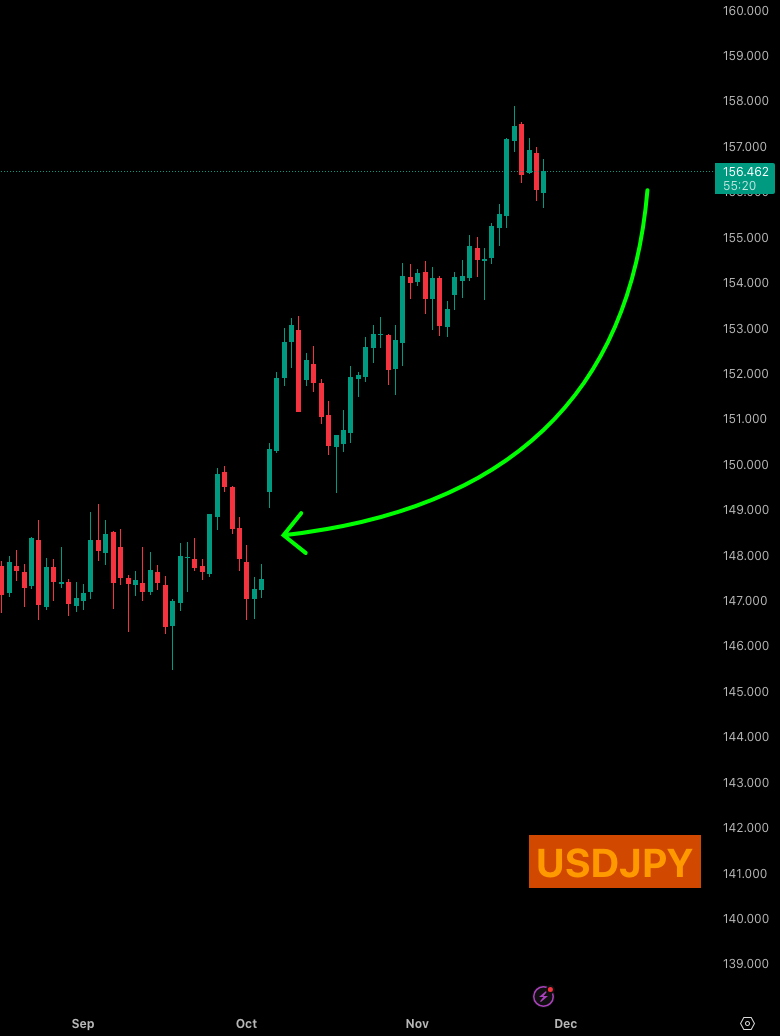
The Great Gap Fills
USD/JPY: Trading at 156.30. There is a massive gap open at 147 that is nearly 1000 pips of downside.
Euro/JPY: Trading high, but has an open gap at 173.36. This offers 400-500 pips of potential profit.
Strategy: We are waiting for a true “Risk-Off” trigger. When the reversal happens, shorting these pairs to close the gaps will be incredibly lucrative. For now, shorting is premature.
EUR/USD Dislocation
There is a current dislocation between EUR/USD and the Dollar Bond Yield Spreads. Typically, these move in tandem. Recently, they have decoupled. Until they correlate again, we are taking signals here with a grain of salt.
Crypto Markets: Finding the Bottom
Bitcoin & Solana
Bitcoin: Forming a potential bottom above 82k. We might see a dip to the 70k, 78k, or 79k handles, but as we approach the first week of December, liquidity should return.
Solana: Bounced off the 124 handle, trading near 140. Interestingly, during the recent meltdown, Solana picked up market share while BTC and ETH lost it. If you hold SOL-network coins, you are likely outperforming ETH holders.
The “Line in the Sand”: Stablecoin Dominance
We are watching the Stablecoin Dominance chart like a hawk.
The Threshold: 9%.
The Risk: If dominance pushes above 9%, we are looking at a proper meltdown. Above this level, liquidity for altcoins evaporates as capital flees to safety.
Current Status: It pushed 9% and is coming back down. As long as it stays below this level, the crypto market is safe from a total collapse.
Key Takeaways and Outlook
Check Your Head: If a trade goes one ATR against you, you are “asking for trouble.” If you are trading to “make back” money you lost 30 minutes ago, walk away. You are in “Cave Brain” mode.
Risk-On: The Risk Suite (Yields, Spreads, Bottom Caller) supports a continued rally in equities (S&P, NASDAQ) into December.
Yen Watch: Keep the 147 USD/JPY target on your radar. The 1000-pip drop will come, but patience is required.
Crypto Safety: Watch the 9% Stablecoin dominance level. Below it, we look for bottoms (BTC 82k, SOL 124). Above it, we flee to safety.
Disclaimer: This isn’t financial advice – just market musings from the charts. Always do your own research.
If you enjoyed this deep dive, please share it with fellow traders!
Trade Strong
Miad