

November Market Outlook: Tracking Liquidity flow across the board

Executive Summary
Welcome to our comprehensive analysis following the close of the earnings season and the latest FOMC meeting. As we transition into November, the market environment is shifting. We are entering what is typically a “slow period,” not in terms of returns, but in terms of volatility. The phase of significant volatility spikes appears to be behind us, setting the stage for potentially sustained upward movement in equities, driven by powerful seasonal trends and the reopening of corporate stock buyback windows. This analysis dives deep into the mechanics driving these trends, identifying critical patterns and high-probability trade setups across equities, cryptocurrencies, commodities, and forex.
The immediate outlook for equities is bullish, underpinned by technical signals from the Volatility Index (VIX). The VIX has confirmed an inside monthly candle failure, suggesting deflation in volatility and, consequently, an upward trajectory for the S&P 500. We explore the nuances of gap analysis in this environment, distinguishing between how gaps behave in bull versus bear markets. While open gaps on higher timeframes (like the 3-week chart) are notable inefficiencies, they often remain open during strong uptrends, only to be filled during the next recessionary event. The focus remains on riding the current uptrend rather than attempting to fade these gaps.
The NASDAQ (NQ) is poised for significant acceleration in November. Seasonality is a major tailwind, historically delivering strong returns as corporations aggressively buy back stock. Furthermore, a compelling correlation with the Nikkei (NI225) suggests NASDAQ is significantly lagging; Nikkei is up 18% this quarter compared to NASDAQ’s 9%, implying a potential catch-up target of 28,000 for the NASDAQ. Political narratives also support this move, as the current administration may aim to surpass the equity returns seen under the previous administration, requiring another 5-7% upside before year-end. However, traders should note that the market has posted seven consecutive bullish months, a record run. While an eighth month (November) is likely, a ninth (December) is historically unprecedented, suggesting potential chop or a bearish close to end the year.
A cornerstone of our equity analysis is the deep dive into the Microsoft (MSFT) and XLK (Technology Select Sector SPDR Fund) correlation. Exhaustive data analysis reveals that XLK’s returns and drawdowns are almost perfectly mirrored by Microsoft, regardless of the performance of other tech giants like Nvidia or Apple. Currently, XLK is outperforming MSFT (77% vs. 61% return from the April lows), indicating that Microsoft must accelerate to close this gap. Coupled with an inside two-month candle pattern—a high-probability bullish continuation signal for MSFT—this presents a compelling long opportunity, with extended targets reaching $650.
In other markets, Gold (XAUUSD) offers a precise swing long setup, contingent on defending the current quarterly low at $3819. Bitcoin (BTC) is emerging from a prolonged consolidation, defending a critical dynamic support trendline within a macro parallel channel. Its significant lag behind NASDAQ suggests a potential 30-40% catch-up rally, targeting $142K. However, caution is warranted for Ethereum (ETH); while bullish in the short term, a specific scenario involving its inside two-month candle pattern could trigger a major reversal at all-time highs.
Key Takeaways from this Analysis:
Volatility Deflation: VIX signaling lower volatility and higher S&P 500 movement in November.
NASDAQ Acceleration: Strong seasonal tailwinds, stock buybacks, and the Nikkei correlation point to a potential 9% upside in NQ.
Microsoft Thesis: The MSFT/XLK correlation and an inside two-month pattern suggest significant untapped upside in Microsoft, targeting $650.
Bitcoin Breakout: BTC is positioned for a major catch-up rally after months of consolidation, offering a 3.21 R/R setup.
Gold Swing Long: A high-probability setup defending the quarterly low, targeting new all-time highs.
Gap Strategy: Do not fade gaps in the current bull market; they are likely to remain open until the next major drawdown.
Post-FOMC Environment and Volatility Outlook
The market landscape is shifting as we move past the major hurdles of the earnings season and the FOMC meeting. We are entering a phase characterized not by a lack of returns, but by a decrease in volatility spikes. The heightened volatility witnessed over the past week is expected to subside, setting a specific trajectory for the Volatility Index (VIX).
VIX Analysis: Inside Candle Failures and Gap Fills
The VIX is currently exhibiting critical technical patterns that suggest an impending move lower. An inside 3-week candle failure pattern is in motion. While this pattern has not yet played out to its target—the bottom end of the wick at 14.33—the recent upward movement in the VIX can be explained simply. Last week, the VIX experienced a gap down, providing ammunition for it to tread higher temporarily to fill that gap.
Now that the gap has been filled, this inefficiency has been cleared. The path of least resistance should be “easy selling to the downside,” allowing the 3-week failure pattern to resolve over the next two weeks.
Furthermore, a higher timeframe signal provides confluence: we have confirmed an inside monthly candle failure on the VIX. This strongly suggests that the VIX should deflate throughout the next month. Based on the inverse correlation between the VIX and equities, if the VIX is going down, the S&P 500 is expected to go up.
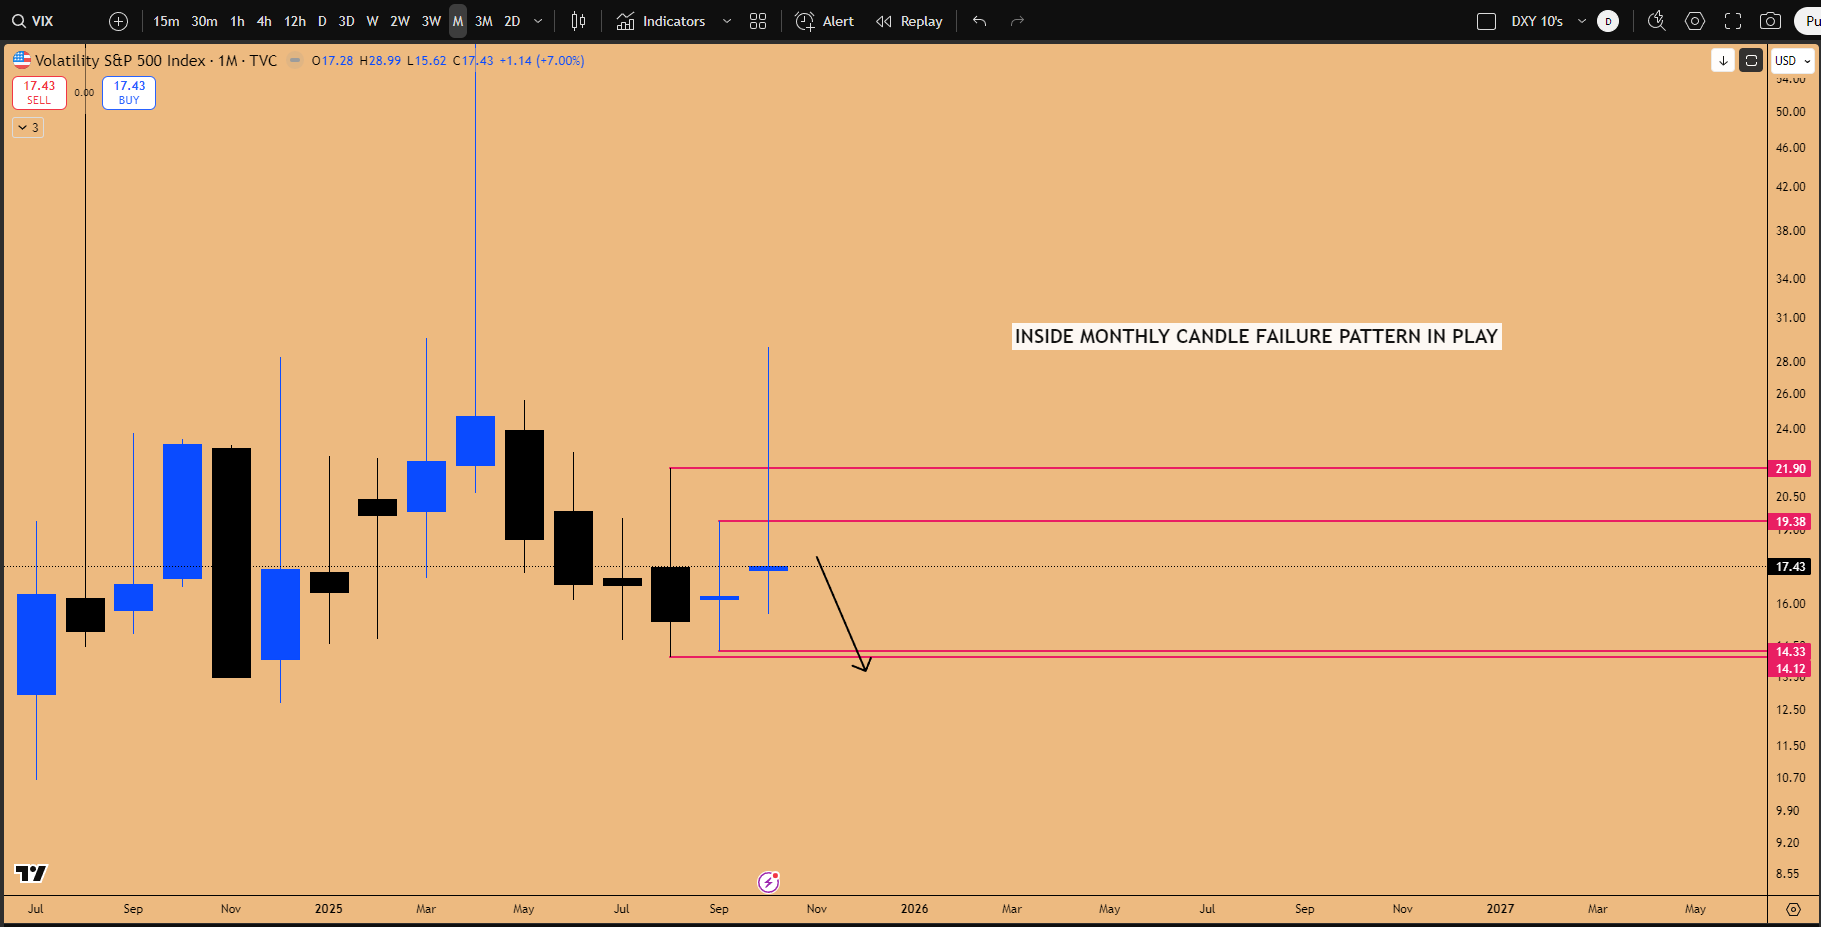
Figure 1: Inside Monthly Candle failure pattern suggesting VIX deflation
S&P 500 and NASDAQ Analysis: Gaps, Corrections, and Seasonality
The analysis of the S&P 500 (ES futures and SPX cash index) and NASDAQ (NQ) hinges significantly on understanding market inefficiencies, specifically gaps, and how they behave in the current bull market context.
The Mechanics of Market Gaps
A persistent focus has been on an open gap in the S&P 500, which the market has been taking its time to fill. This gap is significant because it is present on the 3-week chart. The market algorithmically dislikes leaving higher timeframe gaps open. Historically, massive gap-ups on 3-week candles almost always get filled before the market makes its next major move.
However, the timing of these fills is crucial. While the current open gap is “bothersome,” it may not get filled right away. The expectation is that such significant gaps will be filled during the next recessionary event.
Futures (ES) vs. Cash Index (SPX) Gap Fills
A key distinction exists between filling gaps on futures contracts versus the cash index.
Futures (e.g., ES): Futures are continuous contracts running 24/7. When a gap occurs in futures, the preference is to see the entire zone filled, right up to where the market had previously closed. This restores complete efficiency in the continuous contract.
Cash Index (e.g., SPX): In the cash index, it is not entirely necessary to fill the entire zone. The SPX chart currently has several open gaps, which may be annoying to look at. These gaps can remain open throughout the entirety of an uptrend. When the next drawdown or recession occurs—perhaps 5 or 6 months from now—these gaps will likely be targeted.
Historical precedent supports this. During past uptrends, multiple gaps remained open for months. When a recessionary event occurred, it neutralized all these gaps in one go, often without any retracement. For example, the COVID pandemic crash neutralized several long-standing open gaps. This neutralization often marks the stopping point for the market, as the entire efficiency was restored in the algorithm, leading to a massive bounce. Furthermore, these neutralized gaps often become future support zones once the market recovers and trades above them.
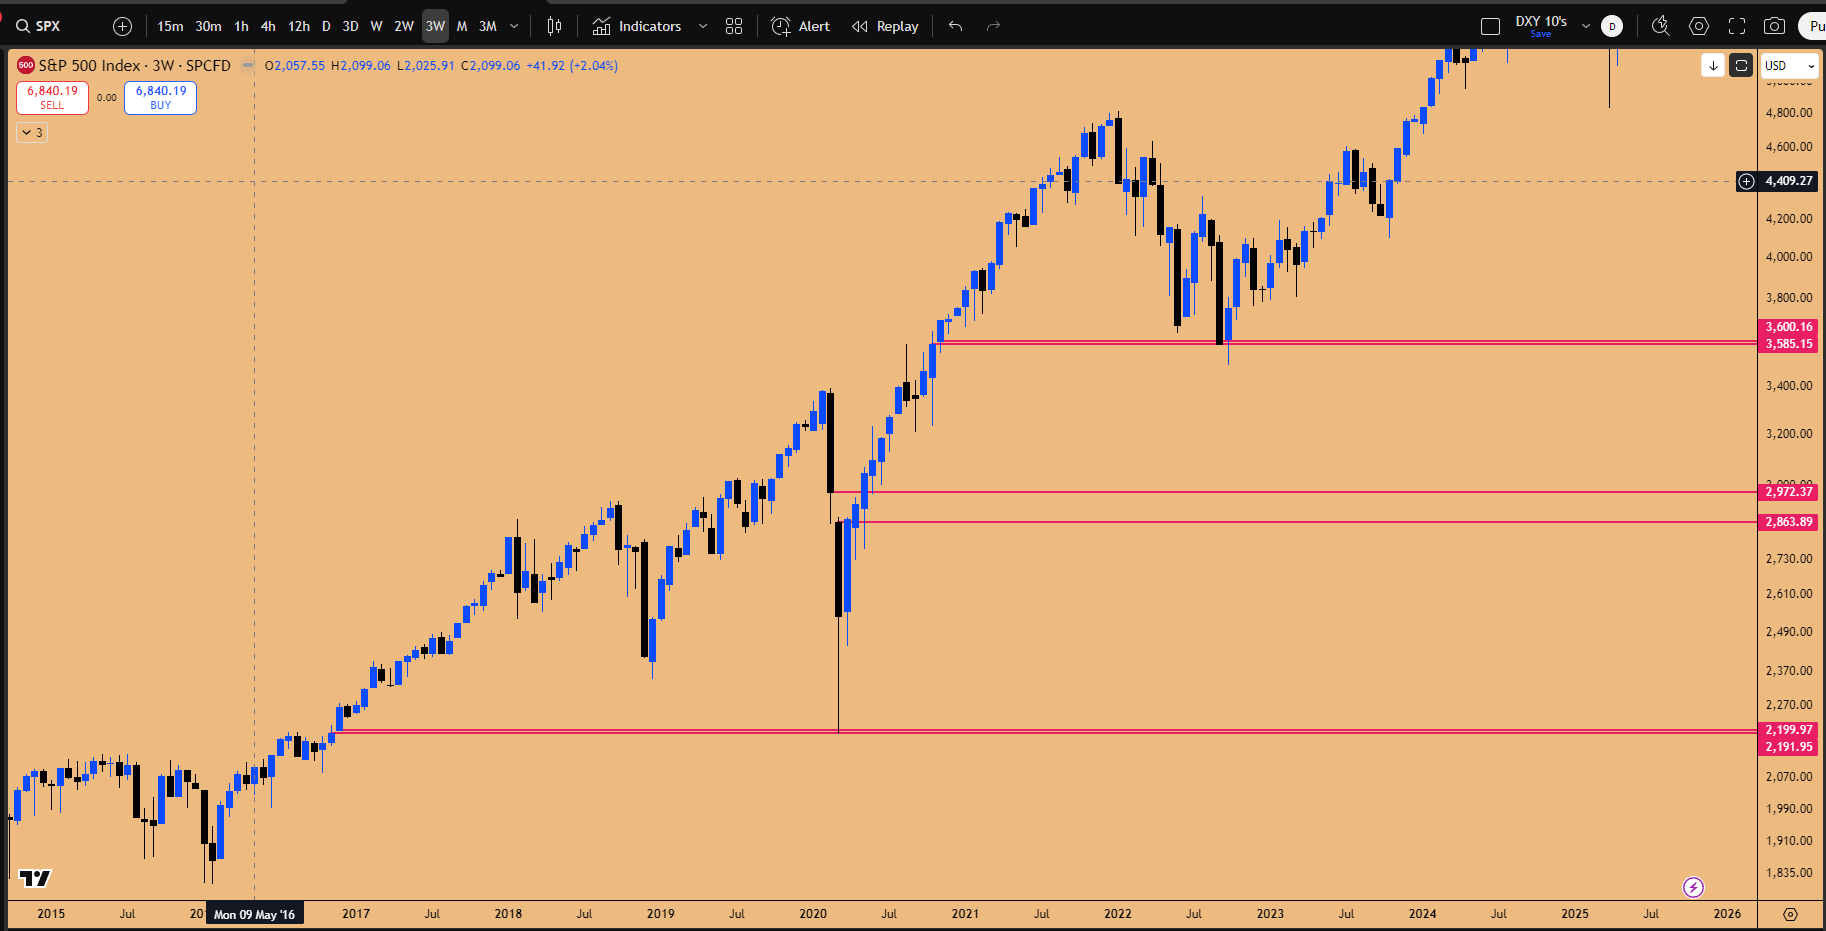
Figure 2: Open gap’s targeted for Gap fill during Recessionary events
Identifying Market Bottoms Through Inefficiency Resolution
Understanding how gaps are resolved is critical for identifying true market bottoms. A key principle is that the market will never, ever form a bottom when there is an open gap present below the price action.
The 2022 recession provides a clear example on the 3-week SPX chart. During the drawdown, the market bounced, leaving an open gap below. It created an inside 3-week candle and jumped, failing to fill the gap. Many participants might mistake this for a bottom. However, the market later created a new open gap (inefficiency) to the upside, while the draw remained the open gap below. The market eventually went down to neutralize the lower gap.
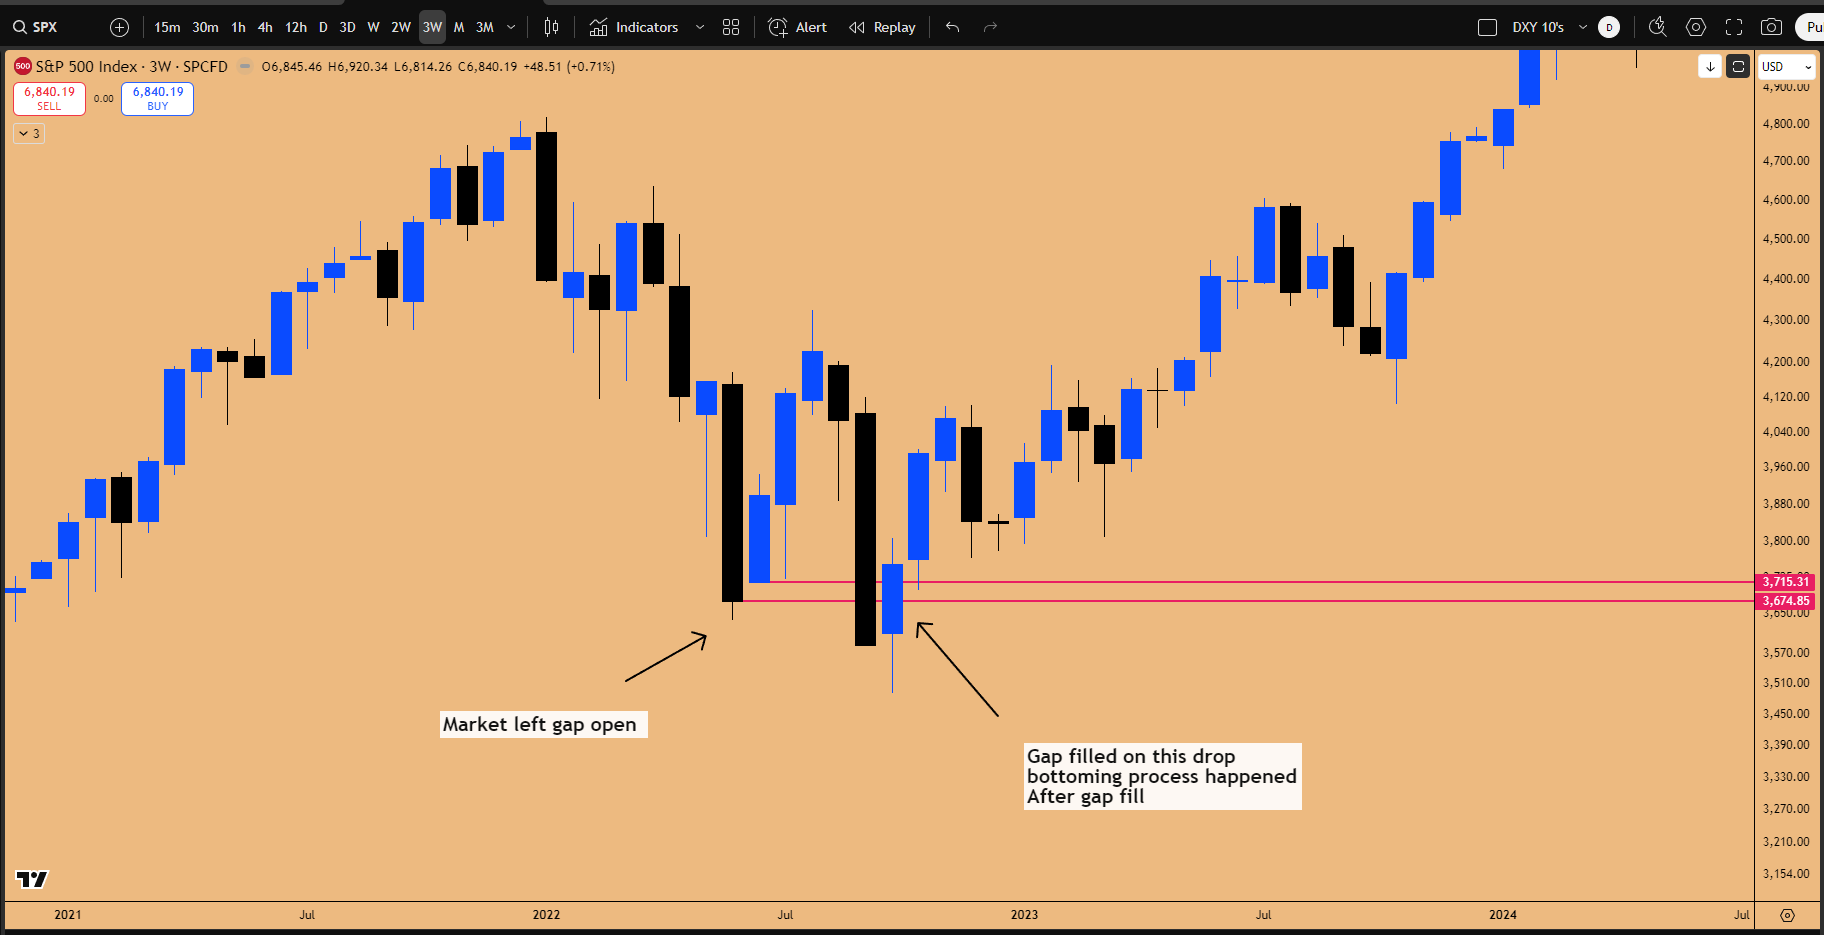
Figure 3: Open Gap filled on 3-week chart before a bottom could be carved
Trading Strategy: Gaps in Bull vs. Bear Markets
The strategy for trading gaps depends entirely on the prevailing market regime.
Bear Markets/Drawdowns: If the market is undergoing a significant drawdown (e.g., down 20% due to events like trade wars or geopolitical conflict), and bullish news comes over the weekend causing the market to gap up, this gap should be ignored or faded. Never, ever, ever trade the market when it is gapping up in a drawdown scenario. That open gap will eventually get filled, and buying the gap up will likely result in getting faded. In bear markets, the volatility ensures open gaps are filled quickly.
Bull Markets: When a massive uptrend is ongoing and bullish weekend headlines cause a gap up, those gaps can remain open for a prolonged period—2 months, 3 months, 5 months, or 6 months—until the next recessionary phase. Do not try to fade every gap in a bull market. However, if the market does come down to fill an open gap, that area should act as a strong support zone.
Bull Market Corrections and the “Hot Air” Phenomenon
In the current bull market, understanding the nature of corrections is vital. When the market prints many consecutive bullish weekly candles (e.g., seven, eight, or nine in a row) and then produces one giant selloff candle, that is generally the entirety of the pullback.
In bull markets, corrections are very fast. They are sharp and typically end within one or two weeks. Their purpose is to drive fear and force investors to panic-exit their positions, after which the market will form a bottom and execute a U-turn reversal to tag the previous all-time high.
This dynamic creates what is known as “hot air.” When the market comes down in a straight line (like the giant selloff candle), there is no structural resistance formed during that move. Therefore, the market can go back up in a straight line just as easily. This hallmark of bull markets is also visible in assets like Gold.
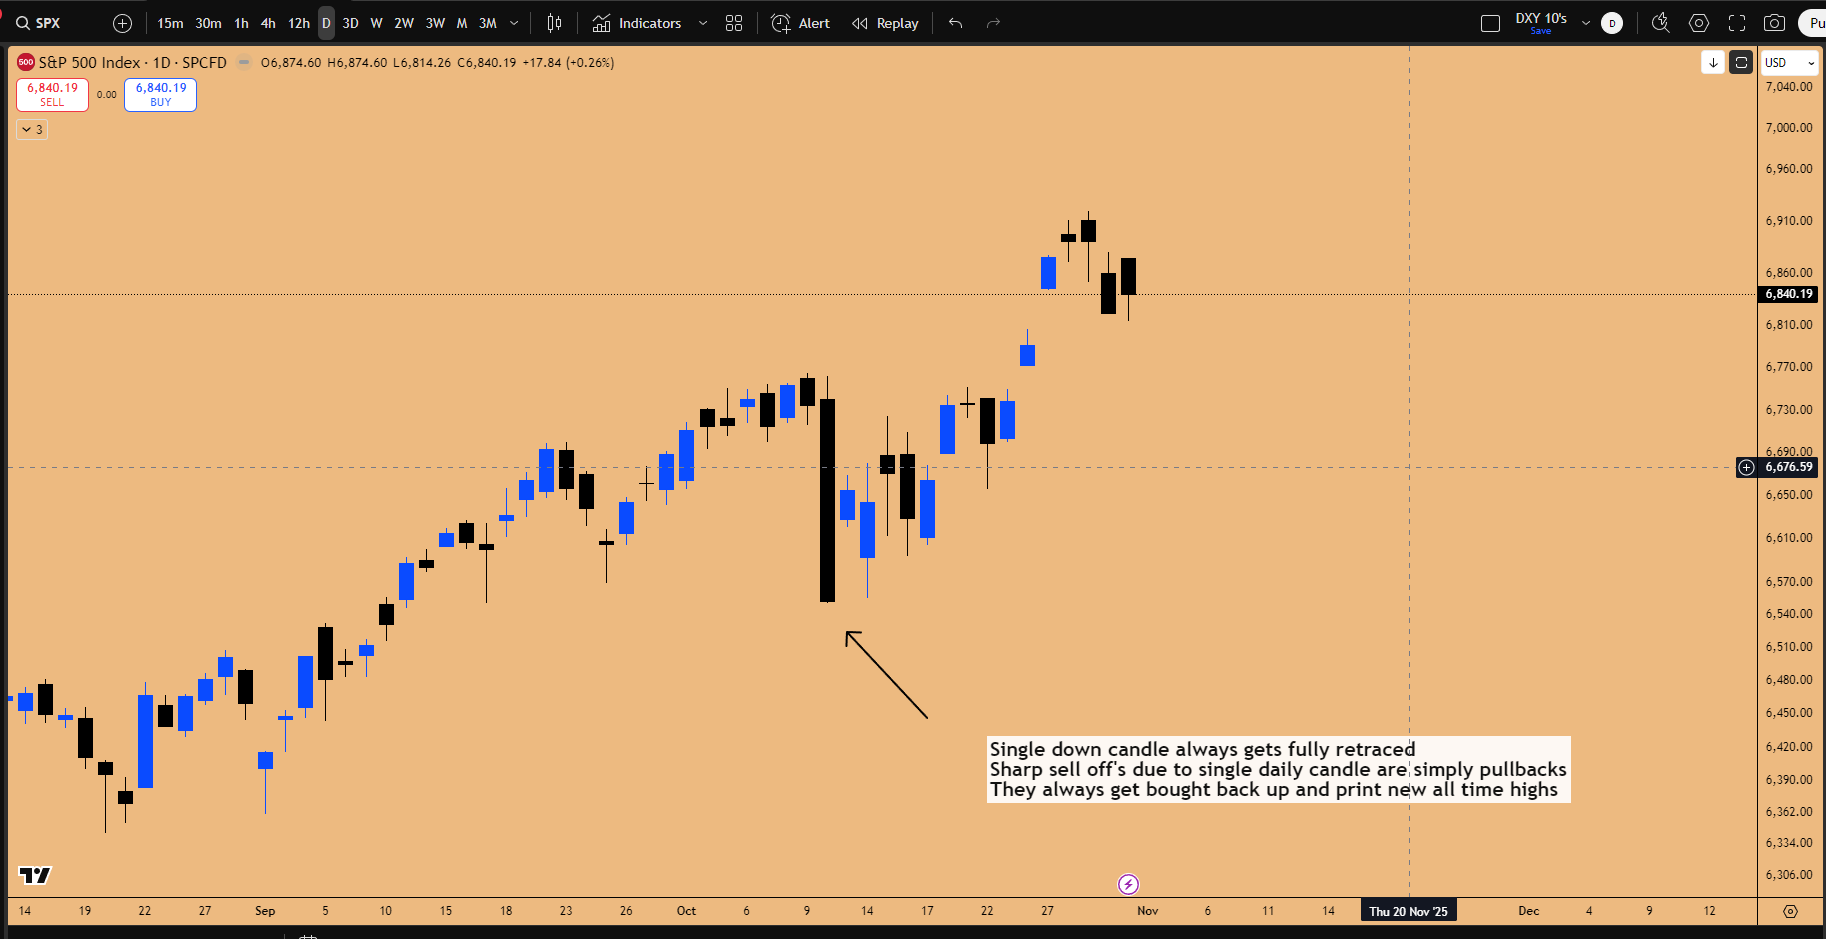
Figure 4: Market undergoing a full reversal after posting a sharp sell off candle
Current S&P 500 Gap Status
Regarding the current open gap on the S&P 500 weekly and 3-week charts, it remains an issue for the market. While a partial fill is desirable, traders should not hold their breath that it has to get filled now. As established, gaps can remain open in a bull market and be filled months down the road during a future drawdown. The priority now is to ride the uptrend with proper risk management, rather than preemptively shorting based on the open gap.
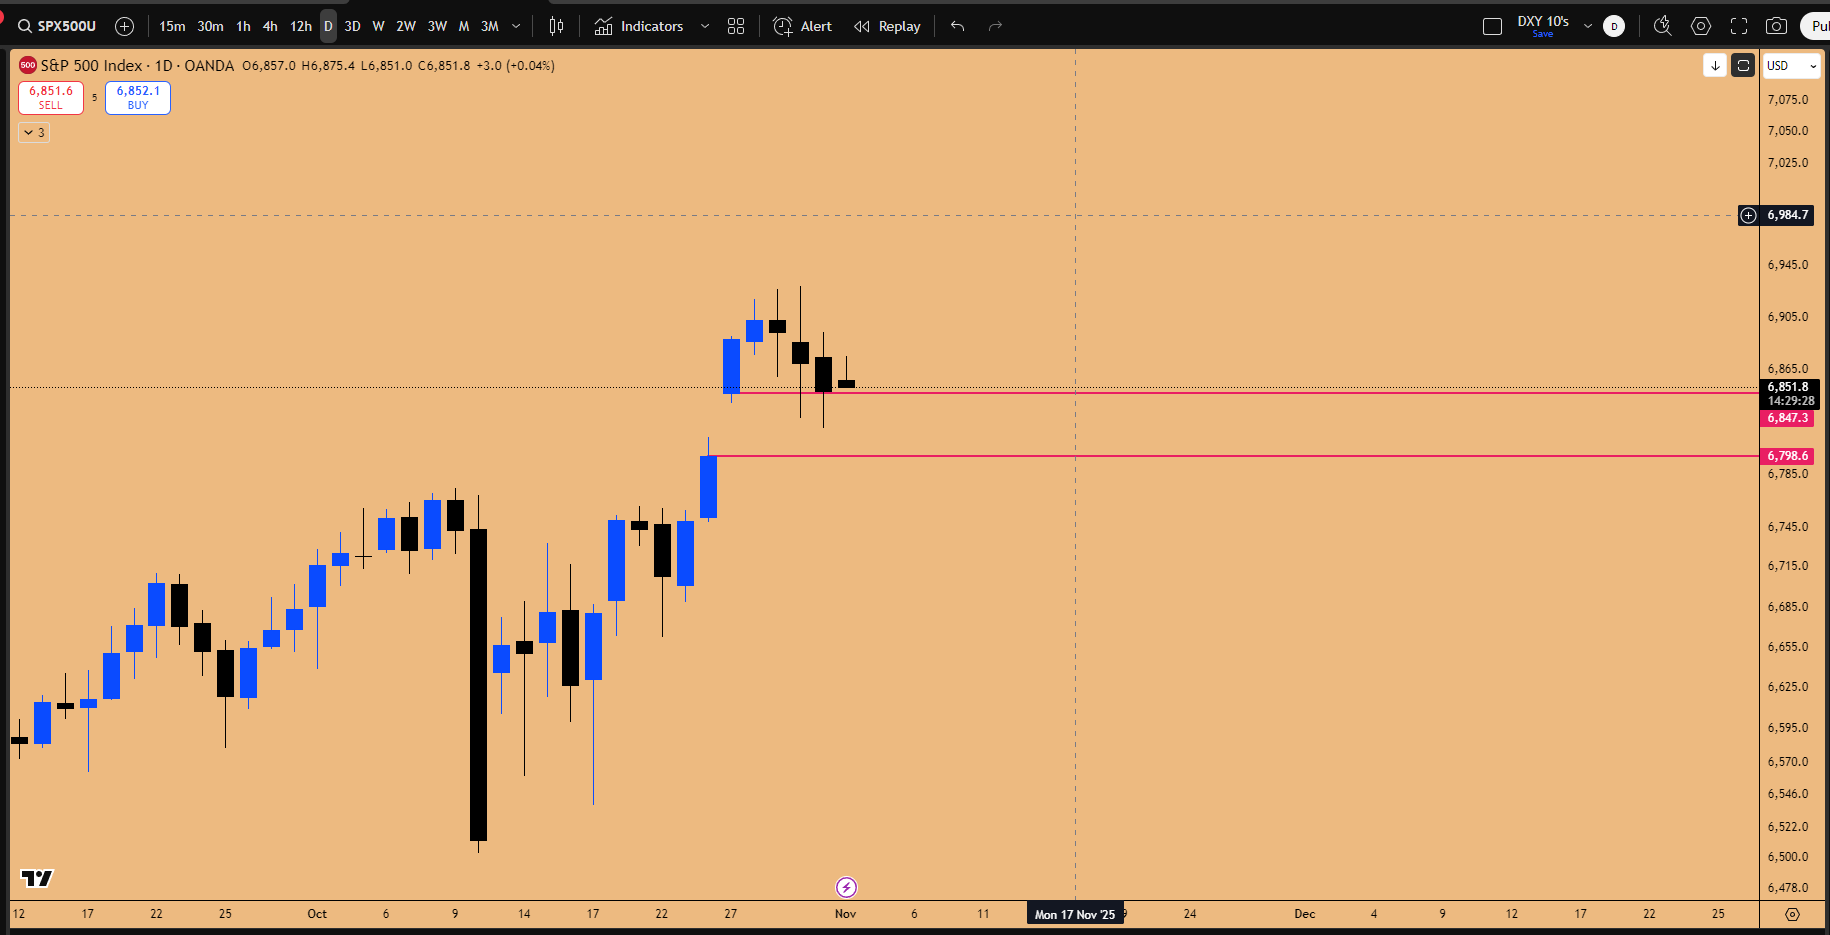
Figure 5: Gap Fill’s in Bull Market Corrections
NASDAQ Seasonality and the November Outlook
The outlook for the NASDAQ entering November is exceptionally bullish, driven by strong seasonal trends and fundamental catalysts. The current technical stance maintains a bull-bear line (stop loss) at 24,270 for the NDX index.
November is notorious for its bullishness. Seasonally speaking, the market generally ends November significantly higher than it started. This has been the case for the past four years. The primary reason for this is stock buybacks.
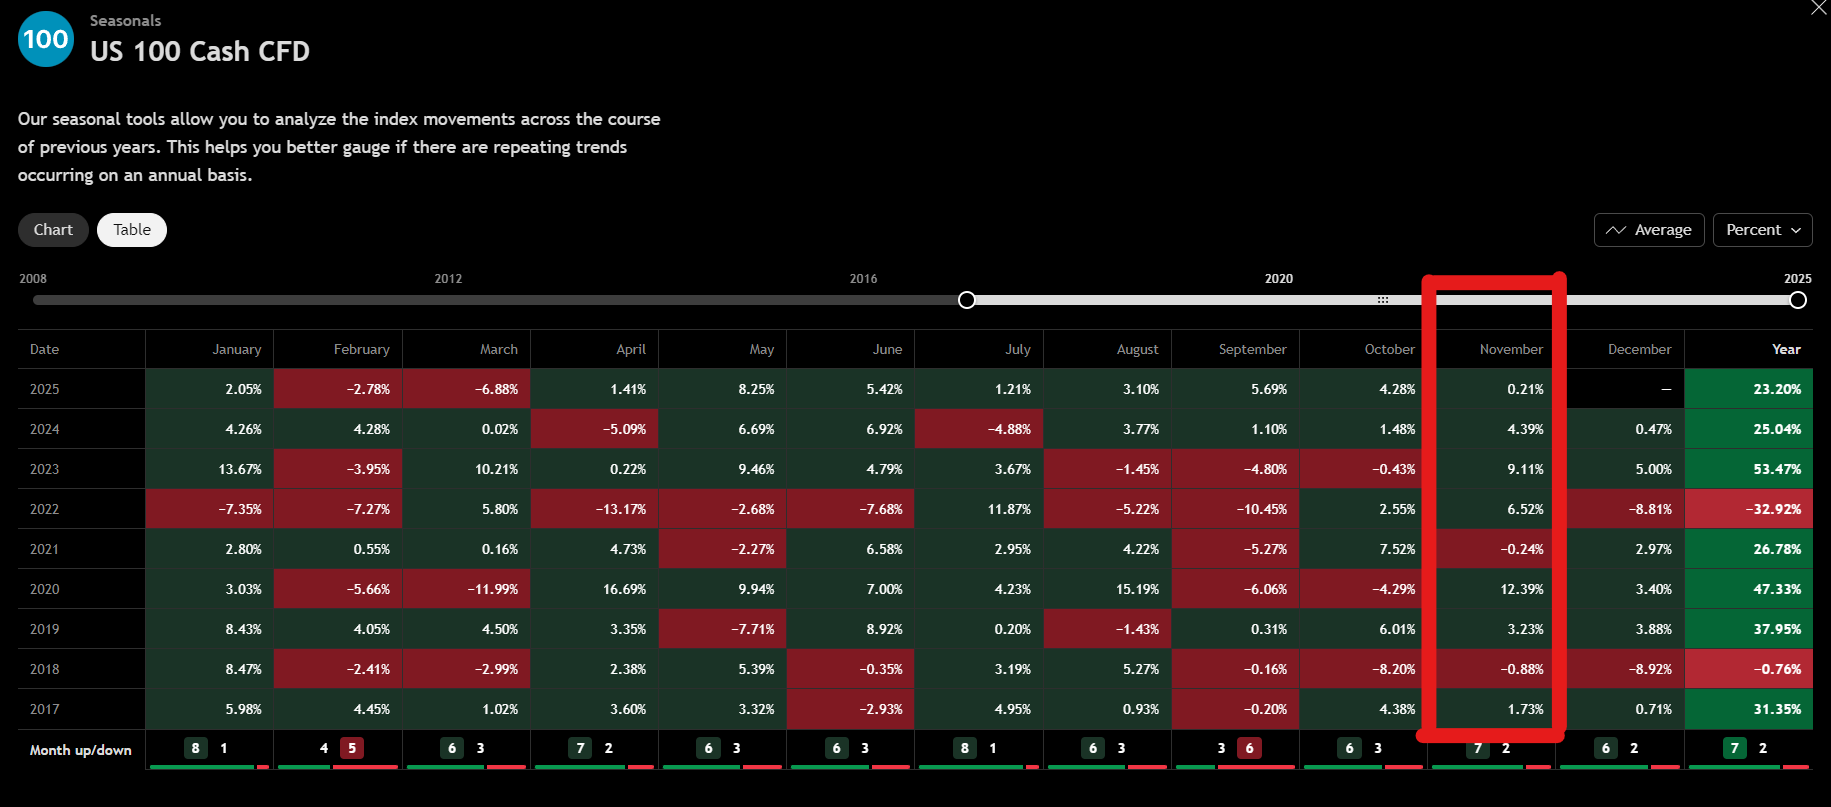
Figure 5: Return’s captured in the month of November (2017-2025)
The Power of Stock Buybacks
The earnings season is now complete. This means the blackout period for large companies is ending, and the stock buyback window is opening starting this week. Large S&P 500 companies use stock buybacks to boost their equity allocations, creating a major tailwind for the index.
A look at the seasonality table for the past 10 years confirms November’s strength. The only mildly negative November in recent history was 2018, during the reverse repo market blow-up and heavy drawdowns. Even then, November tried to hold its ground due to the massive influx of buybacks.
Consecutive Bullish Months and Future Concerns
There is one cause for concern regarding the sustainability of the current rally. From the recent bottom, the markets have gone up in a straight line for seven consecutive months. This is a record run. While it is possible this extends to an eighth consecutive bullish month (November), historical data suggests that nine consecutive bullish months have never been seen. Eight candles in a row are common, but nine are unprecedented.
Implication: If November is bullish, chances are December will see sideways chop or close the month bearish as the market prepares for the new year.
The NASDAQ and Nikkei Correlation: A Significant Lag
A critical correlation suggests that the current quarter is far from over for the NASDAQ. The Nikkei (NKD) serves as a direct proxy for the NASDAQ. Comparing the quarterly candles reveals a significant divergence: the Nikkei’s current quarterly candle is far larger than its previous one, whereas the NASDAQ’s current quarterly candle is not yet bigger than the previous one.
Since the April 2025 bottom, Nikkei has been outperforming NASDAQ. With the strong seasonality and the reopening of stock buyback windows, it is highly likely that NASDAQ will take charge and catch up.
The Data:
Nikkei Quarterly Return: +18%
NASDAQ Quarterly Return: +9%
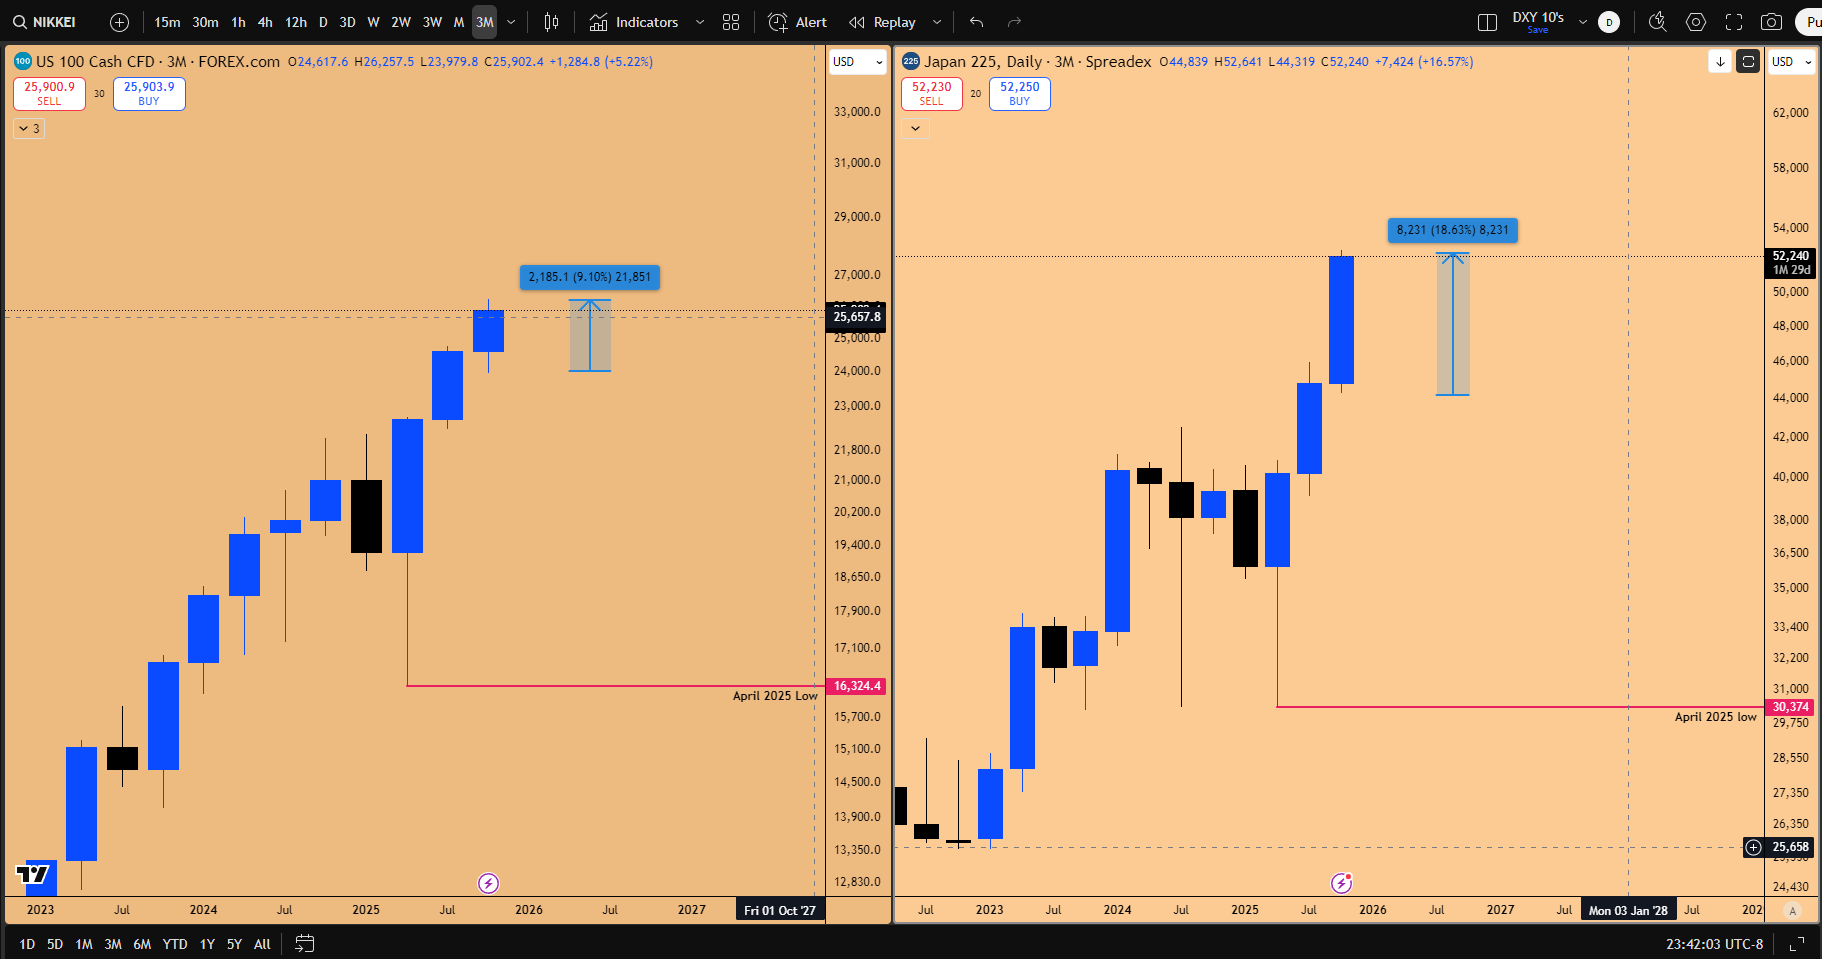
Figure 6: NAS100 vs Nikkei 225 returns for Q4, 2025 (so far)
For NASDAQ to match Nikkei’s performance, it needs to reach 28,000. This represents another 2500 points or a 9% return from current levels. This is entirely feasible, given the performance of individual components. For example, Oracle, now one of the Mag Seven, rallied 40% post-earnings and is up 58% from its bottom. If trillion-dollar companies can move 40-50%, a 9% move in the NASDAQ is merely a “drop in the bucket.”
Nvidia’s Role
Nvidia (NVDA) remains crucial for the entire index structure. Nvidia reports earnings on November 19th, 2025. The market generally remains supportive going into Nvidia’s earnings; it will not sell off ahead of the event. This “market ritual” suggests no significant drawdown is likely until after November 19th. The expectation is for Nvidia to beat earnings, potentially moving up 5-6%, pulling the NASDAQ along with it.
The Microsoft Thesis: Unlocking Upside via the XLK Correlation
A deeper analysis into the drivers of the NASDAQ reveals a powerful, data-driven thesis centered on Microsoft (MSFT) and its relationship with the XLK ETF (a concentrated tech ETF that dictates the broader QQQ). This correlation indicates significant untapped upside in Microsoft.
The Core Correlation: Microsoft Dictates XLK
The XLK ETF is more concentrated than QQQ, heavily weighted with Nvidia, Apple, Microsoft, and other large software companies.1 Analysis of the monthly chart data since XLK’s inception reveals that the ETF’s entire return structure, including the shape of its formations and the magnitude of its drawdowns, is a direct carbon copy of what Microsoft looks like.
While Nvidia has gone vertical recently, its trajectory is very different from XLK. The data confirms that Microsoft has been the primary driver of XLK historically.
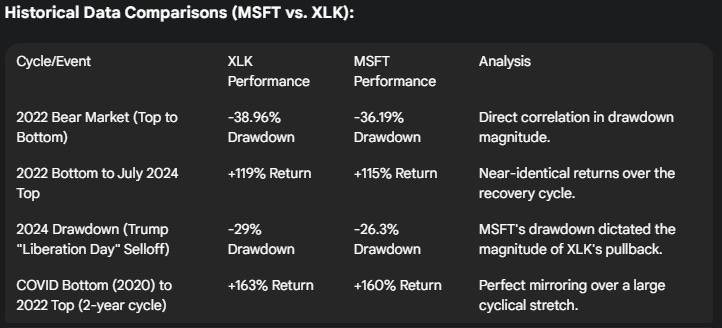
This is not a coincidence; it is algorithmic data demonstrating that the XLK ETF is fundamentally tuned to Microsoft’s performance. Microsoft dictates what XLK is going to do, regardless of the performance of Apple, Amazon, or Nvidia.
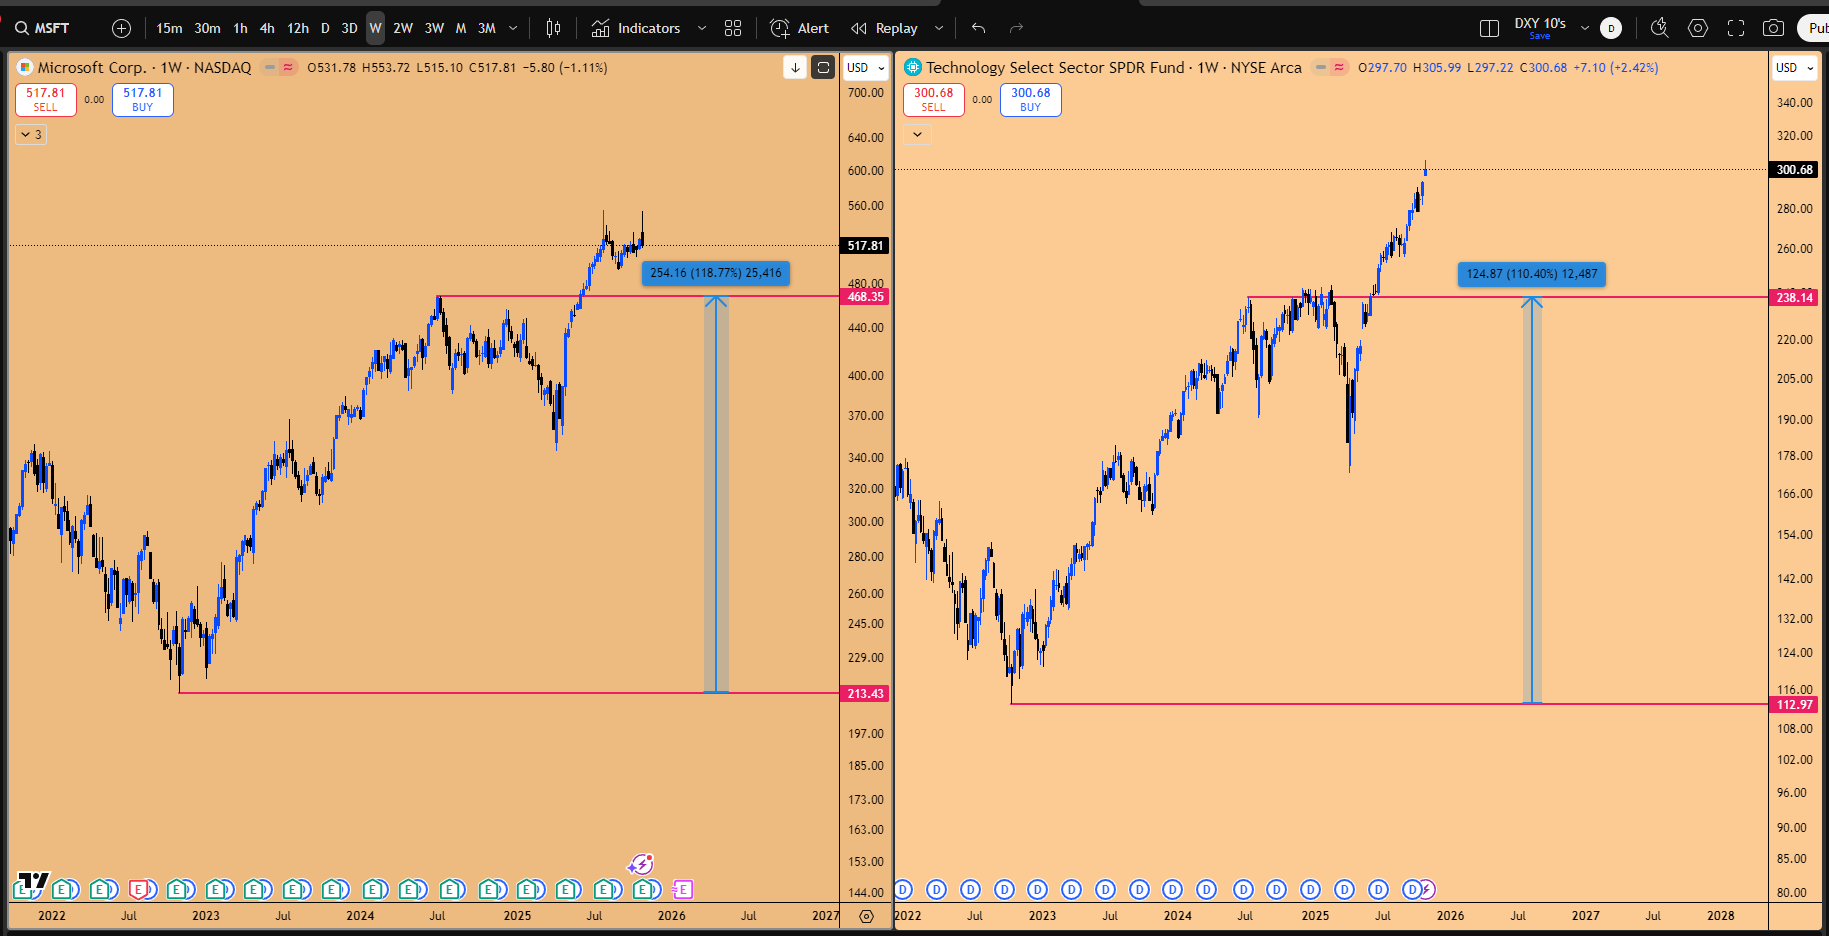
Figure 7: MSFT vs XLK returns from October 2022 bottom till December 2024 top
The Current Divergence and Trade Rationale
The significance of this correlation lies in the current divergence between the two assets since the cyclical bottom in April.
XLK Return (April bottom to present): +77%
Microsoft Return (April bottom to present): +61%
This divergence does not mean XLK will pull back; it means that Microsoft has further to go and must reach at least a 77% return to be in sync with the ETF. While other components like Nvidia, Apple, and Google have been allowed to run, pushing XLK higher, Microsoft has been on pause. The premise is that Microsoft is the asset to be positioned in, rather than the already extended ETF, as there is significant upside potential for Microsoft to catch up.
Figure 8: MSFT vs XLK since April 2025 bottom, MSFT has catching up to do
The Inside Two-Month Candle Pattern
Microsoft is currently forming an inside two-month candle. This is a consolidation pattern. Rigorous historical analysis reveals that Microsoft has almost always broken out from inside two-month candle patterns to the upside. In instances where it did not break out immediately, it might go sideways or execute a stop run lower, but the subsequent candle ultimately breaks out and moves higher. This high-probability pattern provides a strong technical basis for the long position.
Extended Targets and Outlook
If the pattern breaks out, the initial move (catching up to XLK’s current 77%) implies a 15% upside for Microsoft. However, the outlook extends beyond this initial catch-up.
Given the bullish seasonality for NASDAQ in November and the need to catch up with the Nikkei, NASDAQ and XLK are expected to accelerate further. If XLK moves another 5-7%, pushing its total return to perhaps 90%, then Microsoft must also reach a 90% return from the April bottom to maintain the correlation.
Extended Target: A 90% return implies a target for Microsoft of at least $650.
This represents a 26% upside from current levels. While achieving this by year-end is difficult, it is not impossible; in the last two months of 2021, MSFT rallied 24%. However, the strategy accounts for a longer timeframe, utilizing option expirations for February and April of next year. Based on the correlation, positions will be held beyond initial targets (like $555) toward $600 and beyond.
Supplementary Seasonality Data
A detailed analysis of Microsoft’s returns for the months of November and December, dating back to 1987, supports the bullish outlook. The average return across its entire history for this two-month period is +8.6%. This includes periods like the 2001 tech bubble burst (-41%) and the 2008 recession.
Post-2008, the performance has been consistently strong, driven by the powerful effect of stock buybacks by the $250 billion Annual revenue company. From 2020-2025, Microsoft has been positive in the last two months of the year for six consecutive years. If the average 8.6% return is achieved this year, it implies a target of $563, coinciding with the presence of the rainbow pattern on the chart.
Risk Management and Position Sizing
Managing risk on this high-conviction trade is paramount, especially given the higher timeframes involved. The technical stop loss for the inside two-month pattern would be a close below the pattern low at $492, representing a 6% move to the downside in the stock.
However, because historical data does not show instances of inside two-month candles failing catastrophically to the downside immediately, the approach is nuanced. A wick below the low is not a stop-out; a full candle close below the low is required.
The position sizing reflects high conviction based on rigorous testing and cross-market correlation. This highlights a philosophy of concentrating risk on high-probability setups, emphasizing that traders must assess their own comfort levels rather than mirroring this aggressive allocation.
Regarding contract selection, rolling February contracts to April is acceptable to buy more time, though the February contracts were specifically selected to play the initial Inside Monthly Candle Failure breakout.
Precious Metals: The Swing Long Setup in Gold
Equities analysis is largely covered, shifting focus to Gold (XAUUSD), which presents a very good pattern currently in play based on a top-down analysis.
Gold (XAUUSD) Top-Down Technical Analysis
Gold is in a massive uptrend, consistently defending every quarterly low since the bottom was printed.
Quarterly Timeframe: The bias is that the current quarterly low is set in stone because the price is trading above the quarterly open. The expectation is that the market will defend this low and not come below the quarterly open.
Monthly Timeframe: The current low is also the October month’s low. In a bullish breakout, the previous month’s low should not be broken.
3-Week Timeframe: Price has come down to the 3-week low but has not taken out the previous 3-week’s low.
Weekly Timeframe: An inside weekly candle pattern occurred. The market took out the lows and almost closed as a failure. It closed right below the latest weekly candle’s low, rating it a solid 7.5 out of 10 for a failure pattern.
3-Day Timeframe: An inside 3-day candle is currently printing.
The critical area of interest is a very strong support center where the monthly open and the quarterly open reside, making the corresponding down candle extremely powerful support.
The Gold Trade Setup and Rationale
The setup anticipates a potential final sweep of the recent lows, offering an excellent entry point.
The Setup:
Scenario: If the market has not yet bottomed and the next weekly candle (or the one after) comes down to execute a final sweep of the lows.
Entry: Limit order to buy Gold just below the sweep, targeting the strong support zone (Monthly/Quarterly opens).
Stop Loss: Right below the Quarterly Low.
Target: Ride the position all the way up to the all-time highs.
Invalidation: If the quarterly low gives out, it signifies a massive correction, and all long positions should be exited.
The rationale is that this pullback is forming the next higher low in the macro uptrend. Once confirmed, the expansion towards new all-time highs should resume, based on the bullish quarterly chart structure. This setup offers a strong risk-reward ratio, supported by a daily bullish order block and the inside weekly candle failure pattern.
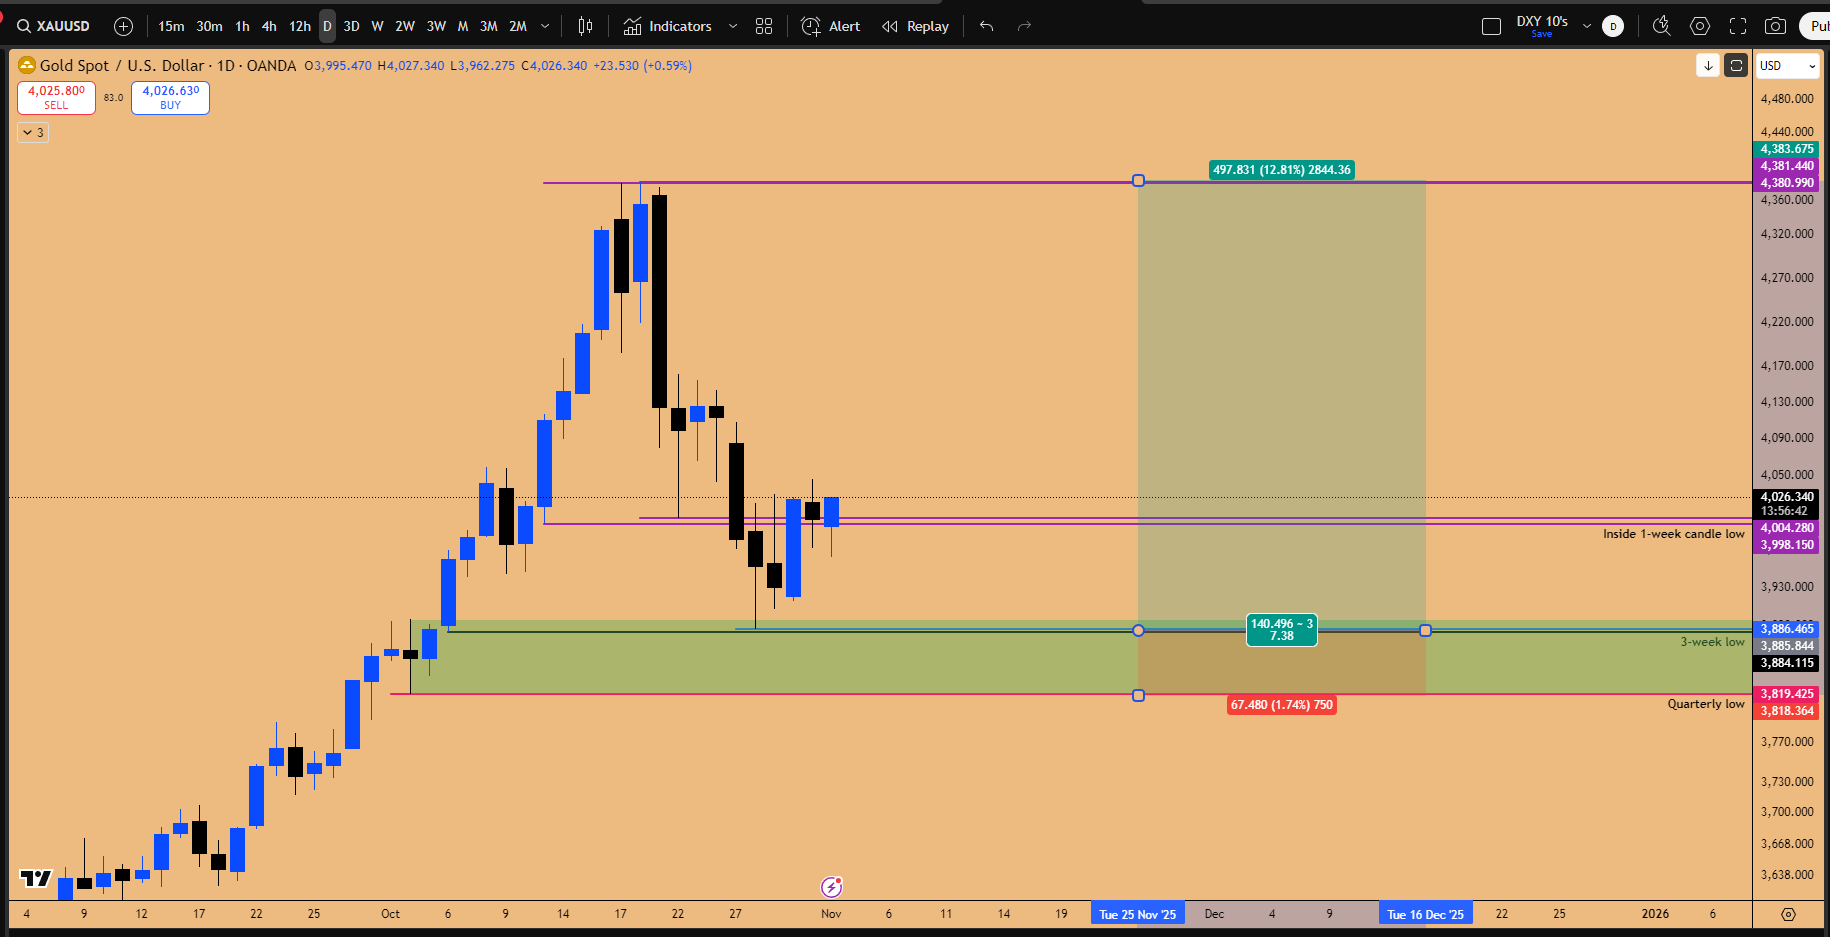
Figure 9: Gold Trade Setup in Play
Potential Trading Vehicles
There are multiple ways to execute this trade:
Gold Futures (GC): Enter and hold GC future contracts.
GLD ETF Options: Take option contracts (calls) in the listed Gold ETF, GLD, once the long entry triggers.
Gold Mining Companies: Take a position in gold miners, which correlate strongly with the price of gold. AEM is preferred as it is a large-cap miner with a minimal pullback and a very intact uptrend.
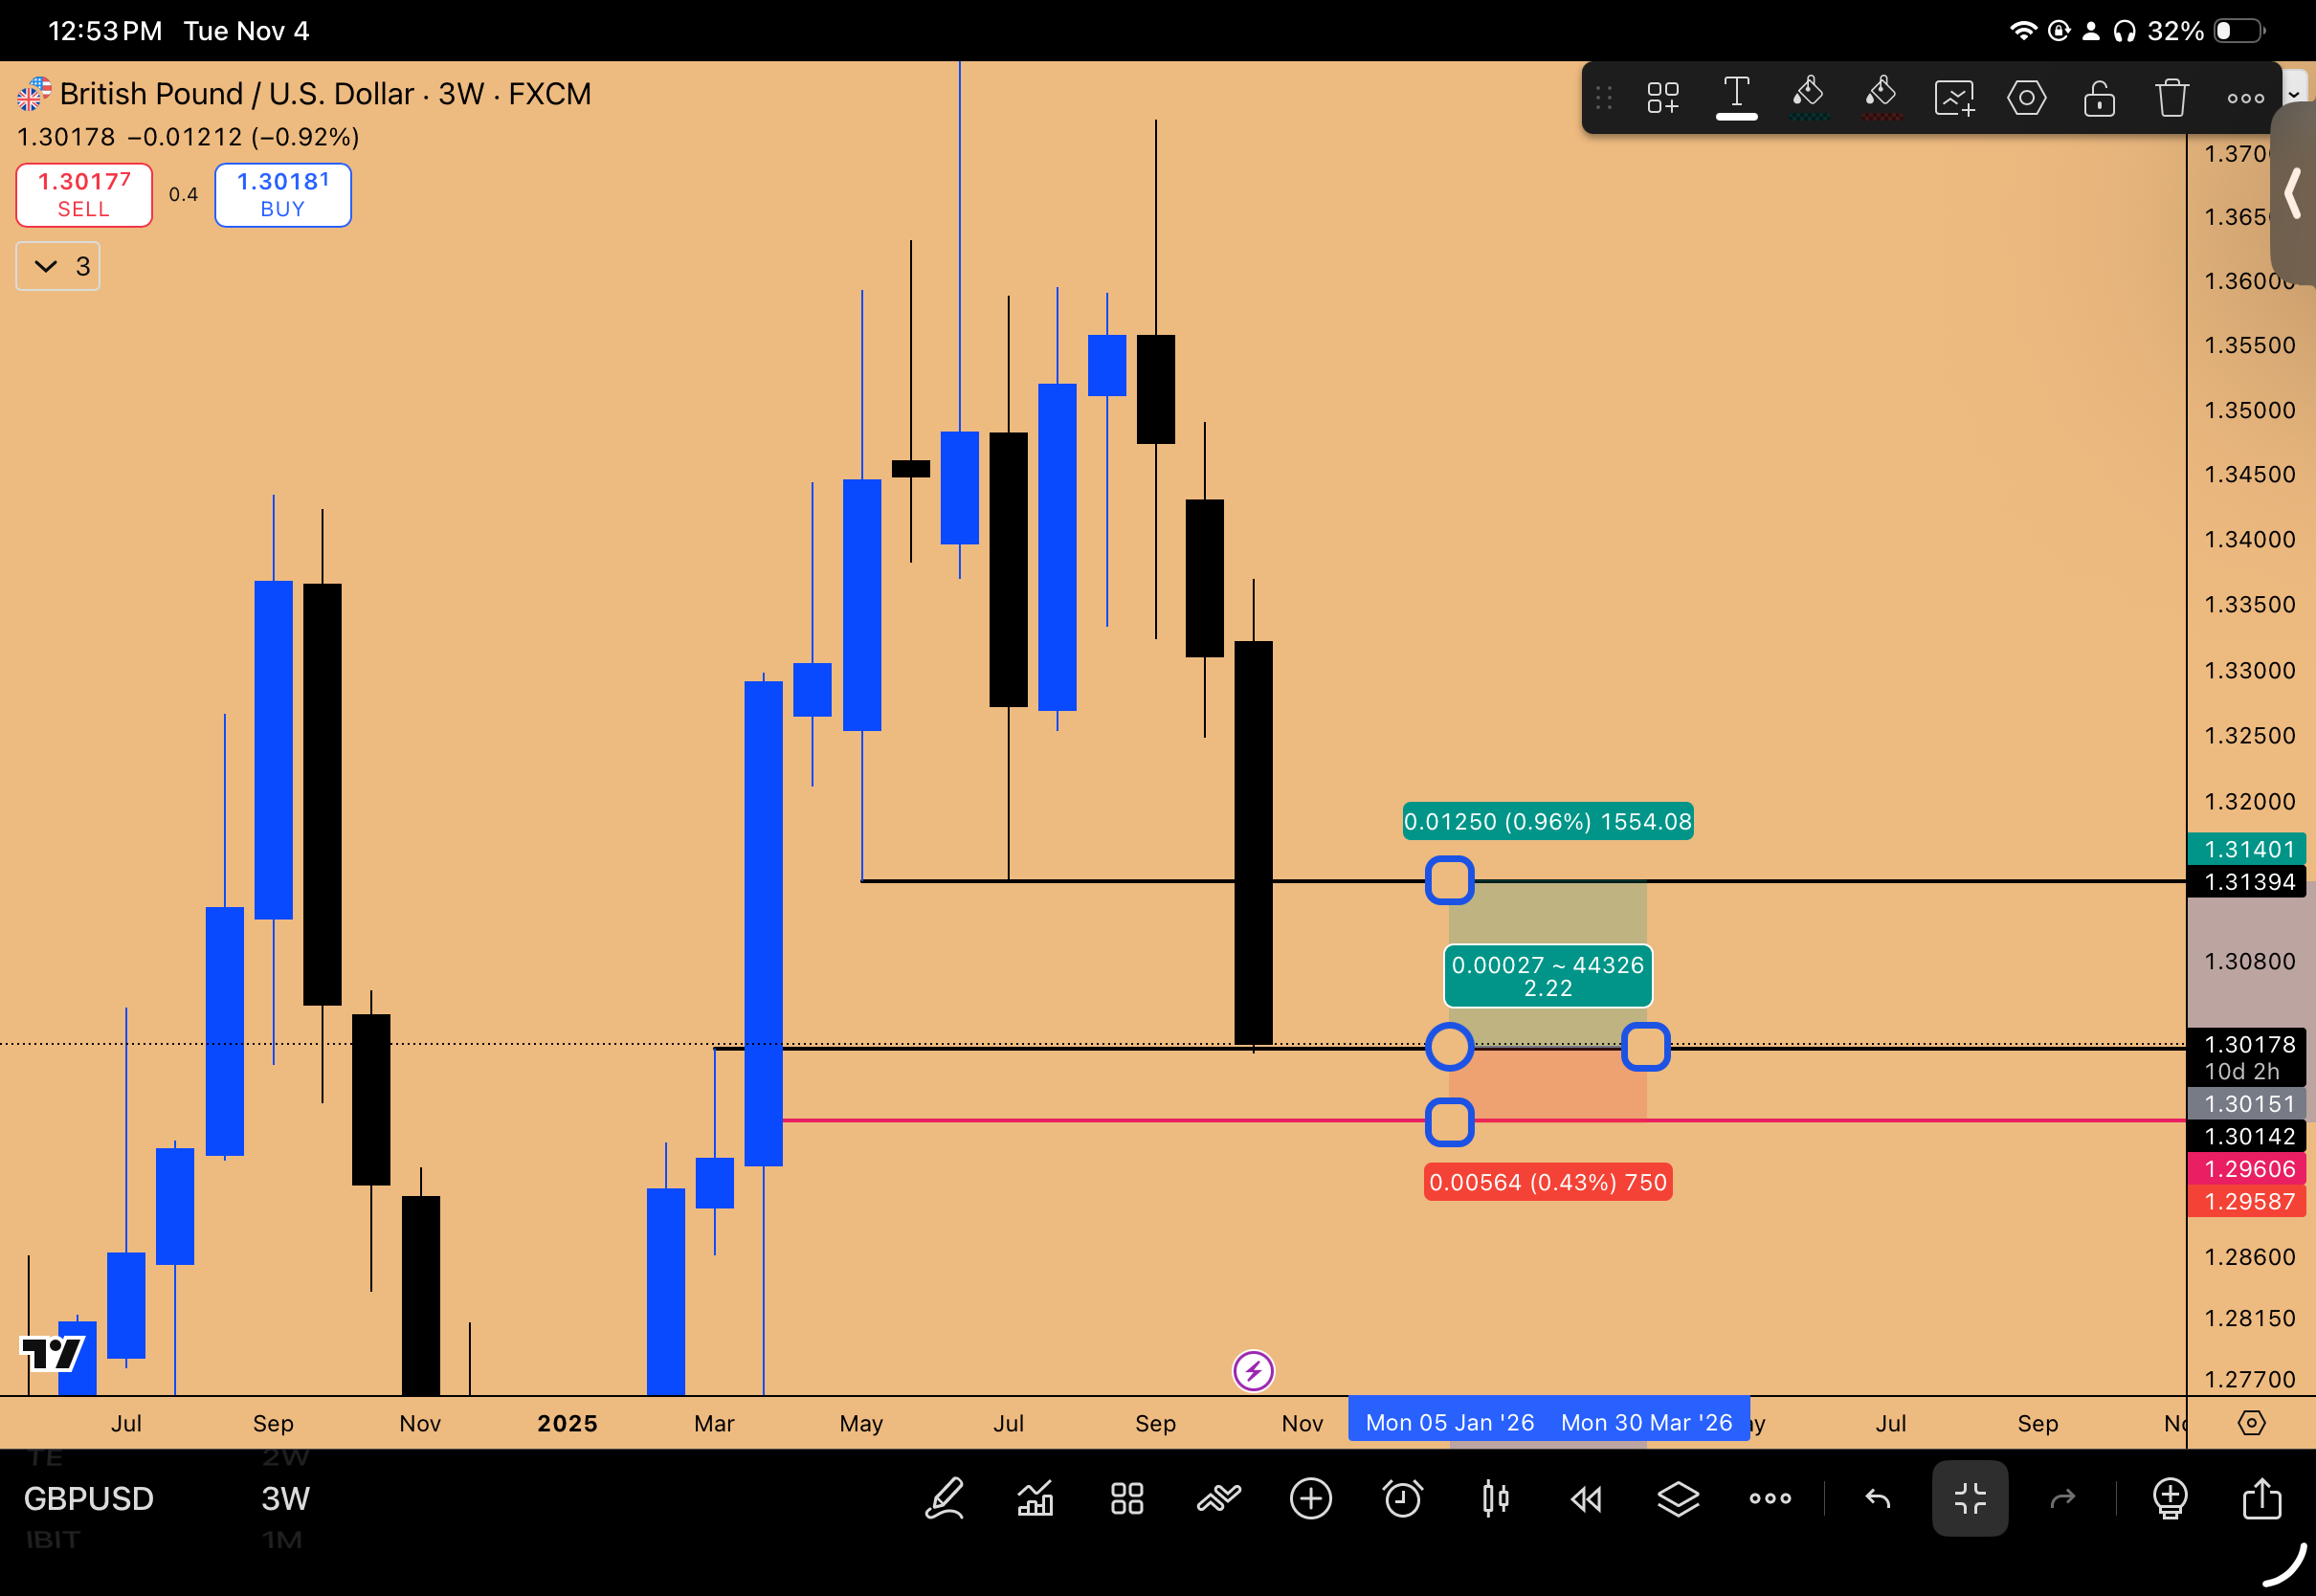
Forex Opportunities: GBPUSD and EURUSD Dynamics
The Forex market presents specific opportunities based on cross-pair correlations and higher timeframe levels, particularly in the Euro (EURUSD) and British Pound (GBPUSD).
EURUSD and GBPUSD Correlation
A key correlation drives the outlook for EURUSD. On the GBPUSD chart, the low from July 14th has been taken out. If GBP takes out that low, it is algorithmically programmed that EURUSD must also go and take out its corresponding low.
Implication: EURUSD is lagging behind significantly, and there is substantial pressure for it to move lower to take out that low. Once that target is met, the bearish bias may shift, potentially offering long opportunities in GBPUSD.
GBPUSD Trade Setup
A specific long setup has been identified for GBPUSD, derived from the 3-week timeframe.
The Setup:
Rationale: A very good, untested level on the 3-week chart at 1.30151.
Entry: Limit order at 1.30151 (or slightly above at 1.30163).
Stop Loss: 1.29606. This stop is derived from the daily chart, placed below the bottom end of the thrust candle that initially pushed GBP above the 3-week level.
Target: 1.31394 (A clear S/R flip resistance level).
Risk-Reward Ratio: 2.2 R/R.
This setup offers a solid risk-reward profile for a long position, anticipating a bounce from this critical higher timeframe support.
Key Takeaways and Outlook
As we head into November, the market environment is characterized by decreasing volatility and strong bullish tailwinds for equities. The VIX signals suggest an upward trajectory for the S&P 500. The NASDAQ is poised for significant acceleration, driven by the reopening of stock buyback windows and powerful seasonality. The correlation with the Nikkei indicates NASDAQ is lagging and may target 28,000, potentially achieving another 5-7% upside before year-end to satisfy political narratives. However, the record run of seven consecutive bullish months suggests potential consolidation or a pullback in December.
The Microsoft thesis provides a high-conviction opportunity, based on the data-driven correlation with XLK and a bullish inside two-month pattern, targeting $650. In commodities, Gold offers a precise swing long setup defending the quarterly low.
As we navigate these markets, focus on the major catalysts—stock buybacks and seasonality—and utilize the defined risk parameters for the setups identified.
What’s your take on the Microsoft thesis and the Bitcoin consolidation? Share in the comments—let’s discuss strategies. Subscribe for more market breakdowns!
Disclaimer: This isn’t financial advice – just market musings from the charts. Always do your own research.
If you enjoyed this deep dive, please share it with fellow traders!