

Oil, War, and the End of Easy Money: Iran’s Strait of Hormuz, Inflation’s Return, and the Death of the “Set-and-Forget” S&P 500


Executive Summary
The world woke up on March 4, 2026, to a question that financial markets are only beginning to price: how far does the U.S.-Iran conflict actually go? Not in the geopolitical sense, but in the dollars-per-barrel, basis points of inflation, and percentage return on your portfolio sense. Because what looks like a regional military escalation today is assembling the conditions for something far more structural: a repricing of energy, a reassessment of central bank policy, and possibly the end of a multi-decade era of fat equity returns. But we’re not there yet. We need to build the case layer by layer.
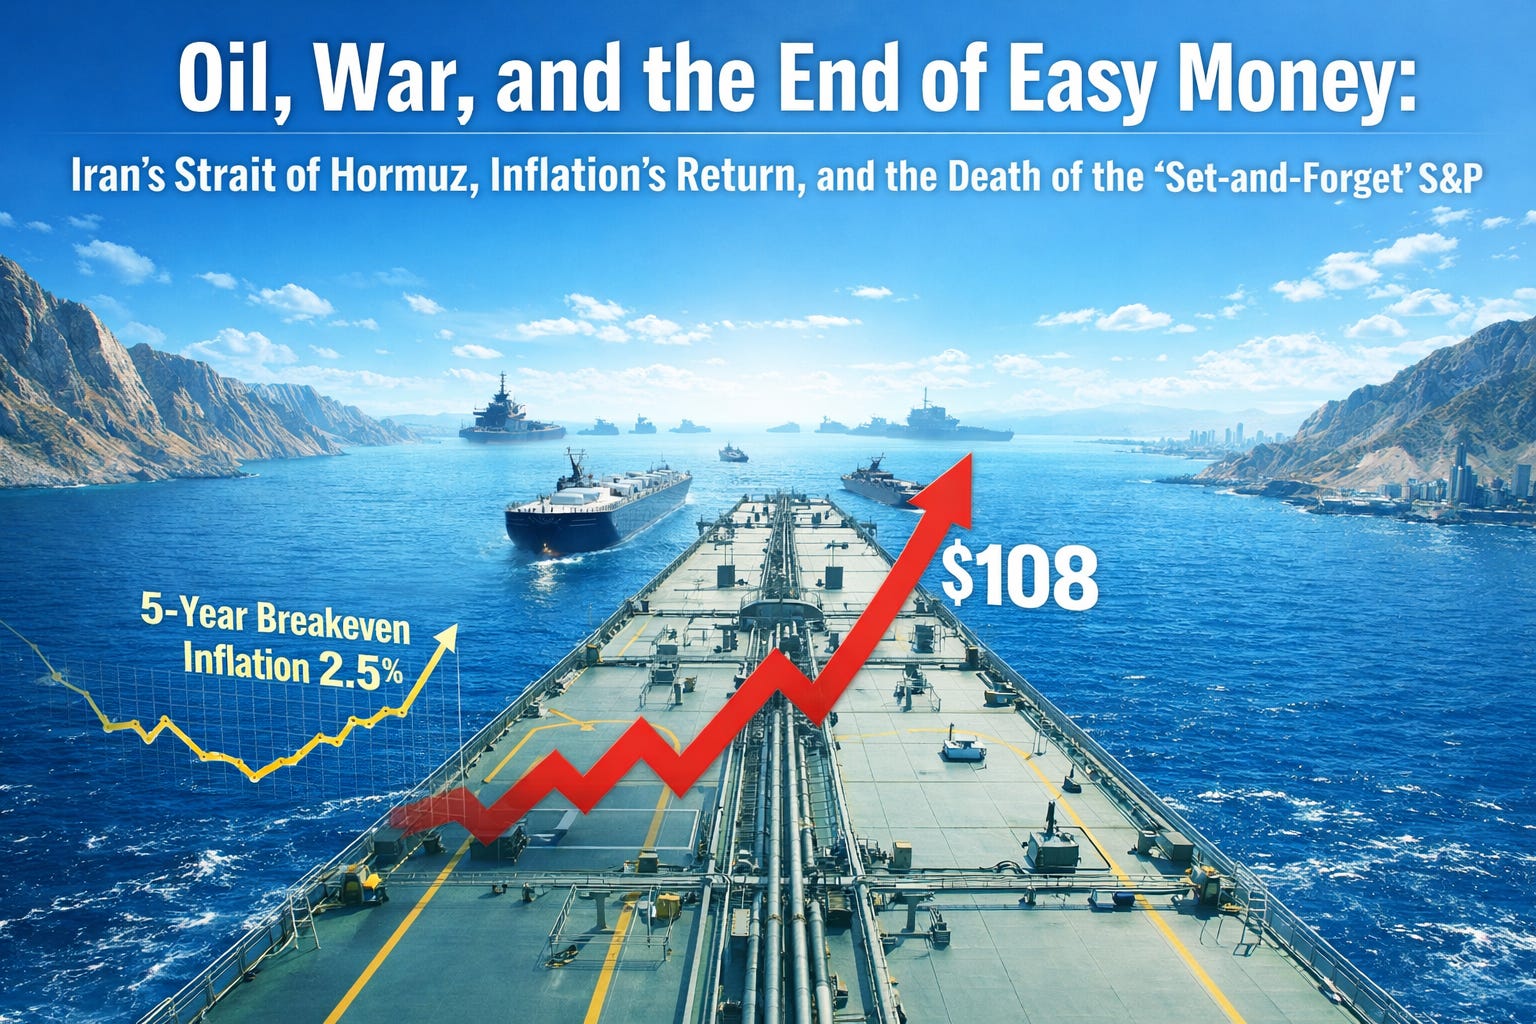
At the epicenter is oil. Specifically, West Texas Intermediate crude is now trading around $74 per barrel, frothy by pre war baselines, while markets hover nervously around the question of whether the Strait of Hormuz, through which roughly 20% of global oil supply flows, can be meaningfully disrupted. The answer, based on a careful reading of insurance dynamics and Iranian military capability, is more nuanced than the headlines suggest. But nuance rarely stops financial markets from pricing worst-case scenarios. And the worst case scenario here is $108 per barrel oil, a level that changes everything: inflation, Fed policy, European growth, currency pairs, and the calculus of every major asset class.
An equally critical subplot: the breakeven inflation rate, the single chart the Federal Reserve actually uses to decide whether to hike, cut, or hold. Right now, it is hugging the 2% to 2.5% band, the zone the Fed has implicitly declared comfortable. But if $108 oil materializes and inflation prints near 3%, that chart breaks higher and the Fed’s current posture of two cuts priced for 2026, one each in September and December, evaporates. That shift would be toxic for indices already under pressure, and it has already begun showing up in selling across broad equity markets.
Meanwhile, a revolution is happening in U.S. energy production that most macro commentators are missing entirely. American fracking technology has been industrialized to a degree that has cratered the production breakeven toward $30 per barrel, meaning the U.S. is positioned to be the single greatest beneficiary of any sustained oil price spike. Europe, Japan, China, and India face the opposite fate as net importers. The divergence in currency and equity fortunes from this asymmetry is already playing out in real time.
And looming behind all of it, the climax this entire analysis is building toward, is a thesis endorsed by Goldman Sachs and echoed by Stan Druckenmiller: that the era of double digit annual S&P 500 returns is over, and a generation of investors who built wealth on “set-and-forget” index exposure are about to discover what single-digit returns feel like. The structural case is airtight. And the timing could not be more uncomfortable.
Key takeaways in this issue:
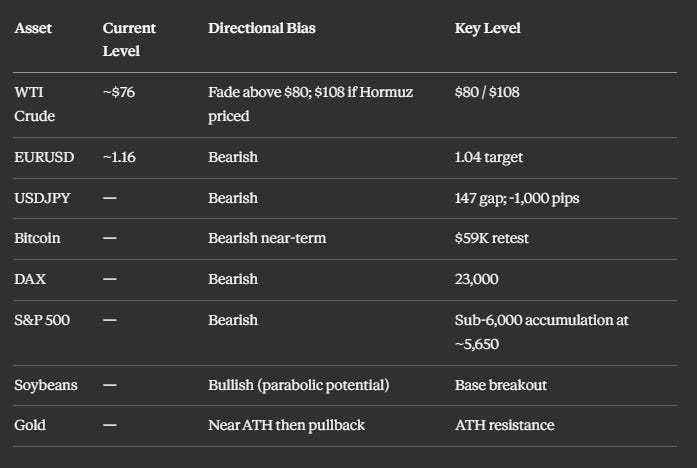
WTI crude is trading ~$74; anything above $80 is a fade unless Hormuz closure is priced, which would target $108
The Fed’s breakeven inflation chart is the real trigger for policy shifts; currently contained but fragile
U.S. fracking breakeven has collapsed toward ~$30/barrel, making higher prices enormously profitable for America
EURUSD could move from ~1.16 to 1.04 under the $108 oil scenario; Europe absorbs the pain
USDJPY continues its downward trajectory; target remains ~1,000 pips lower from current levels
The DAX is collapsing without a floor in sight; 23,000 is the next key zone
The S&P 500 faces a generational shift, with single-digit annual returns projected through the 2030s
The Strait of Hormuz: Understanding the Real Risk
What Closure Would Actually Mean
The Strait of Hormuz is one of the most consequential geographic chokepoints in the global economy. Approximately 20% of the world’s oil supply transits through this narrow passage, and the current U.S.-Iran conflict has put its operational continuity at the center of every energy market conversation. The question is not whether Iran wants to disrupt it. The question is whether they can do so effectively enough to shift the calculus of global supply.
The honest answer is that full closure remains a low-to-medium probability outcome. Iran’s more realistic lever is not a physical blockade. It is insurance disruption. Tanker operators will not move their vessels without insurance coverage, and insurers will not cover risks in an active conflict zone without significant premium increases and, in some cases, outright refusal. Traffic through Hormuz is already near a standstill. That alone is a form of soft closure that the market is only beginning to price. But if the disruption extends beyond the next week or two, markets will begin treating a full closure as a live possibility rather than a tail risk, and that is when the $108 per barrel scenario gets priced in earnest.
Bloomberg’s scenario framework maps this out clearly across three outcome bands:
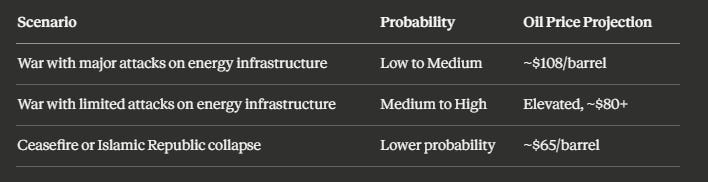
Under a $108 scenario, Bloomberg’s modeling suggests U.S. inflation would add approximately 0.8% by year-end, pushing headline readings toward 3%. That is not a number the Fed can ignore, and we will address exactly what happens when it breaks higher.
The Fed’s One Chart: Breakeven Inflation as the Decision Engine
Why the Breakeven Rate Changes Everything
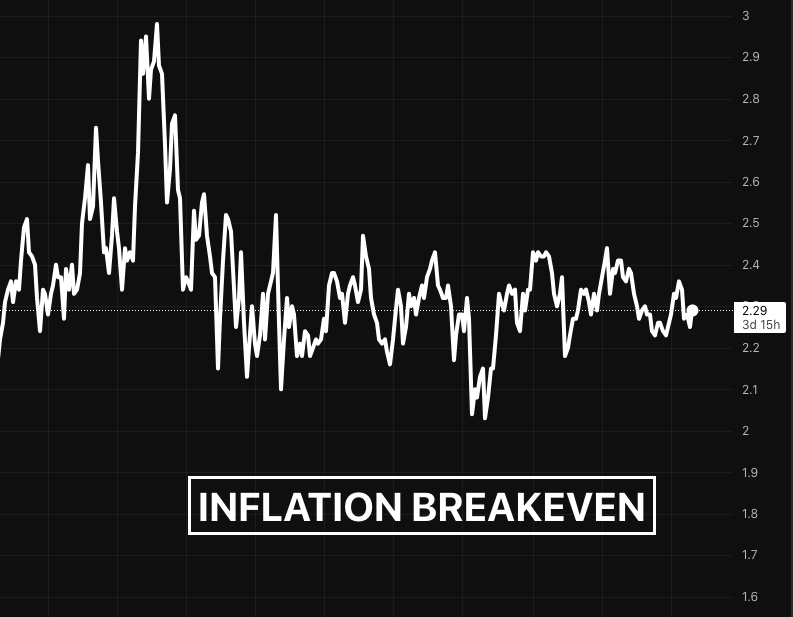
The Fed does not care about oil headlines. It cares about one chart, and that chart is currently holding.
“The Fed will always look at this chart, which is the breakeven inflation rate. As long as it’s staying or hugging the 2% line, under 2.5%, this seems to be the new band they’re comfortable with. They will continue cutting. If for any reason it starts going beyond that... they get worried very quick and they start hiking rates.”
This is the analytical core of the entire inflation discussion: the 10-year breakeven inflation rate. When it exceeded 2.5% in April 2022, the Fed moved aggressively and remained aggressive until inflation rolled over. The current reading is contained, sitting in the 2% to 2.5% range that the Fed has effectively normalized. The market is currently pricing zero cuts through July 2026, a single cut in September. That is the base case and it holds only as long as the breakeven chart stays anchored.
But here is the scenario that unravels it: if $108 oil materializes and inflation breaks toward 3%, that breakeven rate spikes back toward 2022 highs. At that point, the Fed is not cutting it is either pausing indefinitely or hiking. And that, critically, is why equity indices are currently selling off. This is not random or technical. The market is repricing the probability distribution of future Fed action.
The incoming Fed chair Kevin Warsh is expected to arrive in April–May. History and institutional caution suggest the new governor will avoid rash decisions early in his tenure, leaving March through July as a near-certain policy hold. The oil-inflation feedback loop is the one variable that could force his hand early.
The U.S. Energy Advantage: Why This Crisis Is America’s Windfall
The Monster Pad Revolution
Here is the detail that completely reframes the oil shock narrative. The United States is no longer a passive bystander to Middle Eastern energy disruptions. It is now a net exporter of oil, and recent technological advances in fracking have reduced its production breakeven to approximately $30 per barrel. That figure deserves emphasis because it is almost half what it was just a few years ago.
The transformation is structural, not cyclical. U.S. operators have developed what are called “monster pads,” single drilling platforms that can extend laterally for miles, tapping multiple oil reserves from one location without the cost and logistics of building new roads and rigs for every well. One rig can now effectively service up to 20 extraction points. The productivity gains are staggering, and the unit cost savings are what have driven the breakeven toward $30.

At $74 WTI and a $30 breakeven, U.S. energy companies are printing money, and at $108 they become the most profitable businesses on earth.
“Higher oil prices are hugely profitable for these companies. In the past, the profit would have probably went to the Saudis. But if the Saudis can’t get the energy out, they’re going to get all a lot of the market share.”
The U.S. has also recently seized Venezuelan oil tankers, deploying them to sell Venezuelan crude and capture those profits directly. The geopolitical and commercial posture is unmistakable: dominate the global oil trade by creating and then filling the supply vacuum. The winners and losers in this scenario are not symmetric.
Country / Region Net Position Impact of Oil Spike United States Net exporter Strongly positive Russia Net exporter Positive (sells more to China) Canada Net exporter Positive Saudi Arabia Net exporter but Hormuz-dependent Mixed China Imports ~12M barrels/day Strongly negative European Union Net importer Strongly negative United Kingdom Net importer Negative India / Italy Net importers Negative Japan Net importer Negative
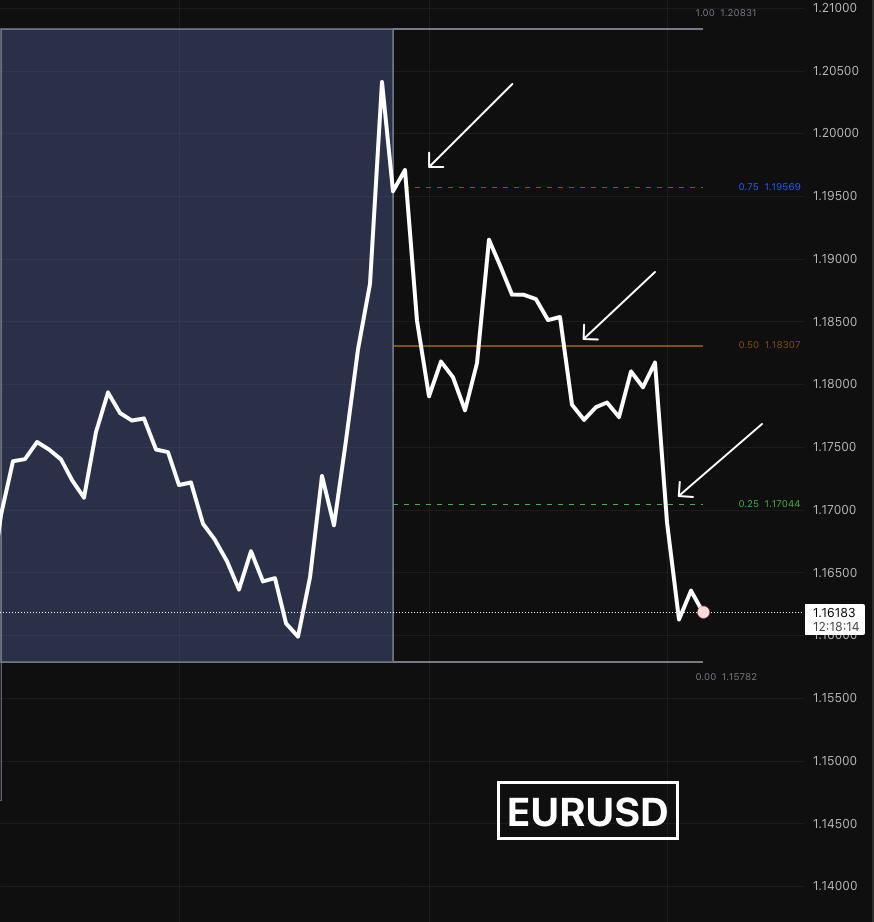
The cascade into currency markets is direct. EURUSD is already sliding, and at $108 oil, the path toward 1.04 becomes a high-conviction directional call. Europe imports the inflation, cannot generate the production profits, and sees growth deteriorate. The dollar, backed by a now-dominant energy export position, absorbs the strength. What looks like a forex trade is actually an energy trade in disguise.
Global Markets: The Damage Assessment in Real Time
Currency Pairs and the Dollar’s Quiet Dominance
The six-week cycle on EURUSD has been a clean story: the pair stretched to the top of its range and has since declined in a textbook distribution pattern. Every band from the highs was a sell, all the way to the current lows. EURUSD has not yet found enough support to break out of that six-week downtrend, and a $108 oil scenario accelerates the path to 1.04 materially
GBPUSD has declined significantly, with rate cuts now priced out of the UK, not because the economy is strong, but because higher energy prices are expected to drive domestic inflation higher, keeping the Bank of England from cutting. AUDUSD is expected to follow the pattern of its G10 peers, with further downside likely as USD strength persists. USDCAD is relatively flat, as Canada benefits from oil but faces tariff headwinds that neutralize the gain.
USDJPY is the most layered call in the book. Japan is a net importer of commodities, meaning higher energy prices are an economic headwind. But simultaneously, Japanese capital is repatriating, which is yen-positive. The net effect still points downward for the pair. The 147 gap remains the primary target, and a further 1,000 pips of downside is the working expectation. The critical lesson on Yen: ignore BOJ rhetoric about rate hikes or cuts. The real mover is capital flows, specifically exports and imports of capital, not the domestic economic story.
Equities, Commodities, and Crypto
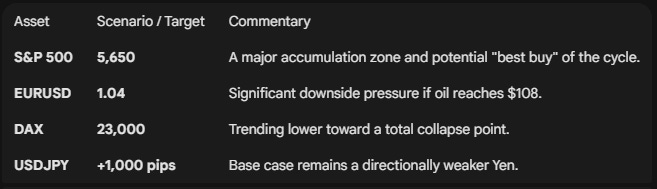
The equity picture is darkening. The DAX has been collapsing at a pace of 500 to 900 points per session with no visible floor, and 23,000 is the next significant level in its path. Hang Seng is in similar freefall. The Nikkei is struggling to hold. The S&P 500 and Nasdaq are still inside their six-week ranges but appear poised to break lower, with the key zone of interest sitting below 6,000, around the 5,650 area, as a potential accumulation zone. The Dow Jones is holding comparatively better, owing to its heavy weighting in energy and financials, precisely the two sectors that historically outperform during wartime conditions, as observed in the energy sector rally that ran for five to six months following the Russia-Ukraine escalation in 2022.
Bitcoin is expected to revisit and take out the recent $59,000 low. Copper is range-bound, with an eventual breakout above $6,000 anticipated. Gold is approaching all-time highs but is expected to pull back from that zone. Silver is not viewed as a high-conviction long, as the yearly low seen recently is not considered the definitive low, with further downside anticipated toward summer. The soybean setup is the standout agricultural trade: a multi-month base built throughout the prior year is setting the stage for a potential parabolic move reminiscent of the cocoa rally that launched from late November 2023 into 2024. Wheat has a similar potential, though the conviction is lower.
The Generational Reckoning: Why the S&P 500’s Golden Age Is Ending
Goldman Sachs, Druckenmiller, and the Death of “Set and Forget”
This is where everything converges. This will define the next decade of portfolio management for anyone paying attention today.
Goldman Sachs has formally projected that the S&P 500’s annual returns will shift toward single digits in the years ahead. They are not alone: Stan Druckenmiller, one of the most decorated macro traders of his generation, has made the same call, pointing toward the 2030s as a structurally lower-return environment. The analysis anchors on the business cycle and the most consequential structural change in global capital markets: the cost of credit is rising and staying risen.

For the better part of a decade, companies operated in a world of near-zero interest rates. They borrowed cheaply, deployed capital aggressively, captured market share, and drove earnings growth that justified expanding multiples. That era is structurally over. Bond yields are rising. Access to credit is tightening. Mortgage holders remortgaging in the next two years will discover this personally. Corporations that once grew on cheap leverage must now grow on genuine productivity, a far harder task at scale.
The era of effortless compounding is not pausing. It is ending. And the investors who understand this first will position themselves entirely differently from those who are still waiting for the samw bull market returns.
“Going forward towards the 30s, meaning the 2030s, expect single-digit returns. That means 9%, 7%, that sort of thing.”
What does this mean in practice? One year the S&P posts 22%. The next, 3%. It is not a sustained bear market. It is a volatile, low-average-return environment that destroys the wealth accumulation assumptions baked into every retirement model built on the last 4 decades. The passive, set-and-forget investor who has never had to think about sector rotation, currency exposure, or commodity positioning is about to receive an expensive education.
This is why the confluence of the oil shock, the inflation risk, the Fed’s policy ceiling, and the structural credit tightening all point in the same direction: the easy decade is behind us. The assets that thrive in this environment, including energy, financials, hard commodities, and select forex positions, are precisely the ones being flagged across this entire analysis. The S&P 500 itself, as a buy-and-hold vehicle, has likely seen its best days for this generation.
Summary: The Structural Shift
The macro regime has fundamentally shifted. Portfolios optimized for the previous decade of low inflation and cheap leverage are now structurally mispositioned. We are entering an era that rewards active sector rotation and commodity cycles over “set-and-forget” indexing.
1. The Energy Catalyst & Inflation
Price Action: WTI at $76 is the new floor; a move to $108 is probable if Strait of Hormuz disruptions persist.
Macro Impact: Oil at $108 would likely add 0.8% to U.S. inflation, pushing headline CPI to 3%.
Monetary Policy: This inflationary spike would invalidate current market pricing for 2026 rate cuts, as the Fed’s comfort zone (2.5%) is breached.
2. Market Projections & Targets
3. Strategic Setups
Energy Sector: The clearest “long” thesis. With a $30 breakeven and market prices at $76+, margins remain extraordinary.
Financials: Positioned to outperform based on historical wartime performance and rising credit costs.
Commodities: Soybeans are forming a base reminiscent of the 2023–2024 cocoa parabola.
Digital Assets: Bitcoin is currently retesting the $59,000 support zone.
Outlook: The End of “Set-and-Forget”
Prominent voices like Goldman Sachs and Stanley Druckenmiller signal that the era of passive S&P 500 dominance is over. Higher lending costs and the end of zero-rate leverage will force a transition to single-digit annual returns. Success in the next decade will be defined by active management and the ability to navigate currency and commodity volatility.
Disclaimer: This is not financial advice. Just market analysis derived from the charts and discussion. Always conduct your own research.
Trade Strong
Miad