

Pattern Recognition Mastery: The VIX Signal, Commodity Super Cycles, and the Rotation Nobody Sees Coming


Executive Summary
What happens when every macro signal in the market is screaming the same thing, yet most traders are still looking the wrong way?
Risk is rotating. Credit spreads are widening. Market breadth is deteriorating. The SPY-to-TLT ratio just broke structure for the first time in this cycle. And the Thomson Reuters CRB Commodity Index is trading at levels not seen since 2011, a move so large it threatens to drag inflation back from the grave just as the Federal Reserve prepares to cut. The confluence is staggering, and it is building toward something most portfolios are completely unprepared for.
But here is the real question: even if you see the setup, can you pull the trigger?
That is the tension at the heart of this week’s analysis. The charts are offering generational clarity right now, from the S&P 500’s proprietary VIX indicator flashing a signal with over 80% historical accuracy, to GBP/AUD collapsing at breakneck speed as Australia rides the commodity wave, to EUR/USD being quietly strangled by surging energy costs that are gutting European industrial competitiveness. The data is there. The patterns are screaming. The question is whether your internal system, your pattern recognition, your years of accumulated instinct, is calibrated well enough to act on it.

This week’s session went deep on the mechanics of trader intuition: how your brain filters 90-95% of incoming data before your prefrontal cortex ever processes a decision, how the subconscious back-end of the brain picks up micro-movements and signals that analytical thinking misses entirely, and how deliberately journaling sensations, thought patterns, and physical responses to trades can unlock a strike rate that borders on the extraordinary. The evidence is not theoretical. A live USD/CAD trade delivered 400 pips on the initial move and then a stunning 800-900 pip reversal, all triggered by what can only be described as trained pattern recognition firing at an inflection point nobody else saw.
What looks like noise today is setting the stage for something far more consequential, but only for those who have done the work to trust what their body and brain are telling them.
Credit spreads are elevated, confirming a risk-off environment as money favors government bonds over corporate debt.
A proprietary VIX-over-three-month-VIX indicator delivers over 80% probability of a positive S&P 500 close when it hits the 1.20 extreme.
SPY/TLT has broken its uptrend structure, signaling active rotation from equities into bonds.
EUR/USD is trapped by surging oil prices, with the six-week FOMC cycle indicator pointing to further downside accumulation.
GBP/AUD is at fresh yearly lows not seen since 2024, as Australia dominates the commodity resurgence.
The CRB Commodity Index is trading at 2011 levels, and inflation is about to follow it higher, a setup with enormous implications for real yields, dollar positioning, and the Fed’s entire trajectory.
The Trader’s Edge: Pattern Recognition and the Subconscious Mind
How the Brain Filters Market Data
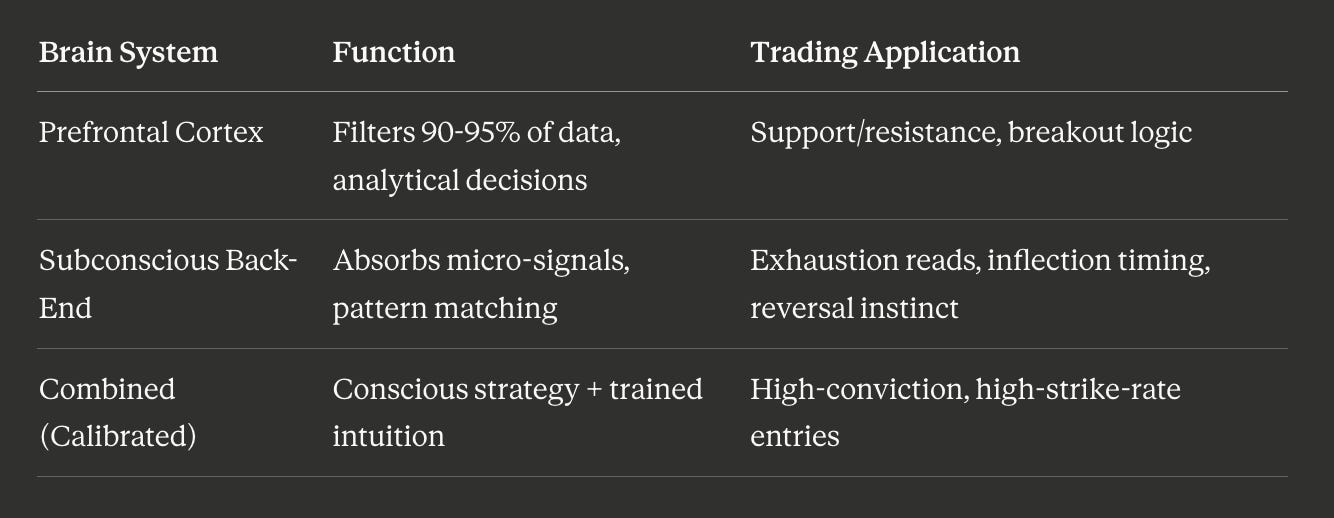
Every trader sits in front of the same charts, yet outcomes diverge wildly. The difference, according to this week’s analysis, is not strategy alone. It is how deeply a trader has trained the subconscious pattern-recognition engine that operates beneath conscious thought.
The human brain receives billions of data points, but the prefrontal cortex, your decision-making center, filters out 90-95% of that information before presenting you with something actionable. That filtering is efficient, but it also means the analytical mind misses micro-signals that the subconscious absorbs effortlessly. The analogy offered was striking: watching someone walk down the street, noticing an imperceptible change in gait and material movement, and sensing they are about to fall, two full seconds before it happens. Nothing in the conscious data stream suggested a fall. The back of the brain simply knew.
The back of your brain picks up everything the prefrontal cortex discards. “Lo and behold, two seconds later, that person misses a step and does fall over. That is something that the prefrontal cortex would not have alluded you to.”
For traders, this translates directly to chart reading. The conscious mind draws support and resistance, identifies ranges, and waits for breakouts. But the subconscious processes micro-expressions in price action, the subtle exhaustion of a move, the cadence of a candle close, the feeling that a breakout is about to fail. The traders who consistently outperform are the ones who have learned to trust and calibrate that deeper signal.
The Journaling Method That Changes Everything

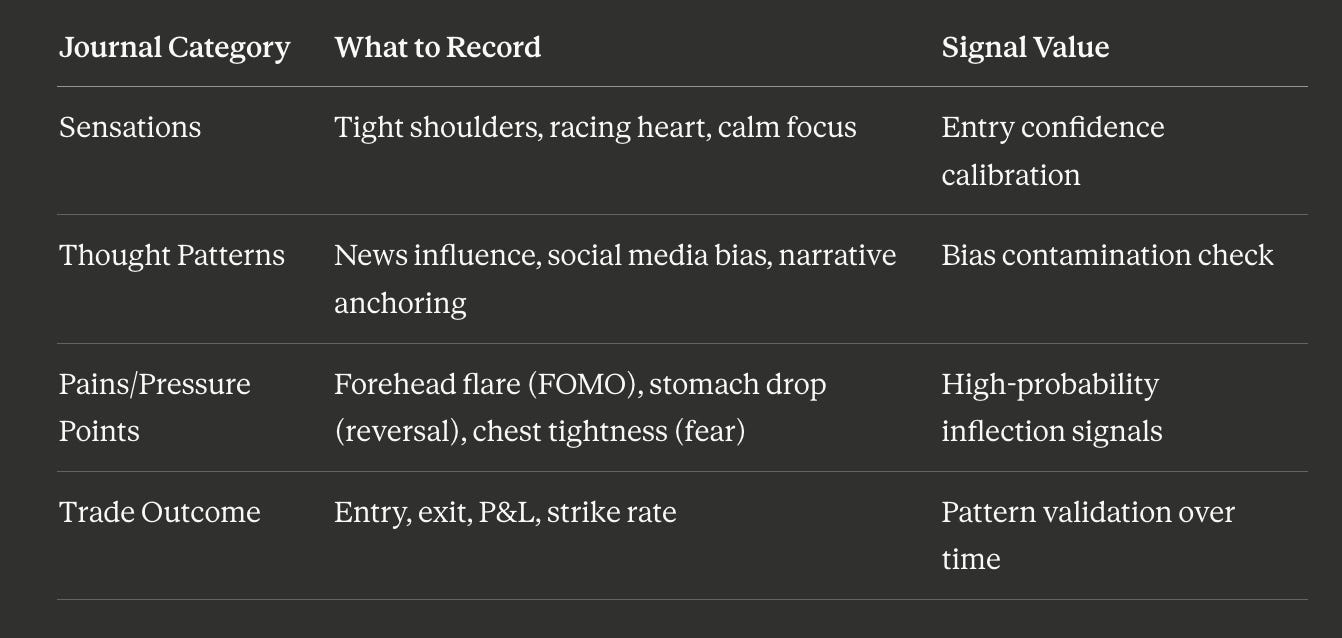
The bridge between raw intuition and actionable trading edge is a specific kind of journaling that goes far beyond logging entries and exits. The method detailed this week asks traders to record four dimensions alongside every trade: sensations (tight shoulders, stomach drops, forehead tension), thought patterns (what news or social media content influenced your bias), pains and pressure points (physical signals the body produces in response to market stimuli), and the trade outcome itself.
Your body is giving you signals you are ignoring. “After two or three weeks, you find that there is a pattern to your good trades, but there is also a pattern to your bad trades.”
The results emerge remarkably fast. Within two to three weeks of consistent journaling, clear patterns surface: a forehead flare before FOMO-driven entries, a stomach drop right before a reversal plays out. One example from live day trading on GBP/JPY was particularly vivid. Price would dump 50 pips, the stomach-drop sensation would fire, and the instinct screamed the move was over. By flipping that sensation into a reversal signal, the subsequent long entries would rip 120 pips with stop losses as tight as 10-15 pips. The risk-reward was extraordinary, not because the chart pattern was unique, but because the internal signal added a layer of conviction that pure technical analysis could never provide.
Real-World Proof: Oil and the USD/CAD Masterclass
The Oil Gap That Rewarded Instinct
The theory was immediately grounded in live market examples. When US oil gapped higher on a Sunday evening open amid fears of Iran, the Strait of Hormuz, and potential nuclear escalation, every headline screamed higher. But the chart threw off a pin bar at an exhaustive level with no traditional support or resistance to anchor the trade. For a trader with months or years of calibrated journaling, the sensation was unmistakable: this move is done.
When the news screams one direction and your trained instinct says the opposite, the instinct wins. “This eerily feels like it is about to collapse... and if you would have done this, boom, look at that.”
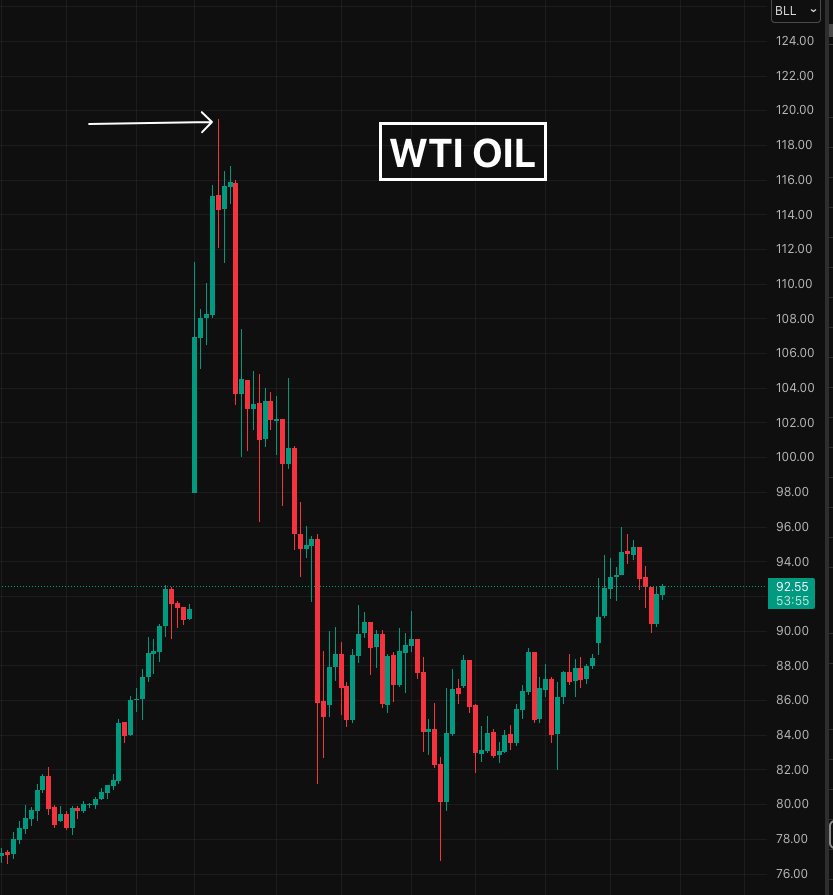
The subsequent collapse in oil was enormous. The trade was not born from a textbook setup. It was born from accumulated pattern recognition firing at the exact moment of maximum crowd confusion.
USD/CAD: 400 Pips Up, 900 Pips Down
The most powerful live demonstration came from USD/CAD. The position was built long on the thesis that US trade tariffs on Canada would drive the pair higher. It delivered roughly 400 pips. But at the blow-off top, every trained internal signal, every engram, activated simultaneously. The probability assessment was extraordinary: over 90% confidence that a massive collapse was imminent, targeting 800-900 pips of downside.
The trade was flipped from long to short. While the rest of the market was still projecting higher USD/CAD levels, the position was accumulating on the way down. The result was astronomical.
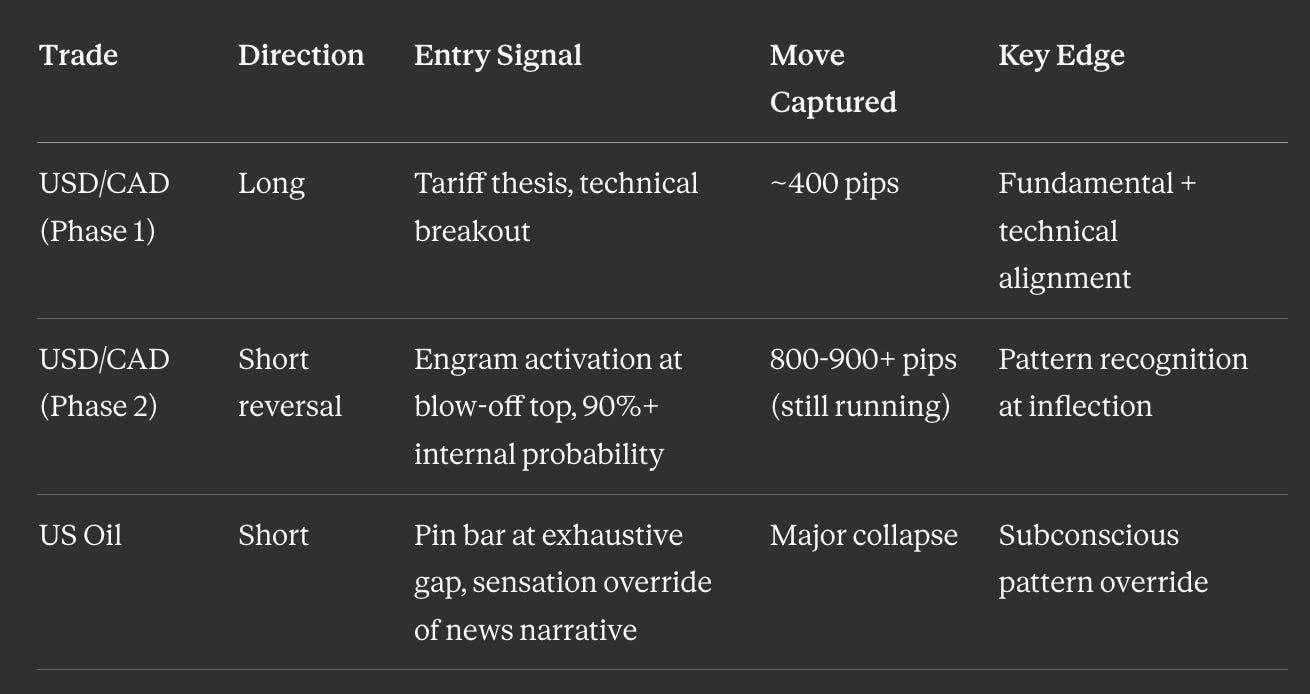
The lesson is categorical: the only way to trust inflection-point reads at this level is to have a deep catalog of pattern recognition that has been deliberately trained, journaled, and validated over time.
