

Q2 MARKET SITUATION REPORT: The Oil Shock Playbook
Inefficiency Gaps, Generational Tech Setups, and the 20% Drawdown Nobody Sees Coming


Executive Summary: When Volatility Becomes the Roadmap
The global market stands at a crossroads that most participants refuse to acknowledge. A geopolitical conflict is choking the world’s most critical oil artery, the VIX is oscillating between 23 and 30 without producing the climactic spike that historically signals a true bottom, and open inefficiency gaps on higher timeframes are acting as gravitational wells pulling indices toward levels not seen since mid-2024. The question confronting every portfolio manager, swing trader, and long-term investor is deceptively simple: are we witnessing a garden-variety correction, or the opening act of a drawdown that rewrites positioning for the next twelve months?

The answer, as this week’s quarterly stream revealed, lies buried in the anatomy of candle formations most traders have never studied. Flat opens on 3-week charts those ghostly inefficiencies where price expanded without printing a wick have been quietly stacking since the 2022 bear market bottom. They are the market’s unfinished business, and unfinished business always gets settled. The catalyst this time is not a Fed policy error or a crypto infrastructure collapse. It is an oil shock rippling outward from the Strait of Hormuz, threatening to push European economies into recession and drag the interconnected global financial system into a synchronized deleveraging event.
But here is what makes this moment extraordinary rather than merely dangerous: the same geopolitical storm creating chaos in energy markets and equity indices is simultaneously engineering generational entry points in the companies building the AI industrial revolution. While headlines scream about barrel prices and tariff escalation, the real story is unfolding beneath the surface in Amazon’s robotics ambitions, Apple’s hardware moat, Meta’s marketing dominance, and Netflix’s digital immunity to physical conflict. The war will end. The inefficiencies will fill. And the investors who mapped both the downside targets and the upside setups will be the ones who capture the decade’s defining trades.
This is not a session for the faint-hearted. What follows is a surgical breakdown of every major asset class, every open gap, every liquidity pool, and the single most consequential trade setup hiding in plain sight.
The VIX has not yet produced the climactic spike required to confirm a market bottom volatility is still trending, not peaking
Open inefficiency gaps on the S&P 500’s 3-week chart between 5,666–5,735 represent the gravitational floor for this drawdown
The 1990 Gulf War parallel suggests equity markets will not bottom until oil prices peak and oil has not peaked yet
Bitcoin is printing an inside monthly candle near quarterly support at 58,740–69,000, setting up a potential sweep-and-reverse
The Nikkei’s inside candle failure signals further global deleveraging via the yen carry trade unwind
EUR/USD faces a potential 557-pip collapse as the ECB scrambles to prevent an energy-driven recession
A cohort of AI-era companies: Amazon, Apple, Meta, Netflix are approaching buy zones that may not appear again this cycle
The generational “off-ramp” trade in oil and energy equities could be the single highest-conviction setup of 2026
The Architecture of Drawdowns: Why Flat Opens Are the Market’s Memory
Understanding Inefficiency Pools on Higher Timeframes
Most traders fixate on daily candles and intraday noise. The quarterly outlook pulled the lens back to where institutional money actually operates: the 3-week timeframe. On this timeframe, the S&P 500’s history reads like a ledger of promises the market made and never kept. Every flat open every candle that expanded upward without first printing a downside wick represents an inefficiency the market algorithm has catalogued and will eventually revisit.
“When the market expands without downside price action, it creates an inefficiency I refer to as a flat open. The market algorithm remembers these levels during future drawdowns.”
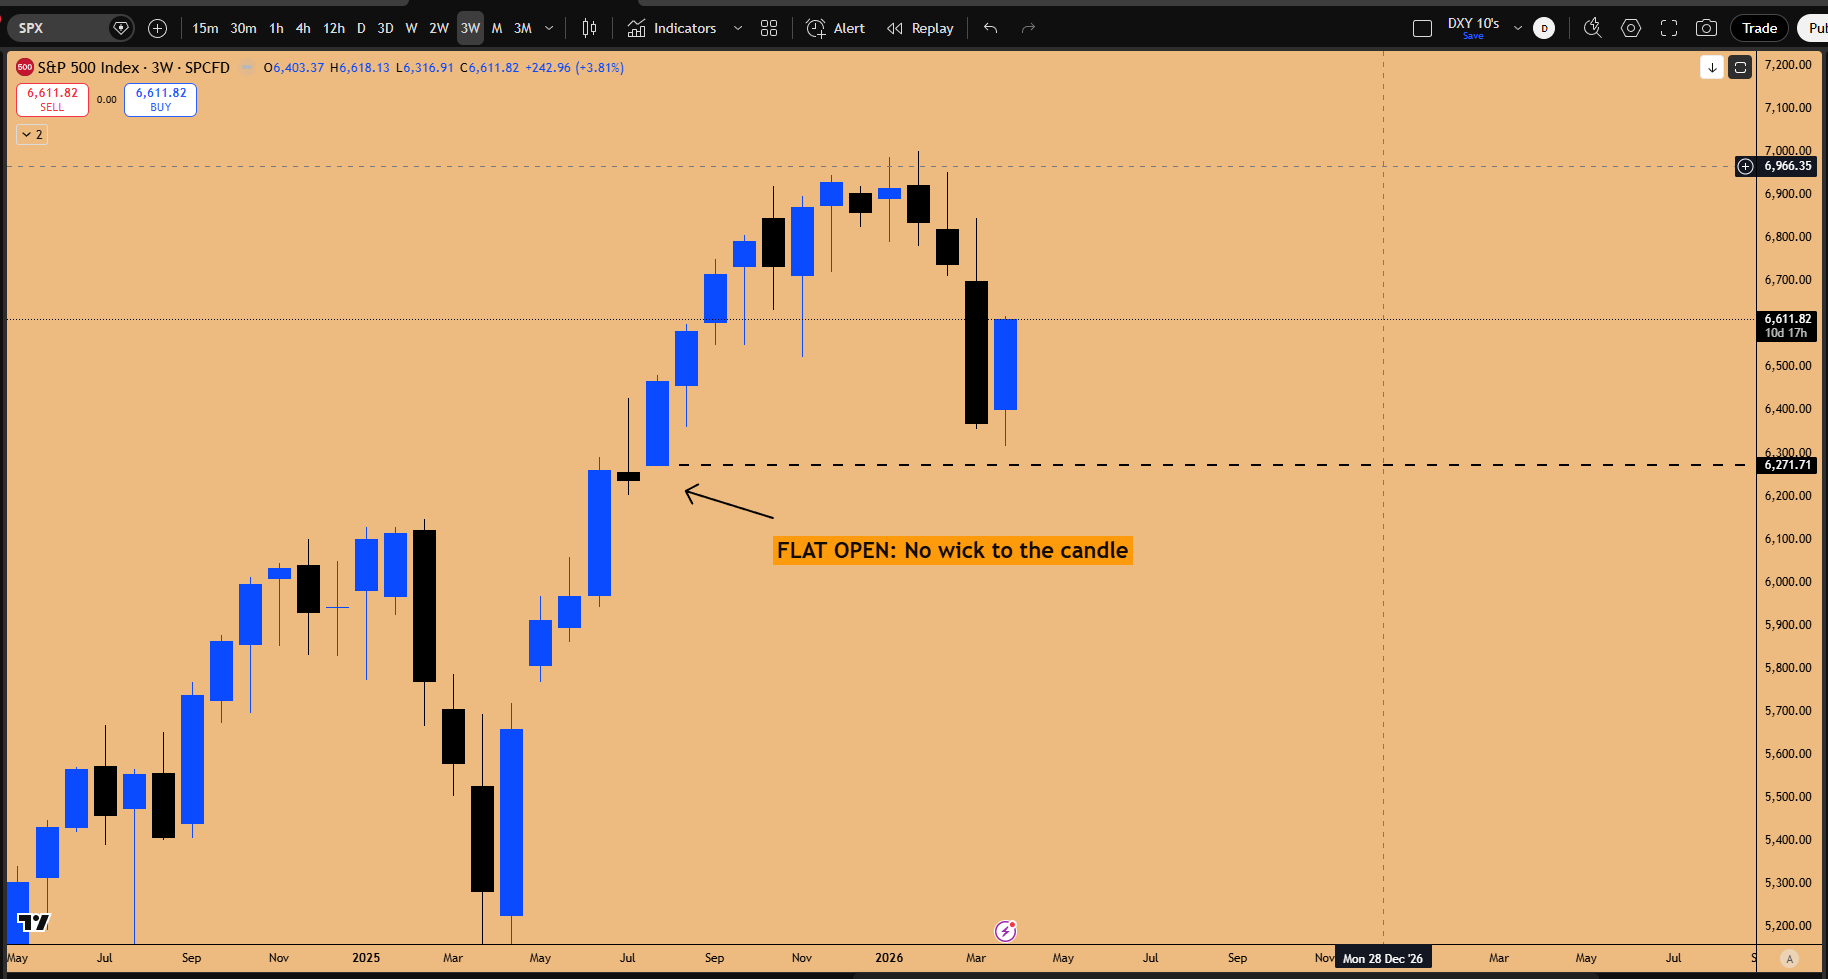
Figure 1: Flat open present in SPX500 Cash Index on 3-week time frame
This is not abstract theory. The historical evidence is unambiguous, and understanding it is essential to navigating the current drawdown. During the post-2016 election rally, the S&P 500 left multiple flat opens on its 3-week chart as it climbed aggressively through the first year of the Trump administration. Those inefficiencies sat dormant for over a year, invisible to anyone not tracking the 3-week timeframe, silently accumulating like unpaid debts on the market’s balance sheet. When the 2018 reverse repo crash arrived, the market hunted every single one of them with methodical precision.
The first drawdown candle in 2018 neutralized one flat open, closing that specific inefficiency. But older flat opens on the left side of the chart remained untouched and the market was not finished. Price did not fall in a straight line; there were bounces along the way, and each bounce convinced a fresh cohort of buyers that the bottom was in. It was not. Those bounces were nothing more than pauses in the algorithm’s relentless march toward its targets. The market was methodically filling its open gaps, eventually reaching 2,351 to close the February 2017 flat open. Only after that final inefficiency was filled and climax selling exhausted the last sellers did the bottoming process truly begin.
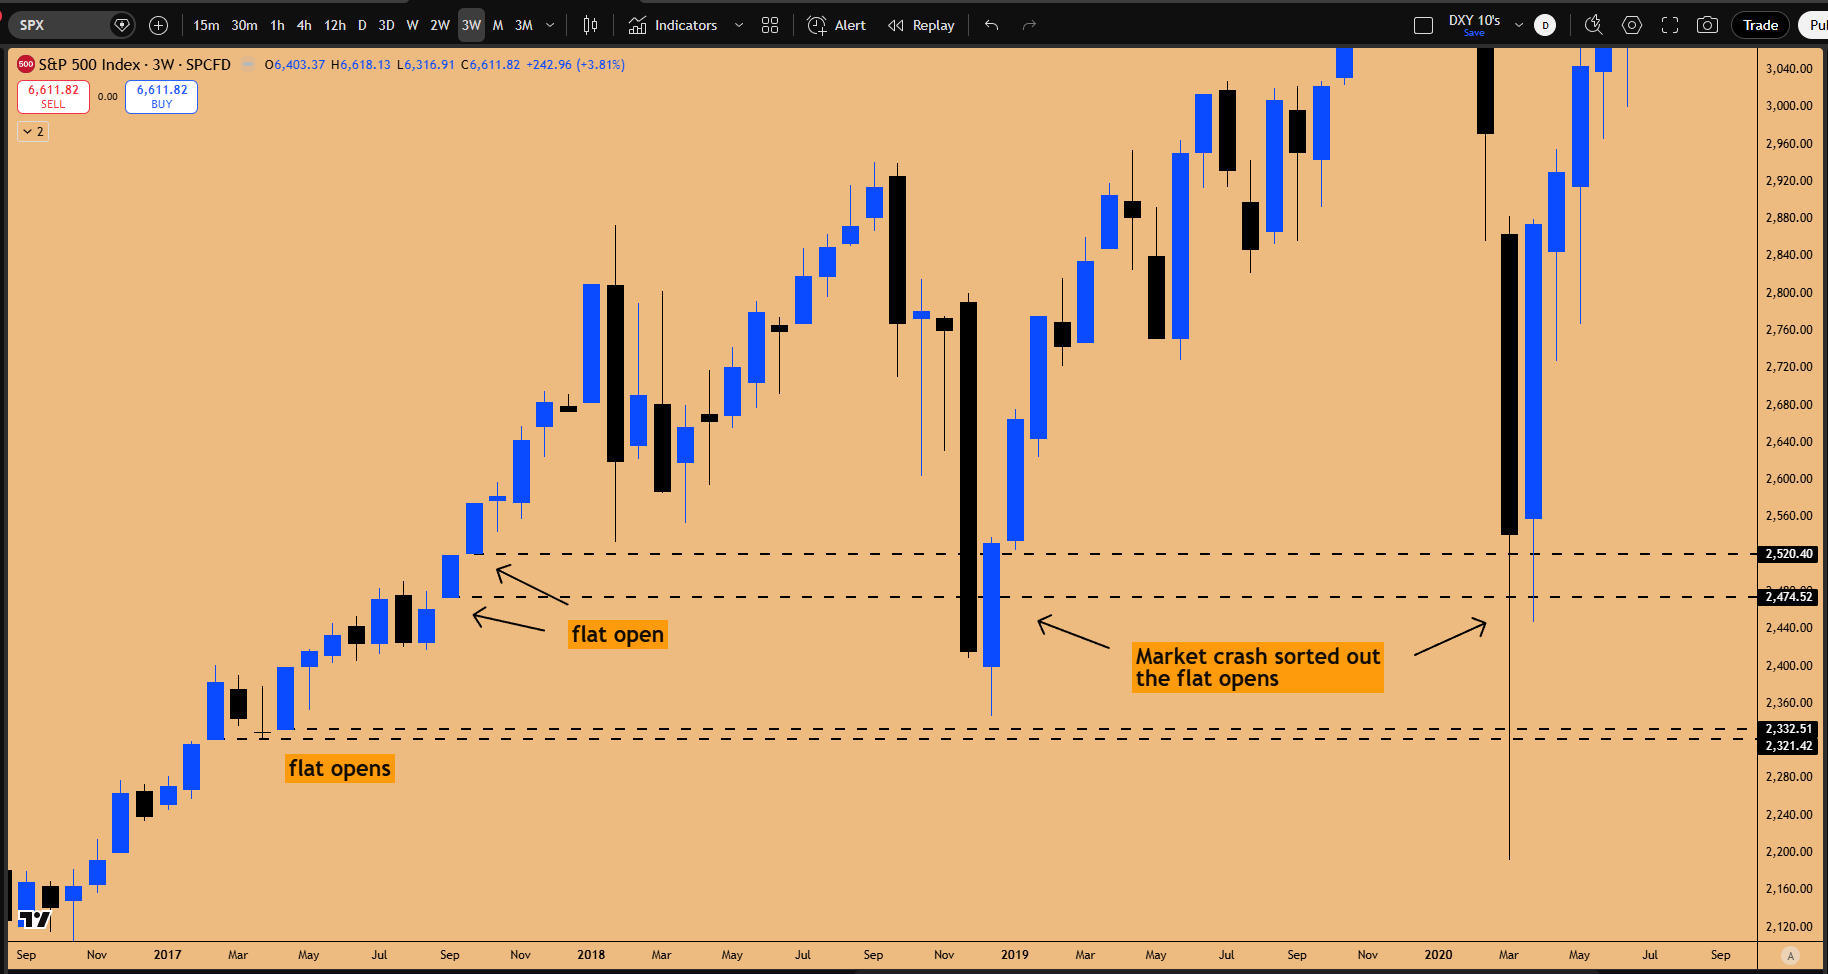
Figure 2: Flat opens sat intact for 1+ year until 2018 reverse repo crash and 2020 Covid crash sorted out the flat opens
This is the framework that separates informed positioning from hopeful guessing. During a volatility spike where every session seems to move lower without a meaningful bounce, you must identify the candles without wicks and the open gaps on higher timeframes. Those are the downside targets. Once those levels are reached and you witness genuine climax selling the kind of panic that makes experienced traders question everything they know the bottoming process can begin. Not a moment before.
The pattern repeats because the mechanism is structural, not discretionary. Algorithms are programmed to fill these voids. During a volatility spike where every session feels like capitulation, the trader’s job is to identify the candles without wicks and the open gaps those are the downside targets. Once they are reached and climax selling occurs, the bottoming process can begin. Not before.
The 10% and 20% Thresholds: Where Drawdowns Stall and Where They Don’t
The current drawdown has approached the 10% decline from the S&P 500’s confirmed top. History suggests this is a dangerous zone not because it marks a bottom, but
