

Q3 Elite Strategy Guide: Unlocking Institutional playbook for Equities, Crypto and Gold markets
US Equities, Bitcoin, Dax, Nikkei and Gold

Executive Summary
Overview of the Quarterly Outlook
The Q3 2025 Quarterly Outlook provides a comprehensive analysis of market dynamics, trading strategies, and portfolio management techniques as the new quarter begins. Unlike previous outlooks shared via text-based platforms, this iteration leverages a live stream format to deliver real-time insights, focusing on cross-market correlations, seasonality factors, and institutional portfolio rebalancing. The significance of July as a pivotal month for market movements is emphasized, driven by quarterly transitions and heightened volatility.
Purpose and Key Topics
The outlook aims to equip investors with actionable strategies for navigating the upcoming quarter, focusing on:
Cross-Market Correlations: Understanding how asset classes like equities, cryptocurrencies, Indices and commodities interact.
Seasonality and Volatility: Analyzing historical patterns and their implications for July and beyond.
Portfolio Rebalancing: Capitalizing on institutional repositioning at quarter-end.
Technical Analysis: Utilizing candlestick patterns and proprietary indicators to identify high-probability trades.
Impact of Portfolio Rebalancing
Institutional portfolio rebalancing at quarter-end drives significant market volatility, particularly in the final hour of trading. This period reflects risk appetite, with strong bullish candles in tech-heavy indices and stocks like Microsoft, Amazon, and Google signaling a “risk-on” environment. The “Magnificent Seven” (top tech firms) and AI-driven companies, such as Google, are prime beneficiaries of these capital flows, positioning them as attractive investments for Q3.
As U.S. markets approached Friday’s close, the final hour revealed a critical tell: institutional risk appetite.In that last trading hour often dubbed the “smart money hour” we saw decisive moves across the board. Microsoft printed a strong bullish candle, a sign of aggressive late-day buying. The SPY (S&P 500 ETF) surged with a powerful upside candle, marking a major shift in sentiment. But it was Amazon that stood out: in the final hour, it went full tilt upward, delivering a move that essentially defined the entire day’s range.
🎓 Educational Segment: Mastering Candlestick Patterns
Introduction to Candlestick Analysis
Candlestick patterns are fundamental to technical analysis, offering insights into price action and market sentiment. A framework for decoding candlestick formations is introduced to anticipate market movements, emphasizing their universal applicability across timeframes and asset classes.
To begin this quarterly outlook, let’s ground ourselves in the basics: how a price candle is actually formed. We always talk about charts, we talk about technicals, we talk about the markets going up and down… But…how do we measure it?
We measure it based on how the candles are forming.
Anatomy of a Candlestick
A candlestick comprises four critical levels: the open, close, high, and low. These levels form the foundation for analyzing price action, with wicks (price extremes) indicating potential manipulation or accumulation zones. Understanding these components enables traders to predict expansions or reversals.

Figure 1: Weekly candle formation for SPX500 Denoting Open, High, low and close
Weekly Candle Analysis
Weekly candles often exhibit manipulation phases early in the week, forming wicks that institutional investors exploit for accumulation. Bullish weeks typically print lows early, followed by expansions, with highs forming in the final days.
📌Case Study: Market Reaction on day to day basis to News
Geopolitical events, such as reported tensions between Iran and the U.S., can trigger short-term market drops over the weekend. However, these are often manipulation phases, allowing institutions to accumulate positions for bullish expansions, as seen in the prior week’s recovery.

Figure 2: Anatomy of a Bullish Weekly candle explained
Going into the weekend, we had news that US and Iran were escalating the conflict, this fear gripped the market, with investors thinking the market is going to collapse in the coming week. What was our battle plan going into this week however? : Our battle plan for going into this week was to buy any dip in the market, as we had a bullish bias on the week. Did the headlines change it? No. The institutions positioned to long the weekend dip
Importance of Wicks in Candlesticks
Wicks are critical for identifying market inefficiencies, such as “flat opens” (candles without wicks). These inefficiencies are high-probability targets for future price action, often revisited during corrections.
One thing is certain: there will always be a wick.
When you spot candles with no wicks especially on weekly opens you’re looking at market inefficiencies. These are rare, high-level inefficiencies where price moved too cleanly, without resistance or retracement. And here’s the critical insight:
Markets do not leave inefficiencies unresolved.
🟩 Price will almost always revisit those clean opens. It may not happen immediately, but history shows that these wickless zones become magnets for future price action. The market eventually comes back to “sort out” those levels.

Figure 3. Noting the flat opens, leaving massive inefficiency Market crash neutralized flat opens
📈 Market Outlook and Risk Management
The market remains structurally bullish, targeting new all-time highs in July.
A correction is anticipated in September or October, potentially revisiting flat opens.
Traders should exercise stringent risk management, avoiding large positions at all-time highs due to diminished forward returns.
No bearish turn is intended for this week; awareness of market inefficiencies is advised as they will eventually resolve.
The market structure is currently on the bullish side, targeting higher prices, with new all-time highs recently printed.
Addressing FOMO and Market Entry
Fear of missing out (FOMO) at all-time highs prompts caution. Entering large long positions at peak levels is discouraged, with recommendations to wait for a 10% correction to secure better risk-reward ratios. Day trading or short-term swing trades are viable, but long-term positions require disciplined risk management.
The best way I can put it, the markets, they don’t actually care if you are long or if you’re short or if you’re on the sidelines, they’re just going to do their thing the way they’re doing it. Our job as analysts is to figure out what is the highest probability trade to enter? What is the next fat investment pitch? Like, does this make sense For us to go long on all-time highs from risk/reward perspective? If there is a strategy which gives you incredible return by entering on all-time highs, then by every means you should execute on that. I personally don’t have such strategy, which if why I refrain from opening new long portfolio positions at all time highs
Applying Candlestick Analysis to Quarterly Trading
Quarterly candlestick analysis mirrors weekly patterns, with early manipulation phases forming bottom wicks. Traders should aim to enter long positions during these wicks to capture three-month expansions, using key support levels for stop-loss placement.
Understanding how a candle truly forms, unlocks a powerful lens on market timing especially at the start of a new quarter.
Every candle has four core elements: the opening price, the closing price, and the upper and lower wicks. These wicks represent price discovery volatility around the true body of the candle. The formation follows a sequence.
🟩 So when a new quarter begins, your job is simple but strategic: proactively identify when the quarterly candle is forming its bottom wick.
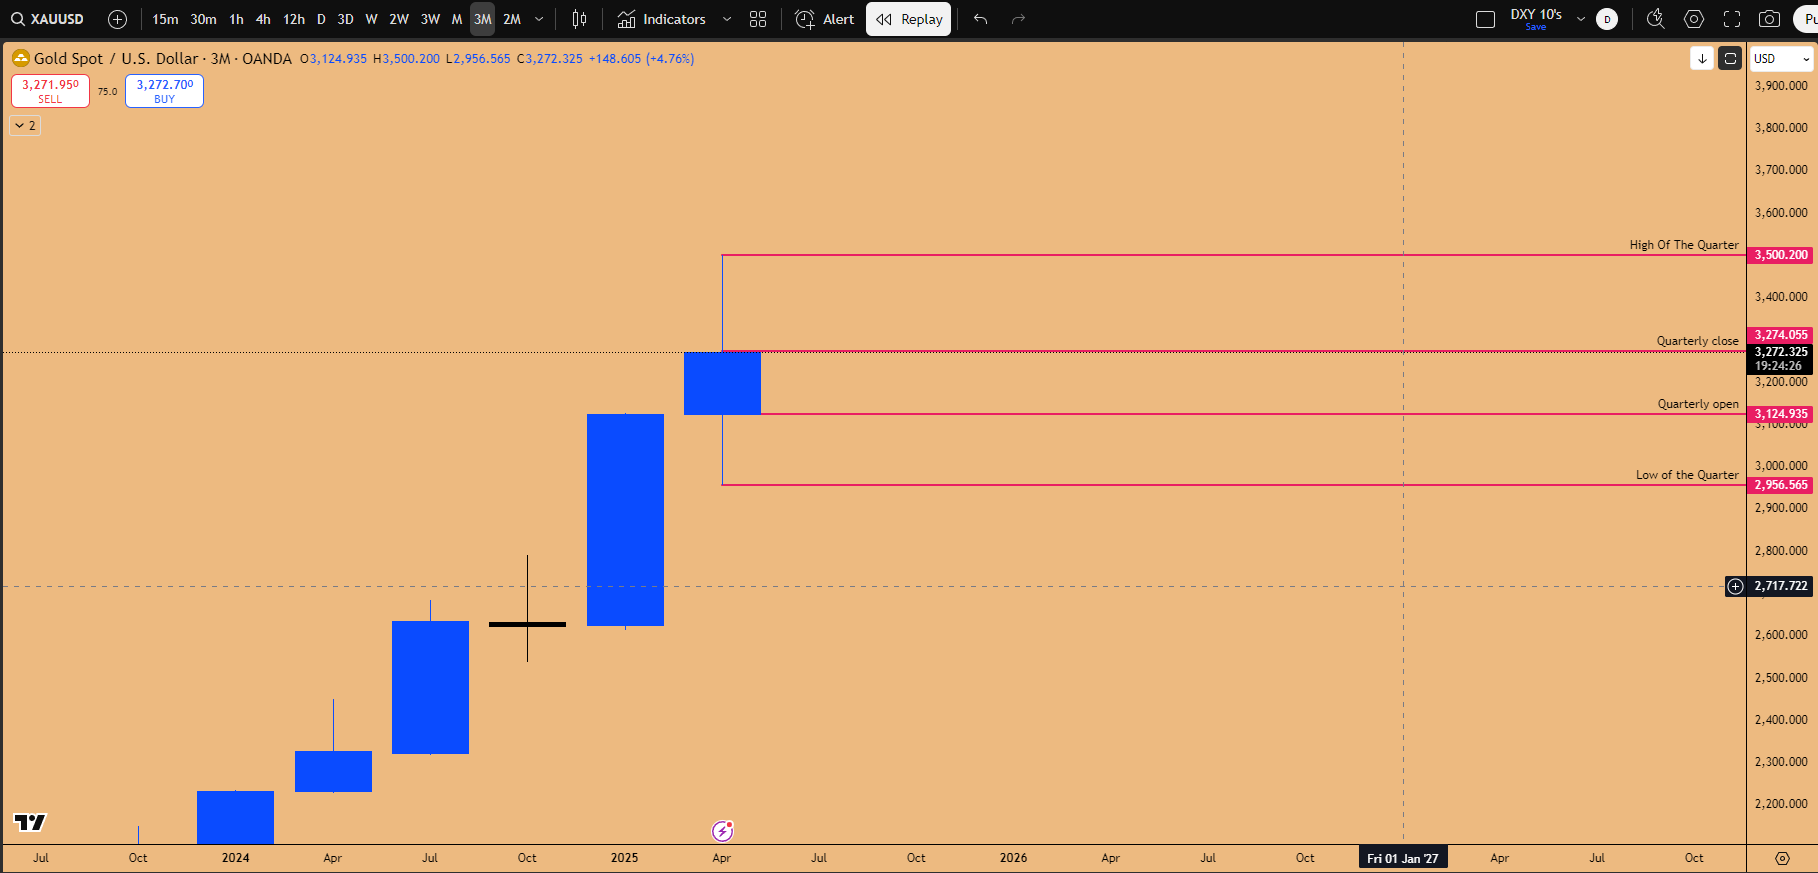
Figure 4: Quarterly candle’s Open, High, Low, Close denoted in Gold instrument
Using the Open Indicator
The proprietary “Open Indicator” (MWD_XO_OPENS) automates the identification of key opening levels (daily, weekly, monthly) across timeframes (Tradingview).
By color-coding these levels (e.g., yellow for monthly opens), it provides a visual framework for support and resistance (SR) analysis, enhancing trade precision.
Rather than manually plotting these levels, there’s a more efficient way use an indicator.
The one I rely on is called “Opens.” This tool automatically maps out opening levels for the day, week, or quarter. Once activated, it eliminates the need to mark each new session’s open by hand.
It saves time, removes guesswork, and ensures you never miss a key structural level
Monthly open and Weekly open act as dynamic S/R levels (Support/Resistance). If price is above the monthly open, then the monthly open level act’s as a Strong Support, as depicted in the chart below.

Figure 5: Visual Representation of Opens indicator on 4 hour time frame
📌Case Study: Gold
Gold’s quarterly candle analysis reveals a manipulation phase forming a bottom wick, followed by an inside daily candle failure as a long entry trigger. This setup, executed in Q2 2025, captured a 4.5 risk-reward ratio, targeting new all-time highs.
A skilled trader knows before any major expansion—especially heading into a new quarter—there’s often deliberate manipulation.
It’s part of the process where Smart money shakes the tree before the real move begins. Look for specific price signatures—patterns that signal engineered pullbacks. These typically show up on the daily or weekly chart, and they offer a high-probability entry point for long positions.
Recognizing this setup gives you a decisive edge, you're not reacting to volatility, you're anticipating structure.

Figure 6: Utilizing the monthly open strategy taught to capture 4.5 R/R long on Gold
Accessing the Open Indicator
The MWD_XO_OPENS Indicator is freely available on TradingView, customizable for visual clarity (e.g., green for daily opens, yellow for monthly). It streamlines SR level identification, reducing manual charting efforts and enhancing trading efficiency.
Market Analysis: Asset Class Outlooks
🟡Gold
Q3 Outlook: Anticipates initial downside due to an inside monthly candle failure, targeting the 3120 support zone.
Long Entry: High-probability entry at 3057, with a stop-loss at 2971 and a target of 3500 (5.15 risk-reward ratio).
Aggressive Entry: Alternative entry at 3030, yielding an 8.23 ratio, reflecting gold's role as a risk-off asset.
Market Lean: Expects further downside into next month, at least in July, potentially testing the 3120 low.
Support Zone: Once the 3120 low is tested, it becomes a long opportunity area, now a support zone based on the inside daily candle failure.

Figure 7: Gold Swing long setup, once support zone get’s tapped

Cross-Market Correlations
Gold's Behavior: Exhibits risk-off behavior, inversely correlating with risk-on assets like the S&P 500, NASDAQ, Bitcoin, and USDJPY.
Implication: A bearish gold outlook suggests bullishness in these assets, with specific setups determining optimal trade entries.
Market Projection: Further downside is projected due to inside monthly candle failure, to be confirmed tomorrow, indicating gold's risk-off status.
Broader Impact: As a risk-off asset, gold's movement influences investor sentiment, affecting risk-on assets including S&P 500, NASDAQ, Bitcoin, DAX, Nikkei, and USDJPY.
Nikkei and Global Indices
S&P 500 and NASDAQ: The quarterly candle indicates exceptionally strong performance, currently at peak strength.
DAX: Demonstrates solid strength as well.
Nikkei Highlight: Stands out due to not yet reaching an all-time high, unlike other indices, with further explanation to follow.
📈Nikkei Analysis
Correlation: Exhibits a 100% correlation with the NASDAQ stock index; inverting the chart reveals market dips as spikes in volatility index.
Volatility Comparison: Crashes in Nikkei Index align with surge in volatility index, indicating Nikkei act’s as a global thermometer for Risk-On Appetite.
Global Impact: A Nikkei crash impacts the entire global financial complex, including S&P 500, DAX, NASDAQ, and other indices, driving volatility spikes.
Inverse Relationship: If the volatility index declines, it signals Nikkei is rising, which signals global Risk-On Appetite.
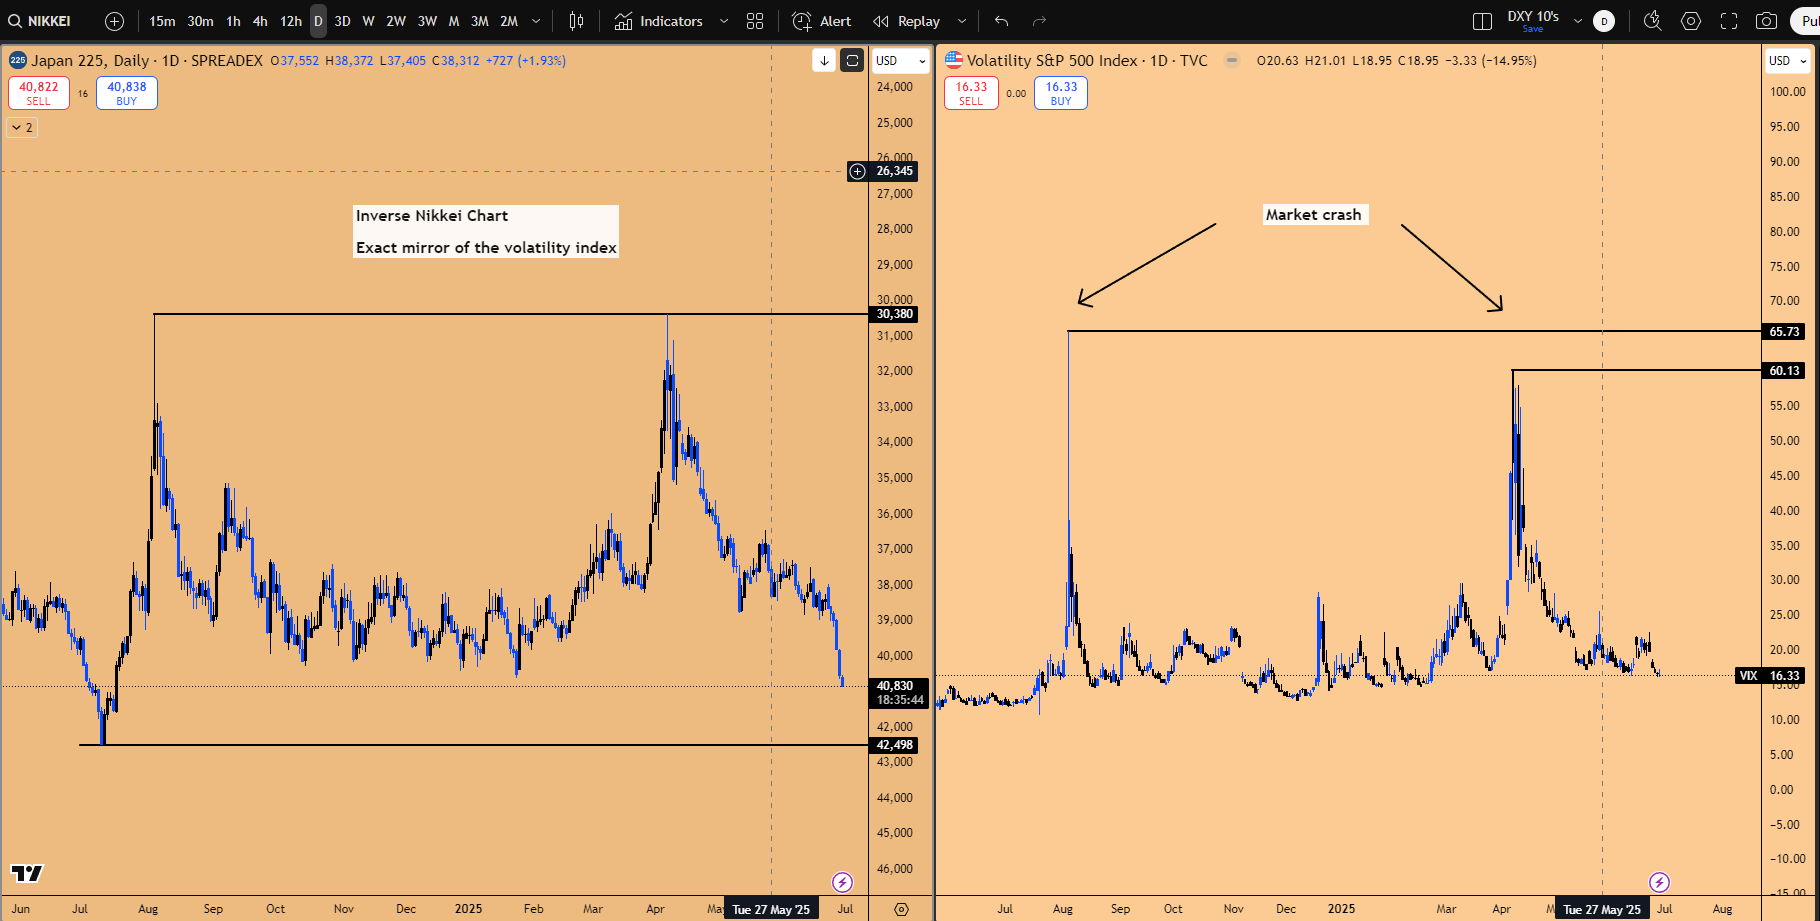
Figure 8 : Inverse Nikkei Daily chart vs Volatility Index
Market Setup and Projections
Nikkei Upside: Current setup suggests a bullish trend, with a potential 5% upside. The current pattern in play for Nikkei is Inside 3-month candle failure, signaling New All Time Highs are within reach for Nikkei.
Global Ripple Effect: A 5% Nikkei rise translates to a 5% upside for global stock indices; a 10% drop mirrors a 10% NASDAQ decline.
NASDAQ Outperformance: Likely to outperform Nikkei by 7-8% due to its growth focus, particularly in AI and technology sectors.
Strategic Advantage: Use Nikkei’s direction to inform trades in NASDAQ, US equities, or options, targeting top companies.
Currency Correlation: Strong link with USDJPY, with the next monthly candle expected to be upside due to Nikkei’s stable upside target.

Figure 9 : Inside quarterly candle Failure pattern in formation

Real-Time Insights
Recent Movement: Nikkei rose 2% in the Asian session last week, while NASDAQ remained flat at 0% (ahead of New york session open).
Early Indicator: Nikkei’s eight-hour lead provides a thermometer for economic activity, forecasting a NASDAQ rally when New York opens.
Bitcoin Correlation: Rising NASDAQ increases Bitcoin’s upward potential, creating a synergistic upward trend across all three assets.
📊 Amazon vs. NASDAQ
Amazon’s price action closely tracks the NASDAQ but offers superior returns at current levels. With an 8.5% upside to all-time highs (versus NASDAQ’s 5%), Amazon presents a compelling case for option calls, leveraging its outperformance potential.
Trade Amazon Option Calls for Higher Returns:
Option calls on Amazon with a two-month expiration to capture the projected 8.5% upside to all-time highs could yield significant returns, as Amazon is expected to follow the NASDAQ’s trend of reaching new highs.
Prioritize AMZN option calls over NASDAQ ETF (QQQ) option calls, as Amazon’s higher upside (8.5% vs. NASDAQ’s 5%) offers greater leverage
So if the indication is that NASDAQ has 5% upside, Amazon has more upside than NASDAQ, which means that if you buy option calls on Amazon, chances are those option calls will pay out a lot more in comparison to buying option calls on NASDAQ ETF: QQQ.

Figure 10: AMZN vs NASDAQ, AMZN has 8.5% upside to capture
💹 Bitcoin and NASDAQ Correlation
Optimizing Capital Allocation: Best Bang for the Buck
Key Question: As an analyst, identify the optimal asset for maximum return on investment.
Market Insights
Top Performer: NASDAQ has proven to be the best bang for the buck.
Bitcoin Transition: After Bitcoin approached all-time highs, capital was rotated from Bitcoin to NASDAQ, capitalizing on its sustained uptrend while Bitcoin stagnated sideways.
Alpha Influence: NASDAQ dictates Bitcoin’s movement as the alpha asset; Bitcoin does not influence NASDAQ.
Strategic Analysis
Directional Leadership: Historically, NASDAQ’s bullish trend drives Bitcoin’s performance; a NASDAQ crash would pull Bitcoin down with it.
No Independent Bullish Case: Bitcoin has never sustained a bullish run during a NASDAQ downturn.
Alpha-Beta Dynamic: Both are risk-on assets, with NASDAQ as the "big brother" guiding Bitcoin, the "little brother."
Tactical Adjustments
Reversed Moment: Recently, the typical NASDAQ-led dynamic reversed, prompting a strategic shift, to capture the upside on NASDAQ over Bitcoin.
Capital Rotation: With no all-time high from NASDAQ, while Bitcoin already sitting at all time highs; reallocating from Bitcoin was prudent, as no significant downturn was anticipated. It was evident in the moment that Nasdaq had the potential to provide better capital return over bitcoin.
Optimal Strategy: Rotating capital into NASDAQ, which maintained a strong uptrend, outperformed Bitcoin’s sideways movement in the past 2-week period.
Dynamic Allocation: Juggle hard-earned capital by identifying the asset with the highest upside potential, allocating based on market money flow and capital direction.
Forecast: Now that Both Bitcoin and NASDAQ are sitting close to all time highs, they both can move in synchrony, instead of one asset class leading the other.
₿ Bitcoin OutlookQ3 Forecast: Bitcoin’s performance is tied to NASDAQ’s sustained highs, with a potential pullback to 97,000 offering a long entry.
Trade Setup: Set a stop-loss at 93,000 and target 120,000, reflecting a 6-month bullish flag consolidation poised for a breakout.
Price Action: Current consolidation, a bullish channel formation, may mislead traders but signals significant upside potential with further development.

Figure 11: Bitcoin Long setup
🧠 Ethereum Analysis
Technical Signal: A quarterly candle close above key support-resistance (SR) levels indicates bullish potential, tempered by a bearish weekly short block formation.
Trade Opportunity: A dip to 1934 provides a long setup with a 7.1 risk-reward ratio, targeting 3200, contingent on testing the 1750-2142 support zone.
Risk Management: Invalidation occurs below 1751; expect a support test within the 1750-2142 range, previously a resistance area.

Figure 12: ETHUSD Dip Buying opportunity


📈 Dow Jones Index
Systematic Positioning and Dow Jones Outlook
Catalyst: JPMorgan’s upward turn has sealed a bullish case for Dow Jones, targeting 44,000.
Current Momentum: With JPM already at all-time highs, it signals Dow Jones will follow, projecting a 2.6% or 1,100-point rise to new peaks.
Timeline: This move could materialize as early as next week, within two to three days.
Entry Strategy: Utilize weekly or monthly open strategies to determine precise entry points for trading Dow Jones directly.
Trade Setup and Risk Management
Pattern Recognition: Dow Jones is forming an Inside 2-month candle Failure, which is suggesting 2.6% upside to new All time high as first target and
Long Position: A pullback to 43,084 offers a solid long entry, with potential to reach all-time highs and beyond.
Risk Parameters: Set a stop-loss at 42,800 and a target at 45,000, delivering an 8:1 risk-reward ratio.
Market Context: If a quarterly pullback occurs, this three-month window presents a prime opportunity for this strategic position.
The Dow Jones Industrial Average (DJIA) lags other indices, offering a 2.6% upside to all-time highs (44,000) and a longer-term target of 47,471 (1.272 Fibonacci extension). A pullback to 43,084 presents an 8:1 risk-reward long setup, driven by JPMorgan’s leadership.
“JPM is already sitting at all-time highs, JPM is already telling you that Dow Jones will go and hit all-time highs. Which means that you are looking at roughly 2.6% or 1,100 points rally on Dow Jones to all-time highs”

Figure 13: Dow Jones (US30) Long setup in play
Dow Jones vs. TSX Comparison
The Canadian TSX index, trading above all-time highs, foreshadows Dow Jones’ potential trajectory. Despite U.S. economic dominance, Dow Jones’ lag reflects underweight positioning, presenting a catch-up opportunity as stimulus and AI growth bolstering equities.
So this literally shows you on how underweight Americans are in U.S equities, that they are supposedly, I guess, you could call it political bias, you could call it the Fed bias, you could call it societal bias which has caused large chunks of capital to stay on the sidelines. That sidelined capital is looking to rush back into US equities
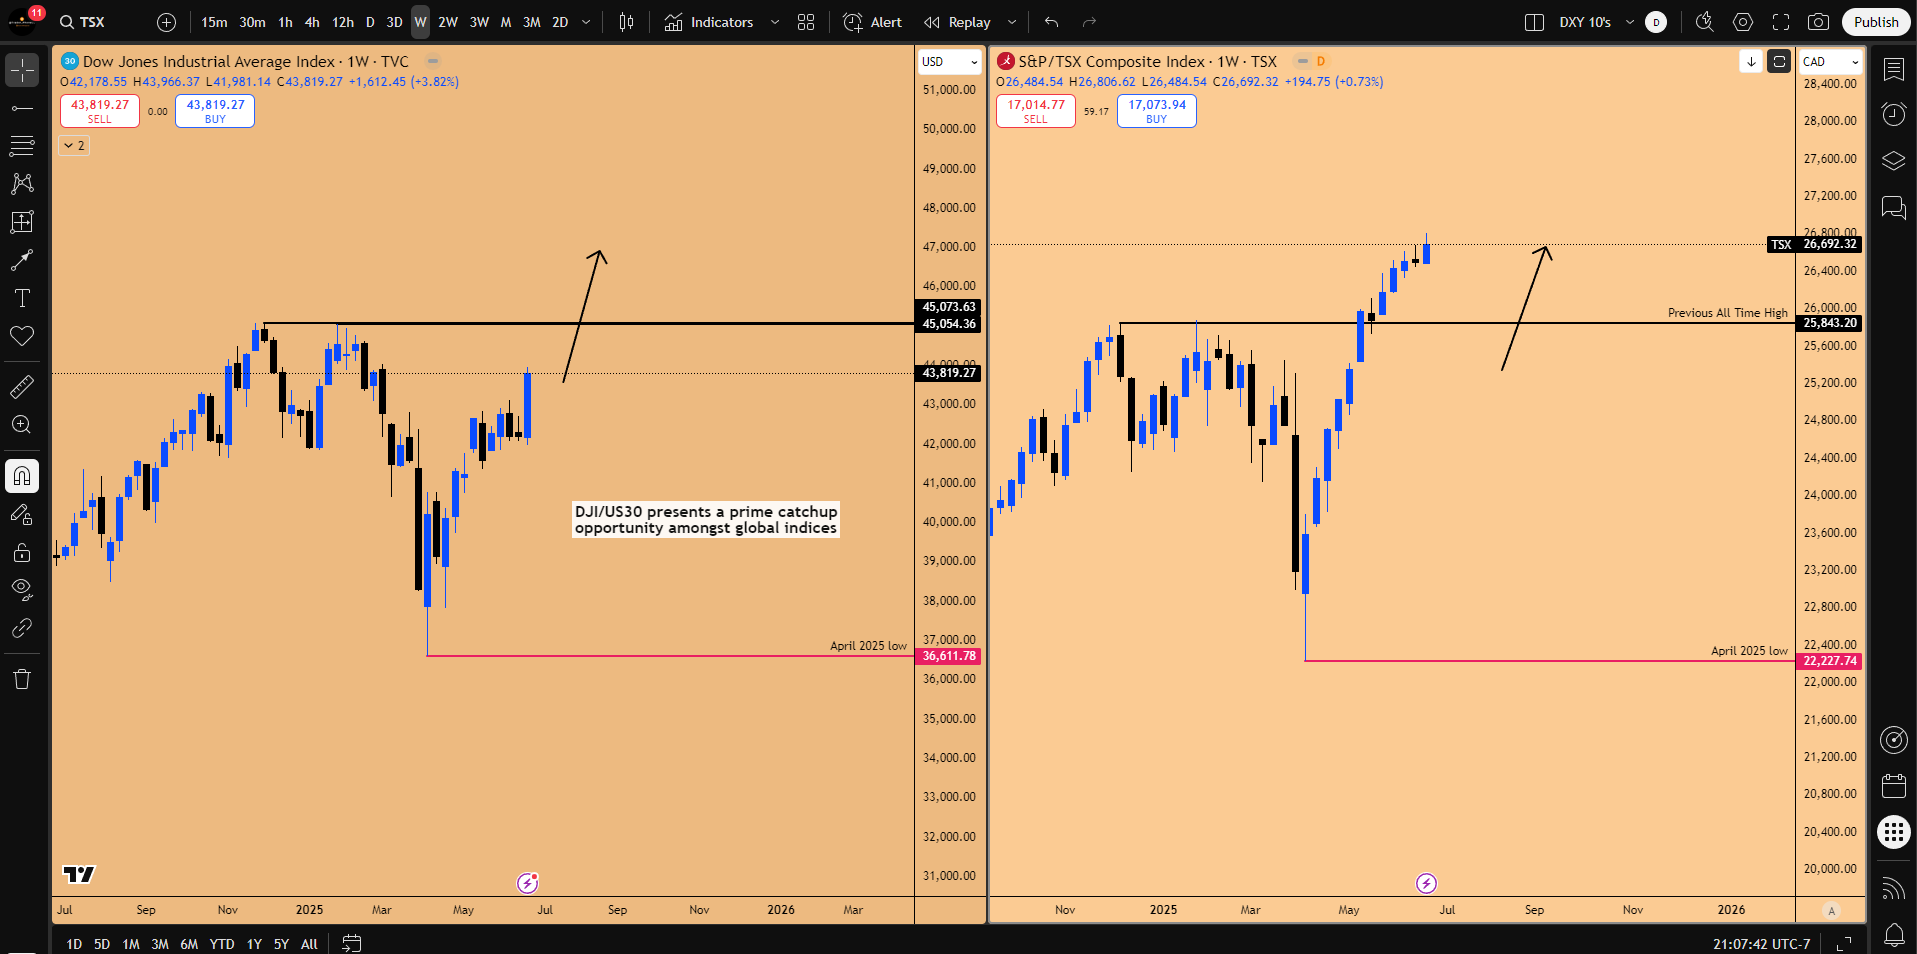
Figure 14: DJI/US30 vs TSX
The battle of the Indices
📊 DAX Index Analysis
Breakout Phase: The DAX index is experiencing a breakout, marked by a double inside daily candle, indicating sustained upward momentum.
Bullish Confirmation: The pattern of respecting previous daily lows reinforces a strong bullish outlook, with a target of all-time highs in Q3.
Momentum Insight: Once DAX gains traction, it tends to maintain its upward trajectory with relentless momentum.
Price Fractals in DAX
Historical Parallel: The current rally aligns with a 2018 S&P 500 fractal, featuring a 20% crash followed by a 27.79% rally and a 7.6% pullback.
Projection: This fractal suggests a continued rally through July, potentially culminating at the next FOMC meeting.
So my thinking is that DAX is pretty much following the price fractal where we are just in the middle of making this push from here, all the way there. You know, funnily enough, we are in the same timeline as well, that this push is happening in the middle of June, and it should keep going to push till July end, till next FOMC meeting.
Systematic Positioning and Volatility
Fund Positioning: Systematic funds, including CTAs and volatility control funds, remain underweight in equities, ready to inject $40-50 billion into the S&P 500 as all-time highs continue.
Volatility Insight: A technical setup with an inside quarterly candle failure in the VIX points to declining volatility and sustained equity upside.
Market Dynamics: The underweight positioning suggests further capital inflow, amplifying potential gains as funds shift to overweight equities.
Selected Trade Setups for Q3, 2025
The corresponding charts for AAPL and TSLA can be found in our previous post on U.S. Indices: Liquidity Dynamics, and the Coming AI Super-Cycle.
Apple Setup
Pattern: A rare double inside monthly candle signals an imminent breakout for Apple.
Catalysts: Enhanced by July’s favorable seasonality and upcoming earnings on July 23, 2025.
Growth Potential: A 30% rally to all-time highs is feasible, fueled by AI-driven consumer demand and Apple’s 10.5% weight in the NASDAQ.
Market Dynamics: Apple rarely remains stagnant, with significant price movement expected soon.
Tesla Setup
Pattern: An inside quarterly candle failure indicates upside potential following a retest at 273 support.
Trade Strategy: Long entry at 273 support, with a stop below and a target at all-time highs, yielding a 5.6 risk-reward ratio.
Strength: Supported by Tesla’s ongoing AI-driven transformation, reinforcing the robustness of the support zone.
🆕 Emerging Opportunities: eVTOL Companies
Key Players: Archer Aviation and Joby Aviation, pioneers in electric Vertical Takeoff and Landing (eVTOL) technology, offer compelling long-term investment potential.
Product Launch: First air taxi prototypes are scheduled for debut in November 2025 in Dubai, UAE.
Growth Potential: Post-launch, these stocks could experience 100-150% rallies, driven by market enthusiasm.
Technological Edge: Archer’s partnership with Anduril bolsters its credibility and technological innovation.
Disclosure: Currently, both companies lack cash flow and operational products, with the November, 2025 launch marking their commercial entry point, likely triggering significant stock momentum.

Figure 15: Multi Year Consolidation in Joby Aviation threatening breakout

🧭 Closing and Audience Q&A
The outlook concludes with a focus on selective currency trades, notably USDJPY, which offers a short setup at 151.946. Other currencies, like USDCAD and EURUSD, require further price action clarity. Patience and disciplined trade execution are emphasized.
Key points to take away:
Strategic Portfolio Rebalancing: The discussion highlighted the critical role of portfolio rebalancing at the start of a new quarter, driven by institutional investors reshuffling their holdings. This process creates significant market volatility, particularly in the final trading hour, offering traders opportunities to capitalize on momentum in risk-on assets like tech-heavy indices and growth stocks such as the Magnificent Seven.
Candlestick Analysis for Trade Setups: Understanding candlestick patterns, particularly the formation of wicks and flat opens, is essential for anticipating market reversals and expansions. The use of tools like the MWD_XO_OPENS indicator simplifies identifying key levels (weekly, monthly, quarterly opens), enabling traders to frame high-probability trade setups with tight risk management, as demonstrated in examples with gold and Bitcoin.
Cross-Market Correlations and Opportunities: The live stream emphasized the importance of cross-market analysis, revealing strong correlations between assets like Nikkei and NASDAQ, or Dow Jones and JPM. By following money flow and identifying lagging assets, traders can allocate capital to setups with superior risk-reward ratios, such as Dow Jones targeting a 1.2725 extension or emerging opportunities in eVTOL companies like Archer Aviation.