

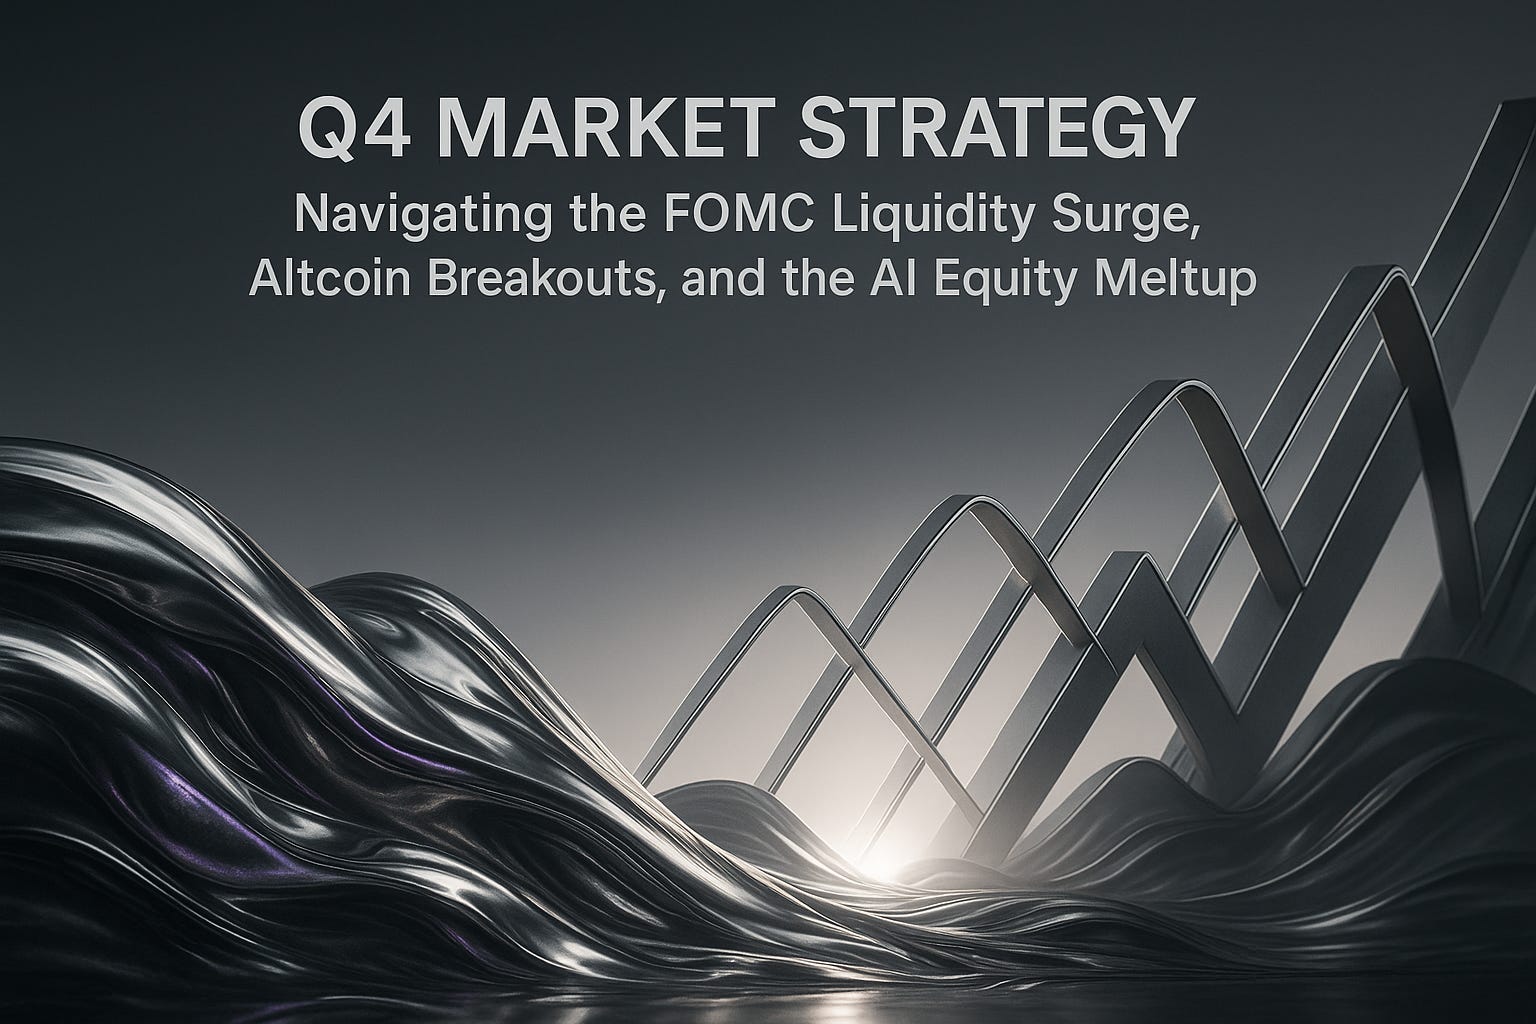
Q4 Market Strategy: Navigating the FOMC Liquidity Surge, Altcoin Breakouts, and the AI Equity Meltup

📈 Executive Summary: The "Crash Up" Scenario and Positioning for Q4 Expansion
Let’s dive into critical analysis of navigating the final 16 days of the third quarter and position for what is seasonally the strongest period for risk-on assets. The market is bracing for a pivotal FOMC meeting this week, an event poised to inject a “massive flow of liquidity” and “reset everything.”The convergence of the quarterly close and shifting monetary policy necessitates a clear game plan, as Q4 historically exhibits a strong risk-on bias. The central thesis? We are firmly in a Meltup Phase, driven by excessive liquidity first introduced by the "Big Beautiful Bill" in April and now set to be exacerbated by Federal Reserve rate cuts. The market anticipates a 25-point rate cut this week, with expectations already pricing in three rate cuts this year and a full easing cycle in force by 2026. This environment is creating a "melt up" scenario, characterized by relentless upward movement without significant pullbacks, as seen in the NASDAQ printing six consecutive bullish monthly candles. In this landscape, the biggest risk facing investors is not being in the market.
In the crypto sphere, Bitcoin (BTC) is exhibiting bullish consolidation. Despite an active inside monthly candle failure pattern, the market structure remains constructive, defined by consistent higher lows on the monthly and quarterly charts. This suggests a large consolidation, potentially an ascending triangle, rather than a reversal. The critical level to watch is the $108,353 S/R level; a quarterly close above this confirms the bullish consolidation and signals a massive Q4 move. Bitcoin's sideways action ongoing since May 2025—is the catalyst for Altcoin Season. Ethereum (ETH) is breaking out of a 2.5-year consolidation zone, targeting $10,000, supported by strong levels between $3,500 and $3,960. Key setups include Solana (SOL), which is lagging the M2 money supply and poised to catch up to all-time highs, and Stellar Lumens (XLM), which is confirming an inside three-week candle failure suggesting a move toward $1 or even $2, offering superior risk-reward (2.82R) compared to XRP. SUI also presents a compelling long trigger based on Inside 3-week candle failure pattern.
Equities are displaying extreme bullish momentum, driven by strong correlations and the dominant AI Revolution narrative. The NASDAQ is heavily correlated with the Nikkei index, which signaled a massive quarterly expansion that is pulling US indices higher. While the DAX (German 40) presents the "Setup of the Year" with a triple inside three-week candle consolidation offering an 8R swing trade targeting 26,000, the focus remains on US equities where the stimulation is concentrated. Companies like Google and Oracle have shown explosive growth, and Microsoft (MSFT) is positioned to outperform significantly due to extensive AI partnerships (xAI, Anthropic, Government contracts) that far surpass Oracle's recent reports. We are entering an era reminiscent of the tech bubble boom, with AI companies potentially rising 50% to 100% in the next 1-2 years. Lagging plays like Amazon (AMZN) (targeting $292) and Netflix (NFLX) offer significant upside, with Netflix specifically poised to benefit as AI drastically reduces movie production costs (e.g., from $400M to $50M), sending profit margins "bazooka up."
How should you position for this environment? This breakdown details specific trade setups, explores utilizing prop firms like FTMO for risk-managed leverage, and emphasizes the urgency of participating in this technology-driven meltup.
Key Takeaways:
Impending Liquidity Flood: Anticipate a 25-point Fed rate cut this week, kicking off a stimulation cycle extending into 2026, fueling the "crash up" scenario.
Bitcoin Consolidation Before Expansion: BTC is forming a bullish consolidation with higher lows; a Q4 breakout is expected if $108,388 holds on the quarterly close.
Altcoin Season in Effect: Focus on XLM (targeting $1-$2), Solana (playing catch-up to M2 supply), and SUI as money rotates from sideways Bitcoin.
DAX "Setup of the Year": A highly consolidated triple inside three-week candle offers an 8R swing opportunity targeting 26,000.
AI Equities Dominance: Microsoft is the alpha play for Q4; Amazon and Netflix offer significant upside as lagging AI beneficiaries poised for massive profit expansion.
💹 Macro Catalysts: Q3 Close, FOMC, and the Liquidity-Driven Meltup
As we reach the end of the third quarter, it is crucial for traders to zoom out and analyze the higher time frames. The market is entering a critical phase defined by the convergence of the quarterly close, impending monetary policy shifts, and strong seasonal trends favoring risk-on assets.
The Crucial Quarterly Close and Q4 Seasonality
We are just 16 days away from closing the three-month candle. It is highly recommended to examine the three-month charts across every asset class to understand how these crucial candles are shaping up. This close sets the stage for the last quarter of the year (Q4), which seasonally tends to exhibit a strong risk-on bias. October, in particular, is expected to be a very bullish month for risk appetite, coinciding with the start of the tech earnings season.
FOMC: The Liquidity Reset
The FOMC meeting scheduled for this week is the immediate catalyst poised to create a “massive flow of liquidity in the markets” and “reset everything.” This event is central to the game plan for the coming weeks and the next quarter.
The anticipation is that the September FOMC meeting will result in a 25-point rate cut by the Fed. This action is expected to make the market “go a bit bonkers.” Furthermore, the Fed's forward guidance will be critical. If they indicate that the next FOMC meeting will also involve a rate cut, the market will immediately start pricing it in.
The current understanding is that the market is already pricing in three rate cuts this year. Market practitioners are heavily pricing in these cuts, anticipating that the entire rate cycle will be in full force going into 2026. This information necessitates adopting a bullish bias across risk assets, recognizing the Fed is adding more liquidity even though the markets already have significant liquidity within them.
The "Meltup" Phase and the "Crash Up" Scenario
This environment of increasing liquidity is the foundation of the current market dynamic. It builds upon the liquidity introduced back in April via the "big beautiful bill," which was the primary driver for the rally from the April lows. The upcoming Fed rate cuts will exacerbate this effect.
This leads to a critical understanding: We are in a meltup phase.
“The biggest risk you can be is not being in the market because the market is not going to give you a pullback. You will just see market participants betting market prices higher, higher, higher...”
This resembles the action in equities, where the market moves higher week after week without printing down candles. The monthly chart on the NASDAQ, for instance, shows six consecutive bullish candles in a row. The headwinds are all to the upside, creating a "crash up" scenario not a crash down. This means the market keeps chugging along until it finally reaches a blowoff top, where the expansion goes berserk and peak euphoria enters the market.
Currently, the crypto market has yet to reach this phase, having traded sideways for approximately four months, since May 2025. This sideways action must be recognized as consolidation, setting the stage for the next major expansionary move.
📊 Bitcoin Analysis: Consolidation, Higher Lows, and the Quarterly Close
Following the macro overview, attention shifts to Bitcoin (BTC). The bias last week was specifically to the upside, driven by the weekly chart dynamics: an inside weekly candle and an open gap acting as a draw on liquidity. That gap has now been filled, necessitating a shift in bias as we approach the critical quarterly close.
Neutral Bias Amid Monthly Patterns
With the weekly gap filled, the bias shifts to neutral due to the active inside monthly candle failure pattern. A common question arises: if this bearish pattern is active, why isn't the market going down? The answer lies in the fact that the monthly candle is still open.
If the current candle closes above the recent highs, it must be interpreted as consolidation rather than an outright reversal. Crucially, this consolidation is inherently bullish because Bitcoin is creating higher lows on the monthly chart.
The Significance of Higher Lows and Potential Ascending Triangle
Attention should be focused on the sequence of higher lows on the quarterly chart, as the current higher low is sitting right above the previous quarterly low. This structure indicates a very decent possibility that the market is undergoing a consolidation phase.
This could manifest as an ascending triangle, filling the open space over the next two weeks before the quarterly candle closes. Given the bullish catalysts in October—tech earnings and the impact of the expected FOMC rate cuts—the anticipation is that this consolidation will break out once the new quarterly candle opens. The pattern of higher lows is expected to continue unfolding through October, November, and December.
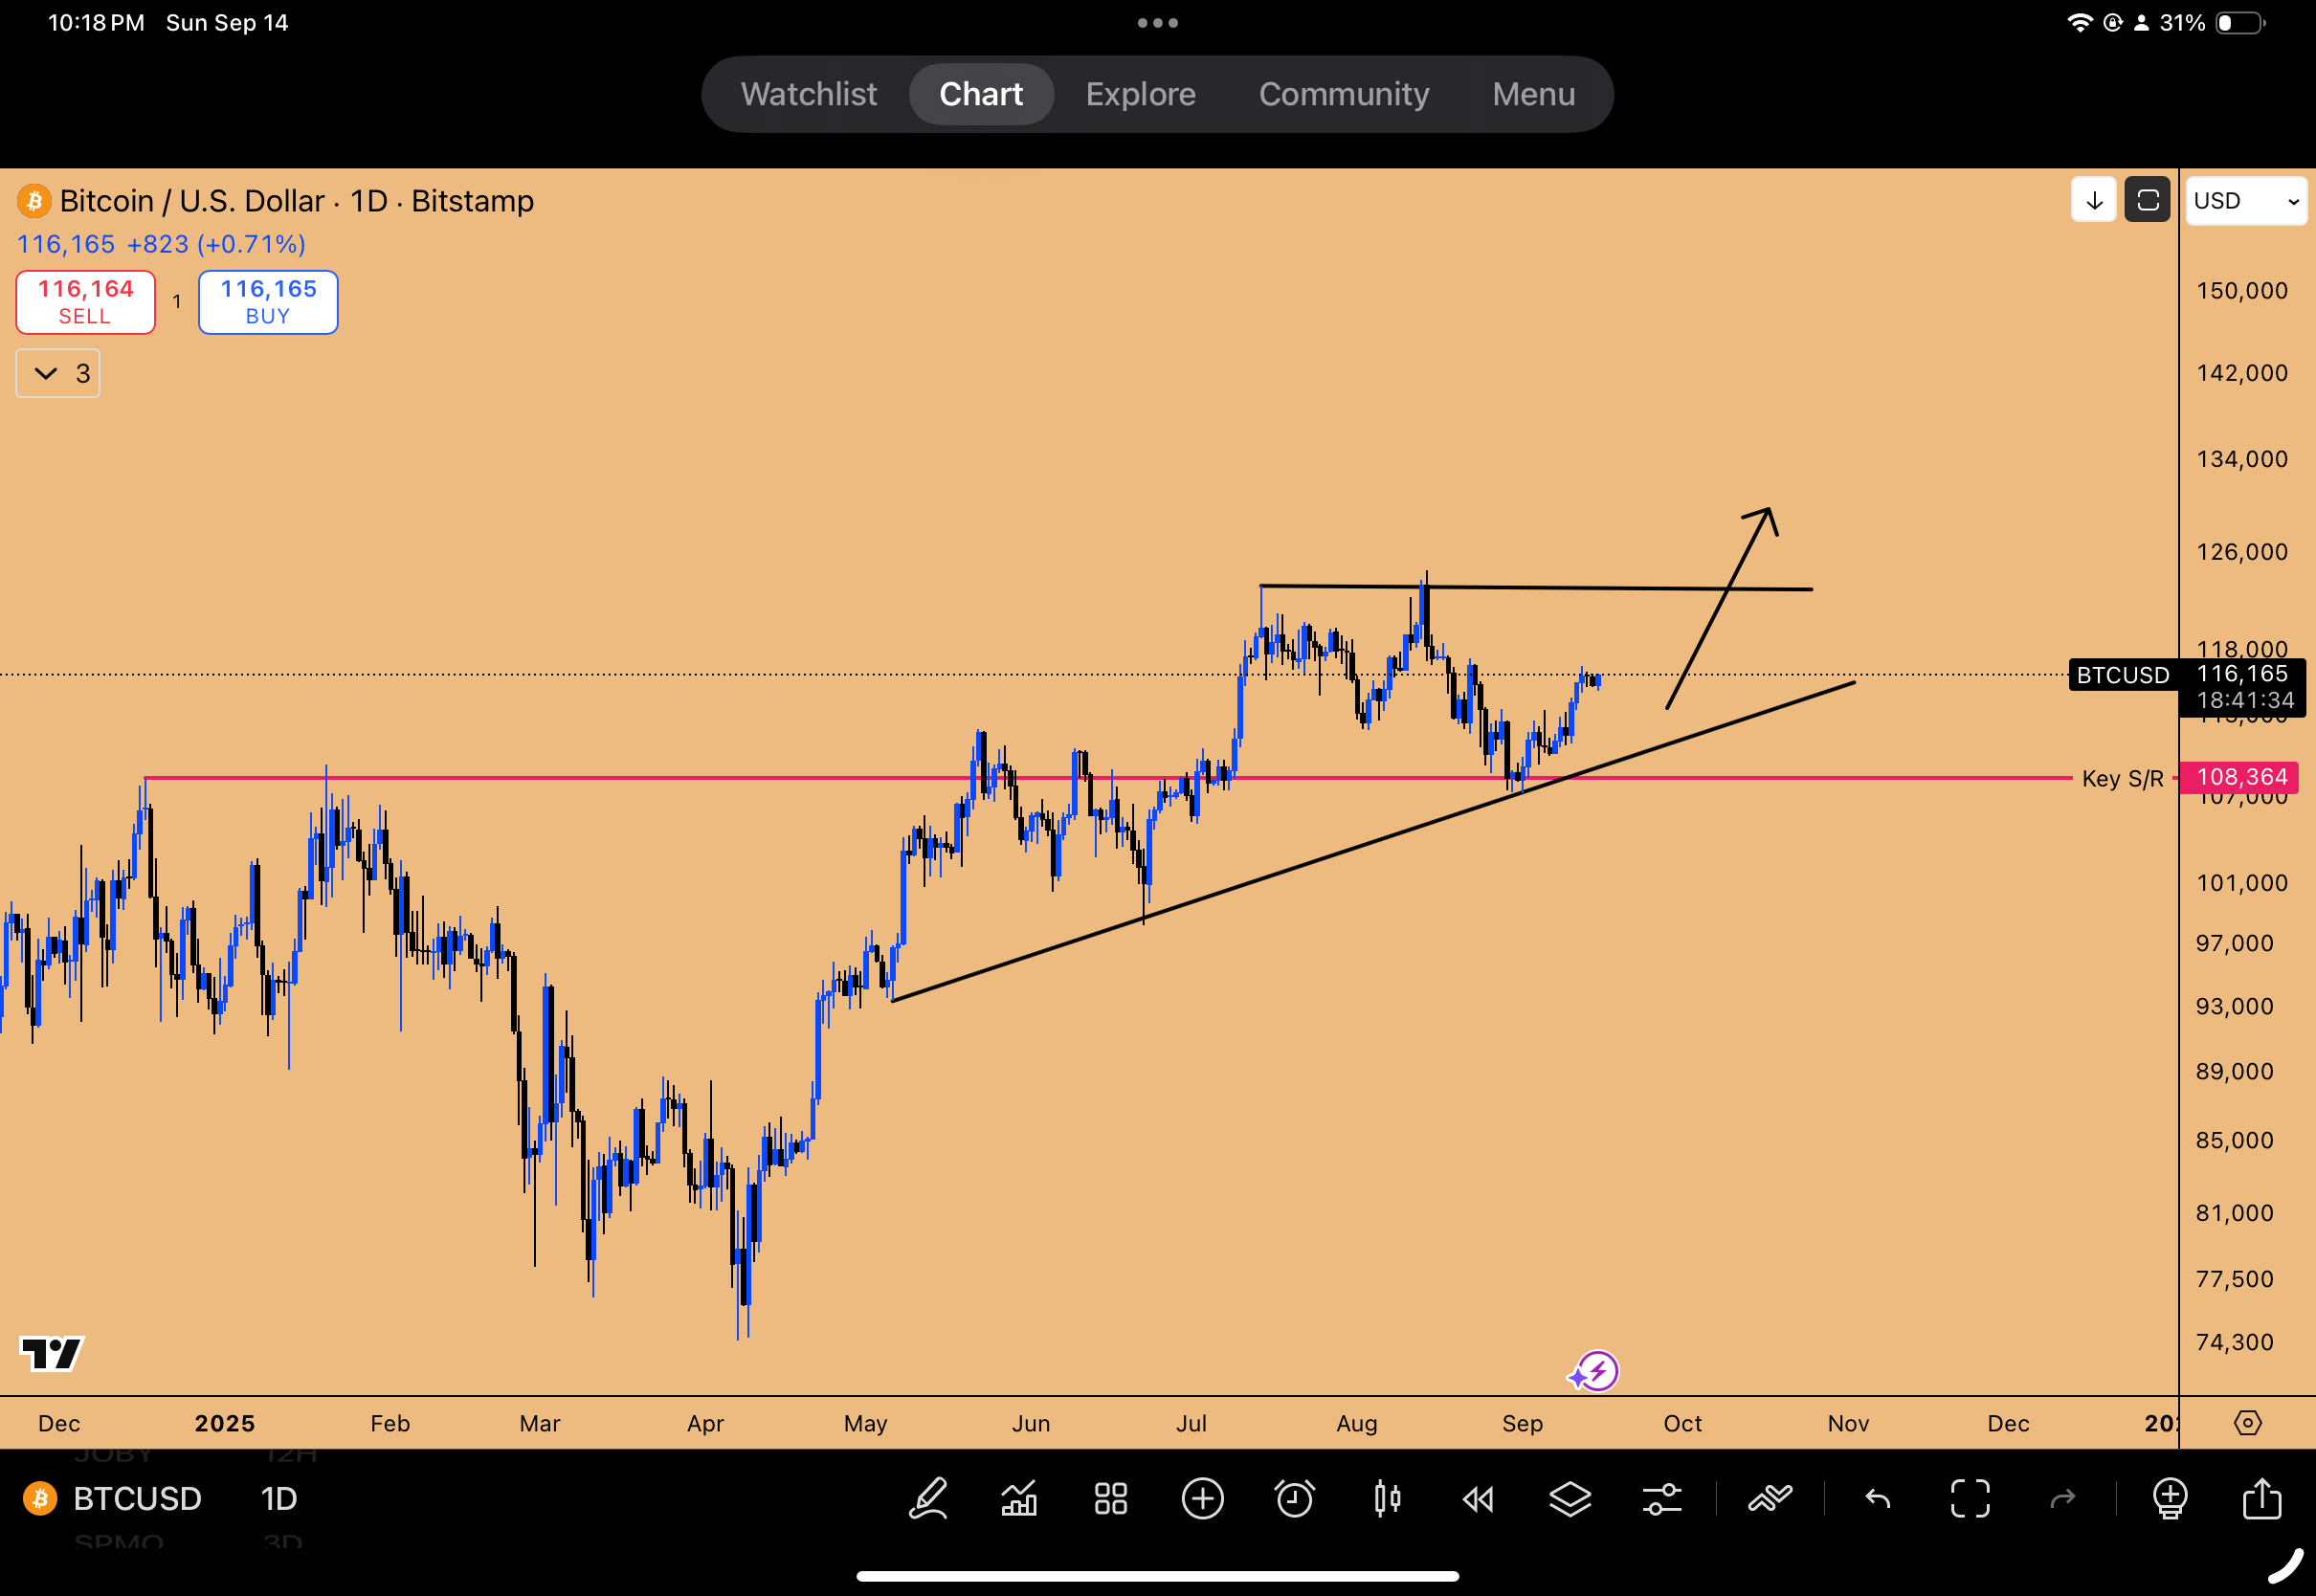
Figure 1: BTCUSD ascending triangle setup in play
Critical S/R Levels and the Quarterly Close
The critical level for the quarterly close is the $108,388 S/R level (also referenced as $108,353). It is imperative that the quarterly candle closes above this level.
Bullish Scenario: A close above $108,388 confirms the consolidation narrative, suggesting the market is preparing for a massive move to the upside in Q4. This aligns with Bitcoin's historically strong seasonal performance in Q4.
Bearish Scenario: A close below this level would constitute a Swing Failure Pattern (SFP) on the quarterly chart, a bad signal for the bulls.
On lower time frames, the weekly chart indicates a clear higher low, supporting the consolidation thesis. On the daily chart, an untested resistance zone sits around $120k; a pullback can be expected if this level is reached.
The Gold Parallel: Breaking Macro Resistance
The current four-month sideways action in Bitcoin is a classic macro consolidation at a resistance zone. A pattern frequently observed in bullish consolidations is the repeated tapping of resistance while forming higher lows. The market taps the resistance, rejects, finds support at a higher low, rallies into resistance again, and eventually breaks out aggressively without giving a market structure break to the bear side.
A recent example of this was observed in Gold (XAU/USD). Gold tagged its resistance zone, pulled back without breaking the higher low, banged into the resistance again, formed another higher low, and eventually broke out, leading to a massive rally.
This is macro consolidation on higher time frames. When the breakout occurs, it must be held with conviction—“you have to trade the chart, not your P&L.” Bitcoin is anticipated to follow this pattern, eventually breaking resistance and producing “massive bonanza candles” on the two-week or three-week charts. If Bitcoin is consolidating and it’s bullish, this creates a prime environment for altcoins to do well.
🌊 Ethereum's Breakout Trajectory and the Altcoin Wave
With Bitcoin consolidating in a bullish manner, the environment is primed for Ethereum and altcoins to outperform. The pattern for altcoin season always emerges when Bitcoin is going sideways while maintaining a higher timeframe bullish structure. Money rotates from Bitcoin into altcoins, causing them to pop off.
Ethereum's Path to $10,000
Ethereum (ETH) is developing key chart patterns, although positioning requires caution ahead of the quarterly close due to the risk of a "rug pull"—a sharp pullback just before the close that creates a large wick. It is prudent to wait for the quarterly candle to close with conviction before engaging heavily.
The strong quarterly close anticipated supports the theory that the entire consolidation zone, which has been developing for 2.5 years, is now in breakout mode. Ethereum is breaking out of a large triangle formation.
This breakout is likely to take Ethereum to the first target of $10,000. This target has been maintained since ETH was trading around $3,500-$3,600. If Ethereum confirms the breakout phase, the rally to $10k will drive significant performance across the altcoin market.
Inside Candle Patterns and Key Support Levels
The key pattern currently in development is the inside three-week candle. The recent downward move fell just $10 shy of testing the major S/R level at $4,116.
Given this formation, if the next candle sweeps the low, it would test the $4,116 S/R level and take downside liquidity. This presents a clear trading opportunity:
Trade Setup: A blind limit order at $4,127 for Ethereum.
The two-week chart also shows a clear inside candle formation and a confirmed two-week bullish order block. If a downward move occurs before the quarterly close, it would run into massive support between $3,500 and $3,960. This confluence of support keeps Ethereum buoyant going into the next quarter.
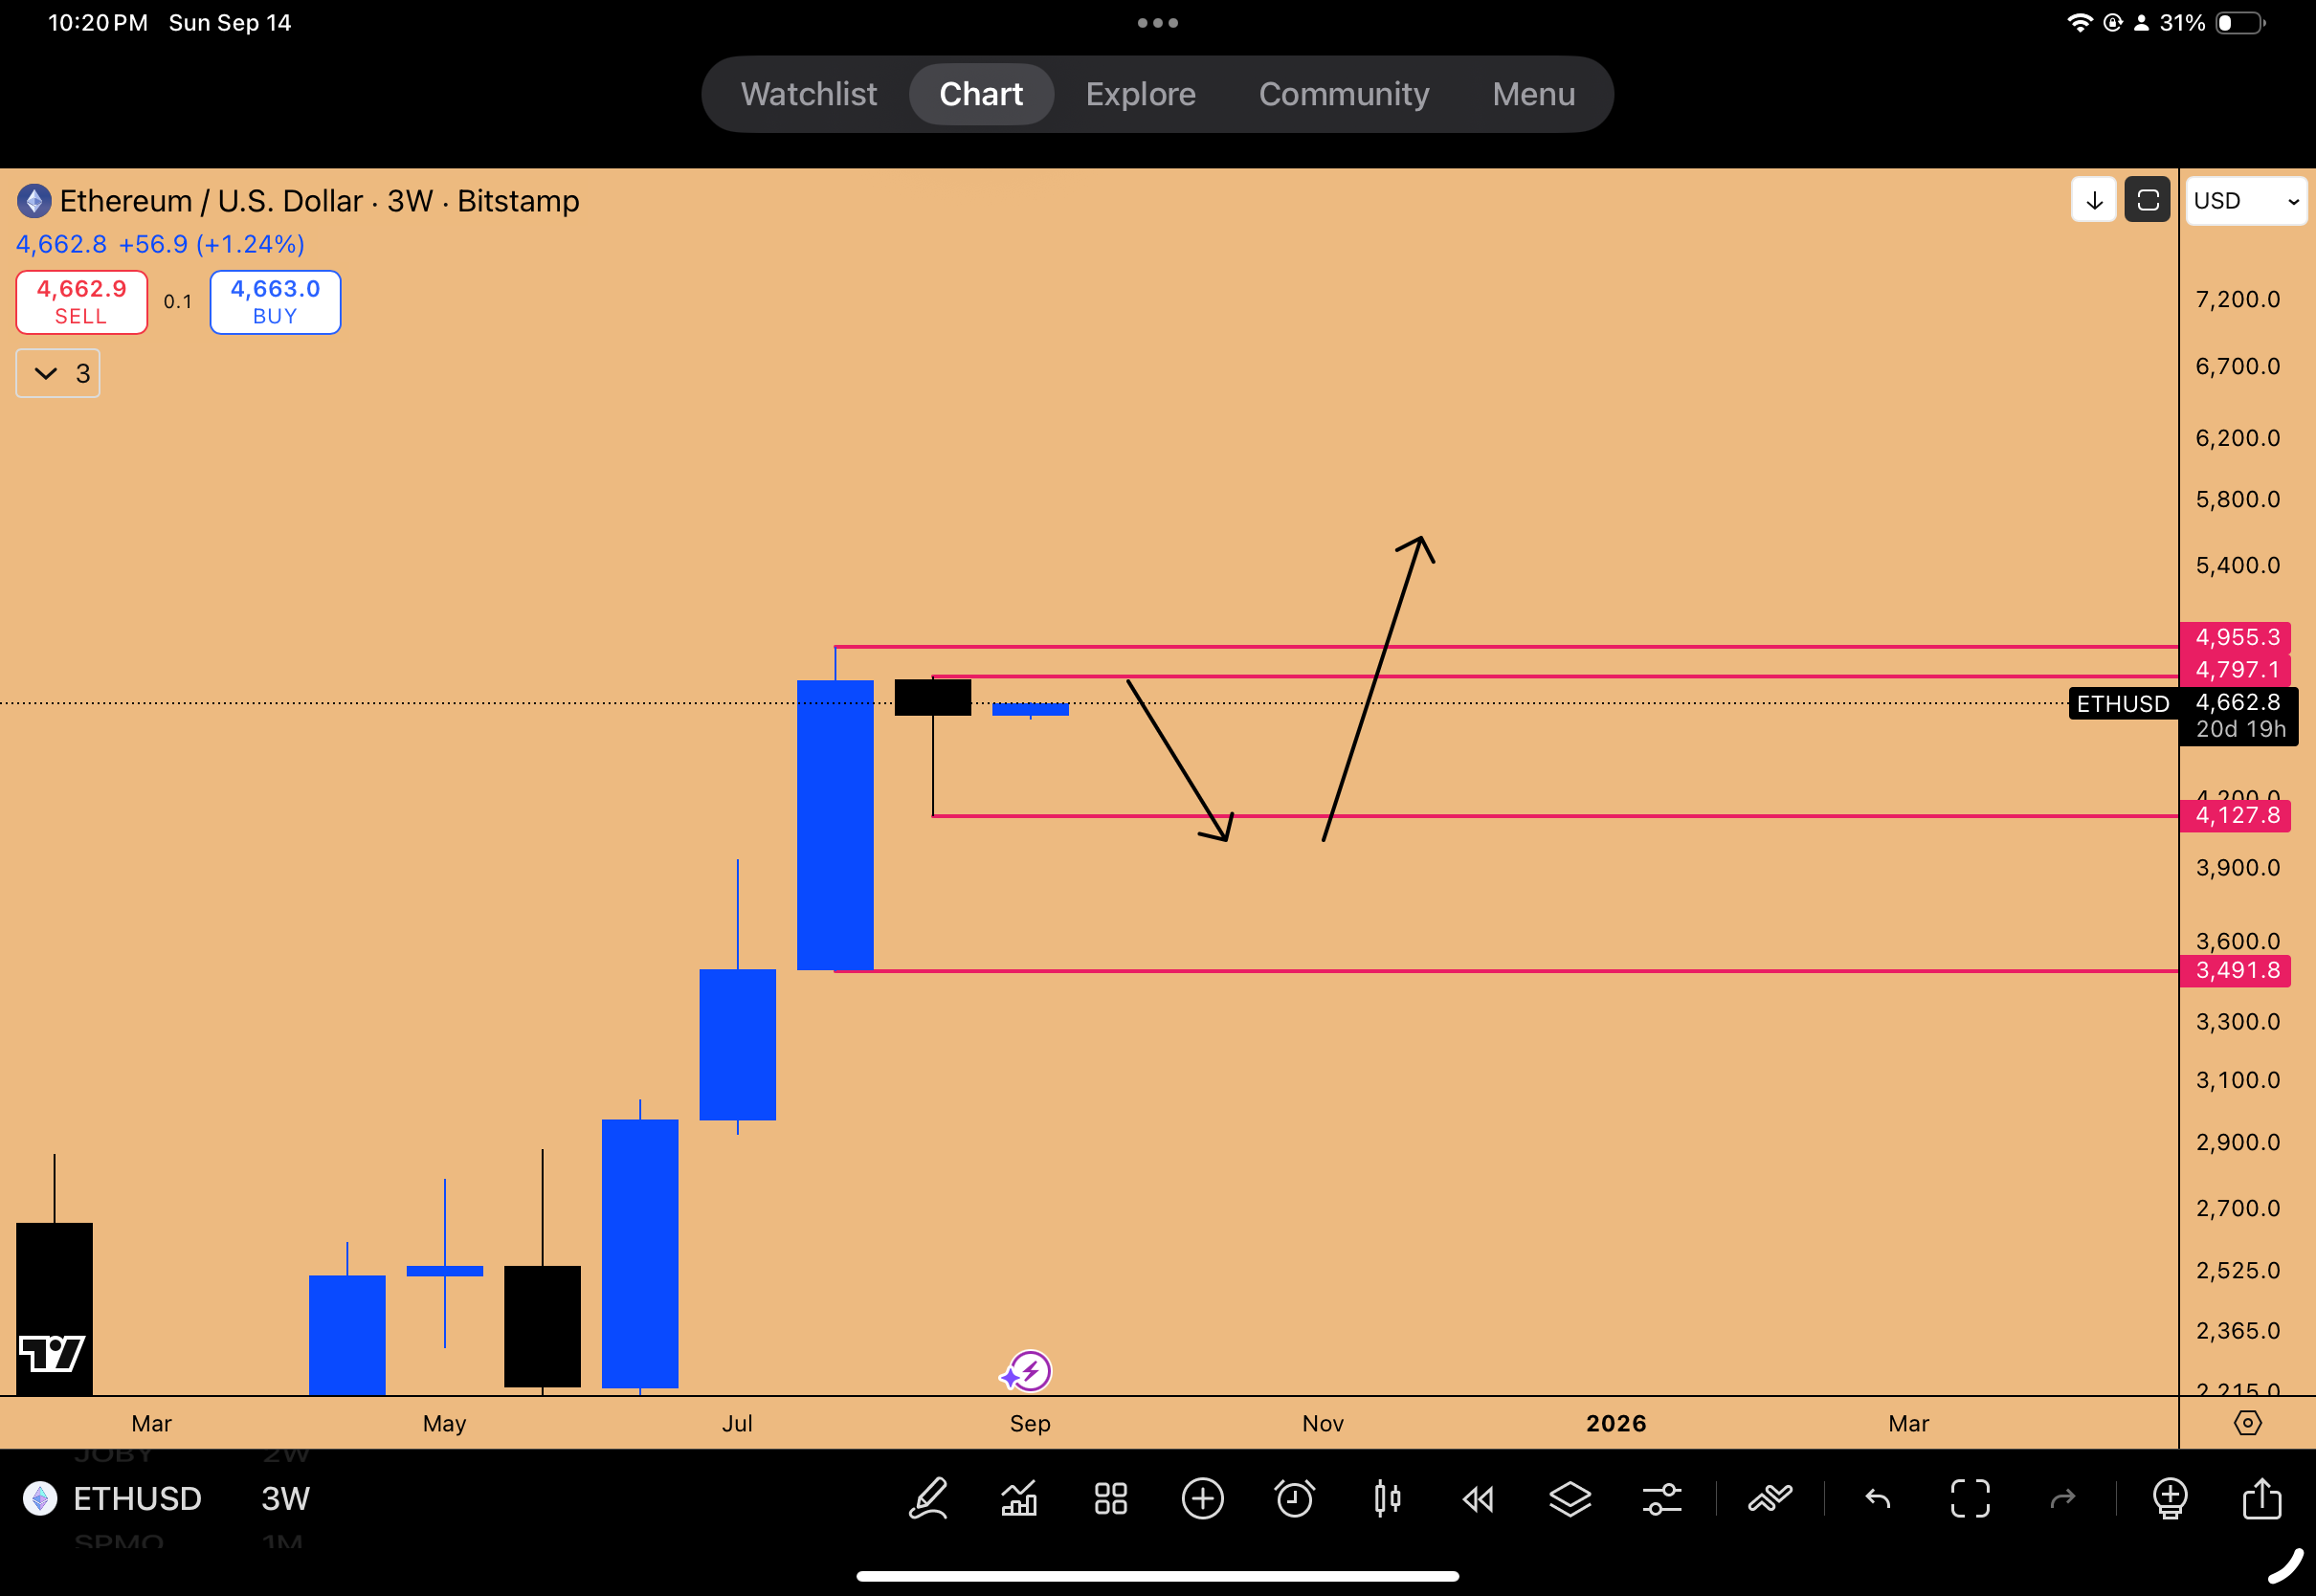
Figure 2: Inside 3-week candle pattern in play for ETHUSD
Deep Dive: High-Probability Altcoin Setups
The current environment confirms that altcoin season is very much in effect, evident by ETH's recent run and Solana's current movement. Traders need to be focusing on altcoins during this phase.
Solana (SOL): Lagging M2 Supply and Catch-Up Potential
Solana is considered the best bet going into the quarter end. It is the only major altcoin that has not yet made a new all-time high, still having approximately 22% upside to capture (down from 40-45% previously).
Technically, Solana is showing proper expansion. The main daily S/R level at $209 was recently broken after significant consolidation. The market tagged this level repeatedly, pulling back each time while making higher lows. This bullish market structure eventually broke the resistance, and the market "went berserk."
A crucial cross-market correlation supports the bullish thesis: the M2 money supply. Analysis shows that Solana follows the M2 money supply with a lag. If the M2 money supply is already sitting at a level corresponding to Solana being at all-time highs, it means Solana is currently being offered at a discount. It is expected to catch up to the M2 money supply eventually, with the lag likely being resolved in Q4.
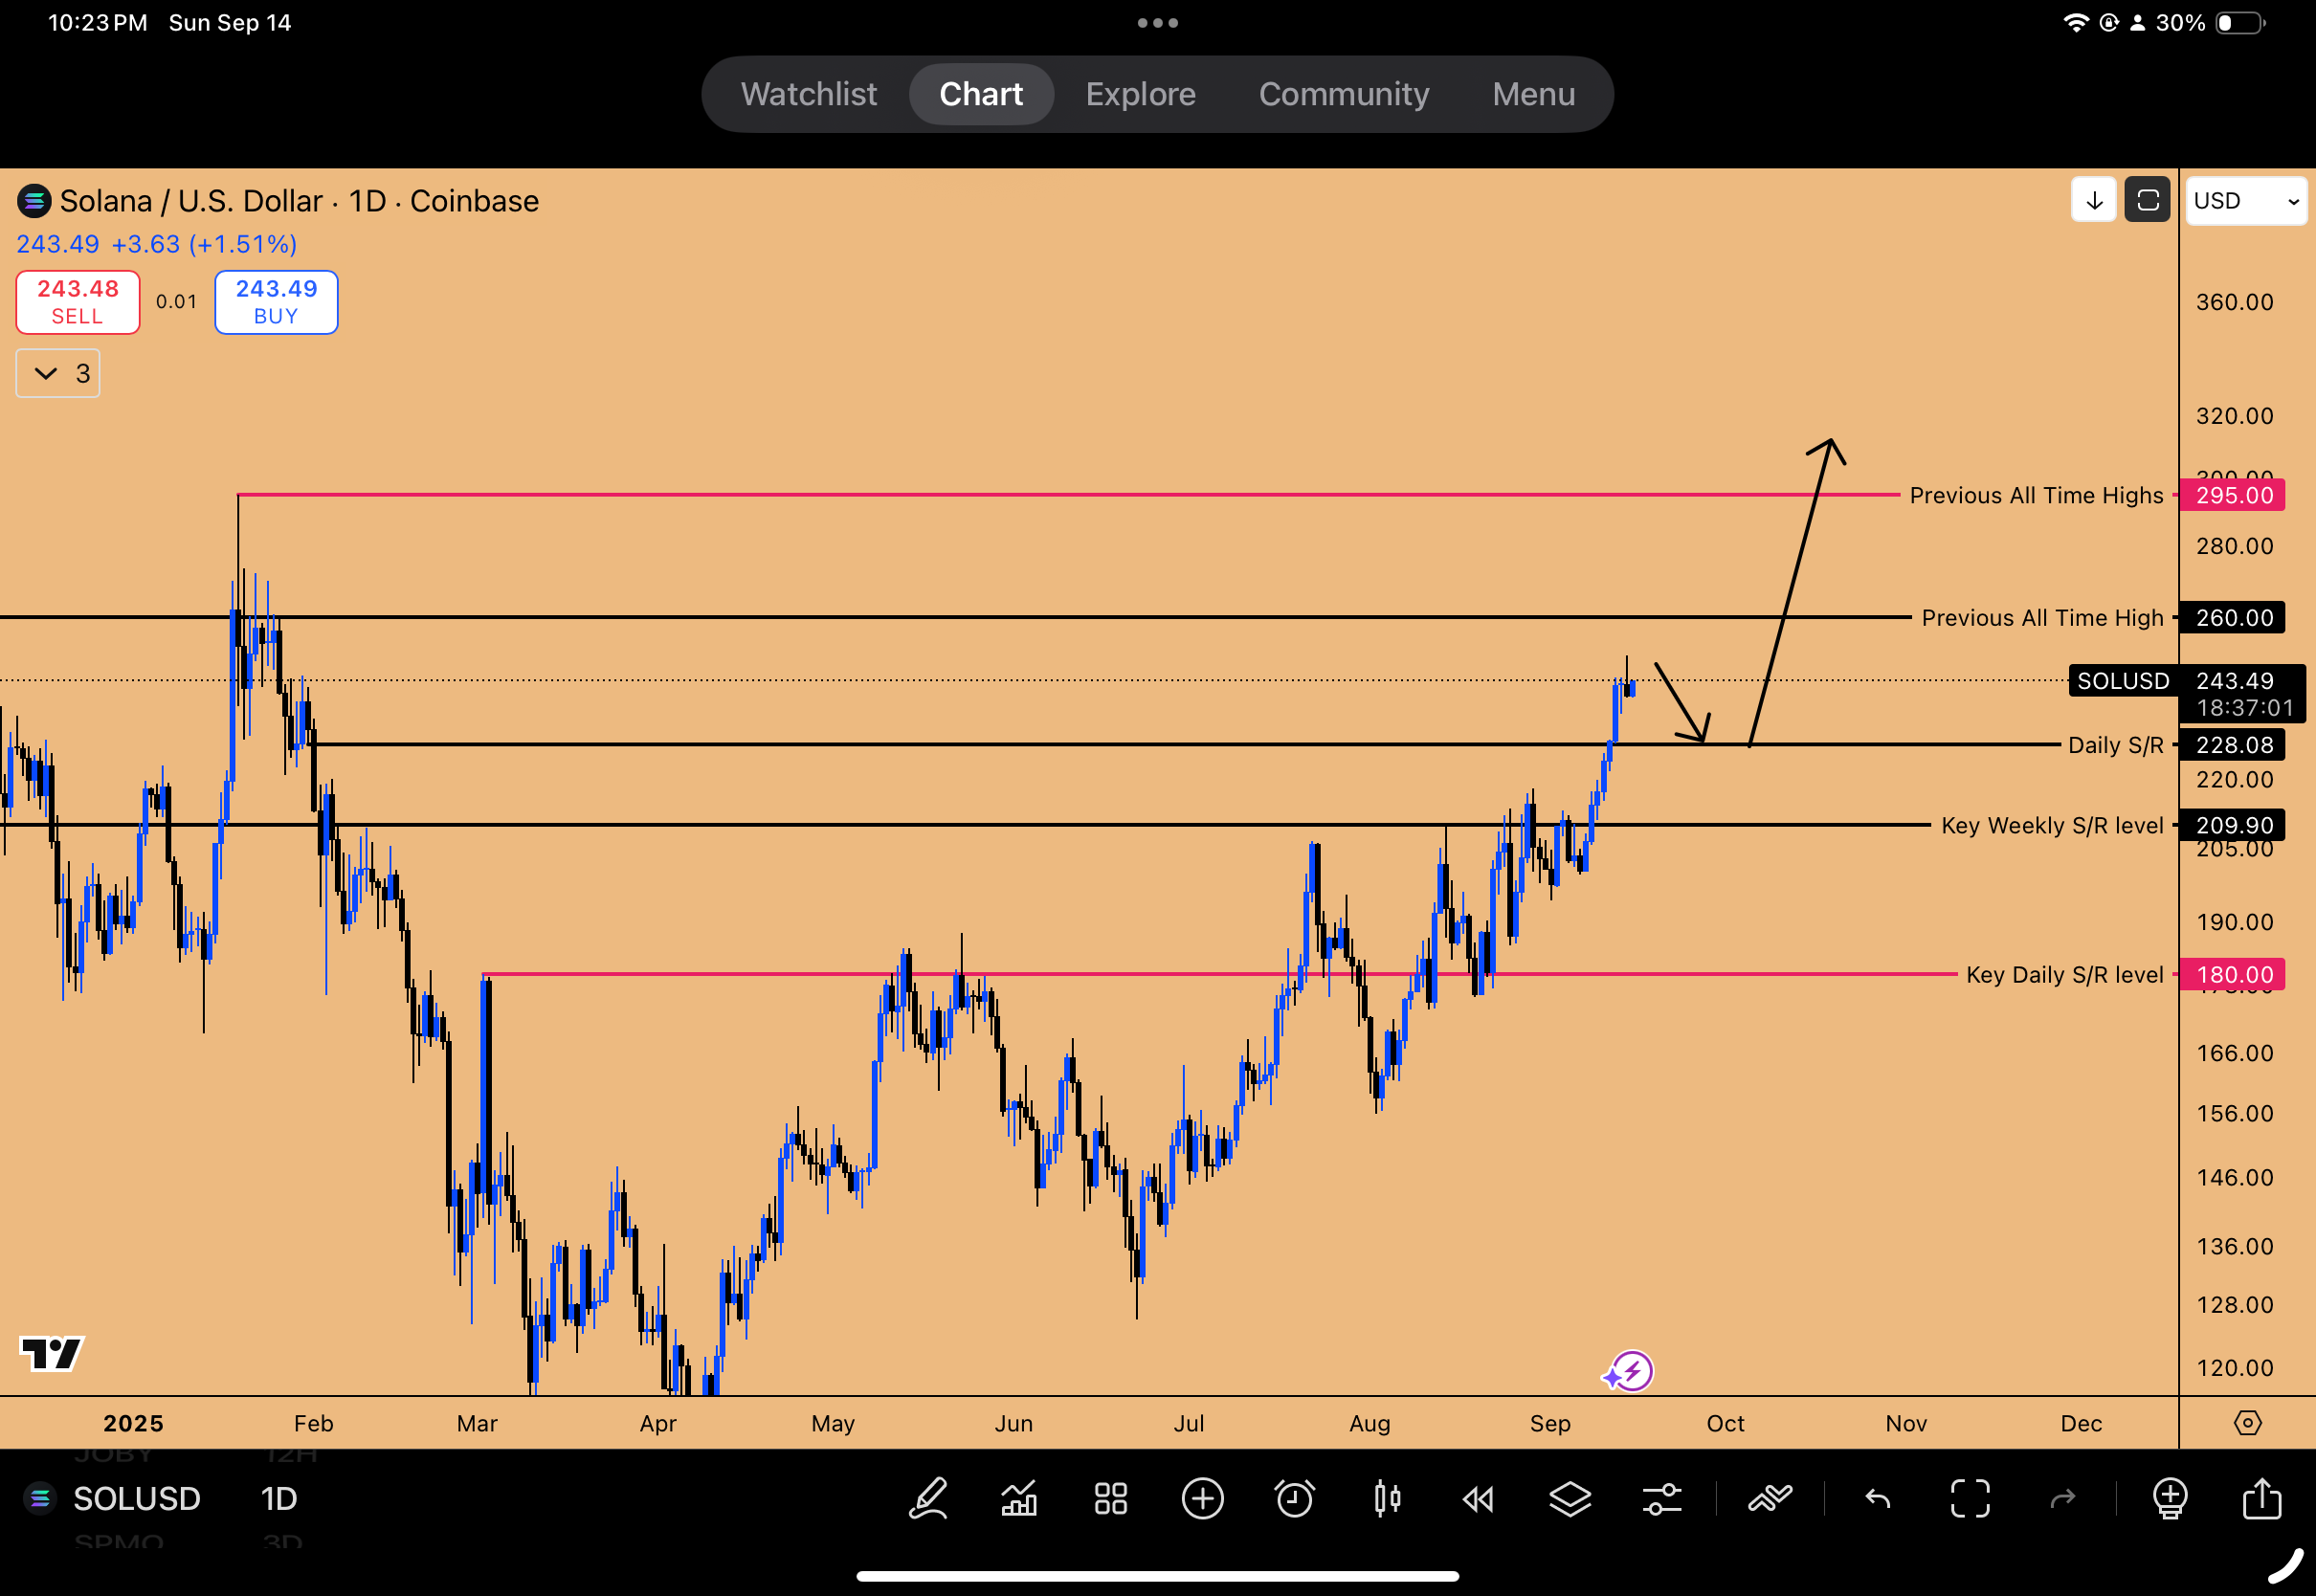
Figure 3: SOLUSD expansion underway
Stellar Lumens (XLM) and XRP: The Coordinated Breakout
XRP and XLM tend to move together. XLM is currently providing a strong bullish trigger with an inside three-week candle failure pattern confirming imminently (at the $0.36-$0.38 range).
While the pattern itself gives a target of $0.52, the expectation is for a much larger move. XLM is poised to break out of a long-term consolidation triangle, targeting a minimum of $1, and potentially even $2. A spot position entered six months ago at $0.23 is still being held. The trend line has been tapped multiple times; the fourth tap is expected to be the breakout.
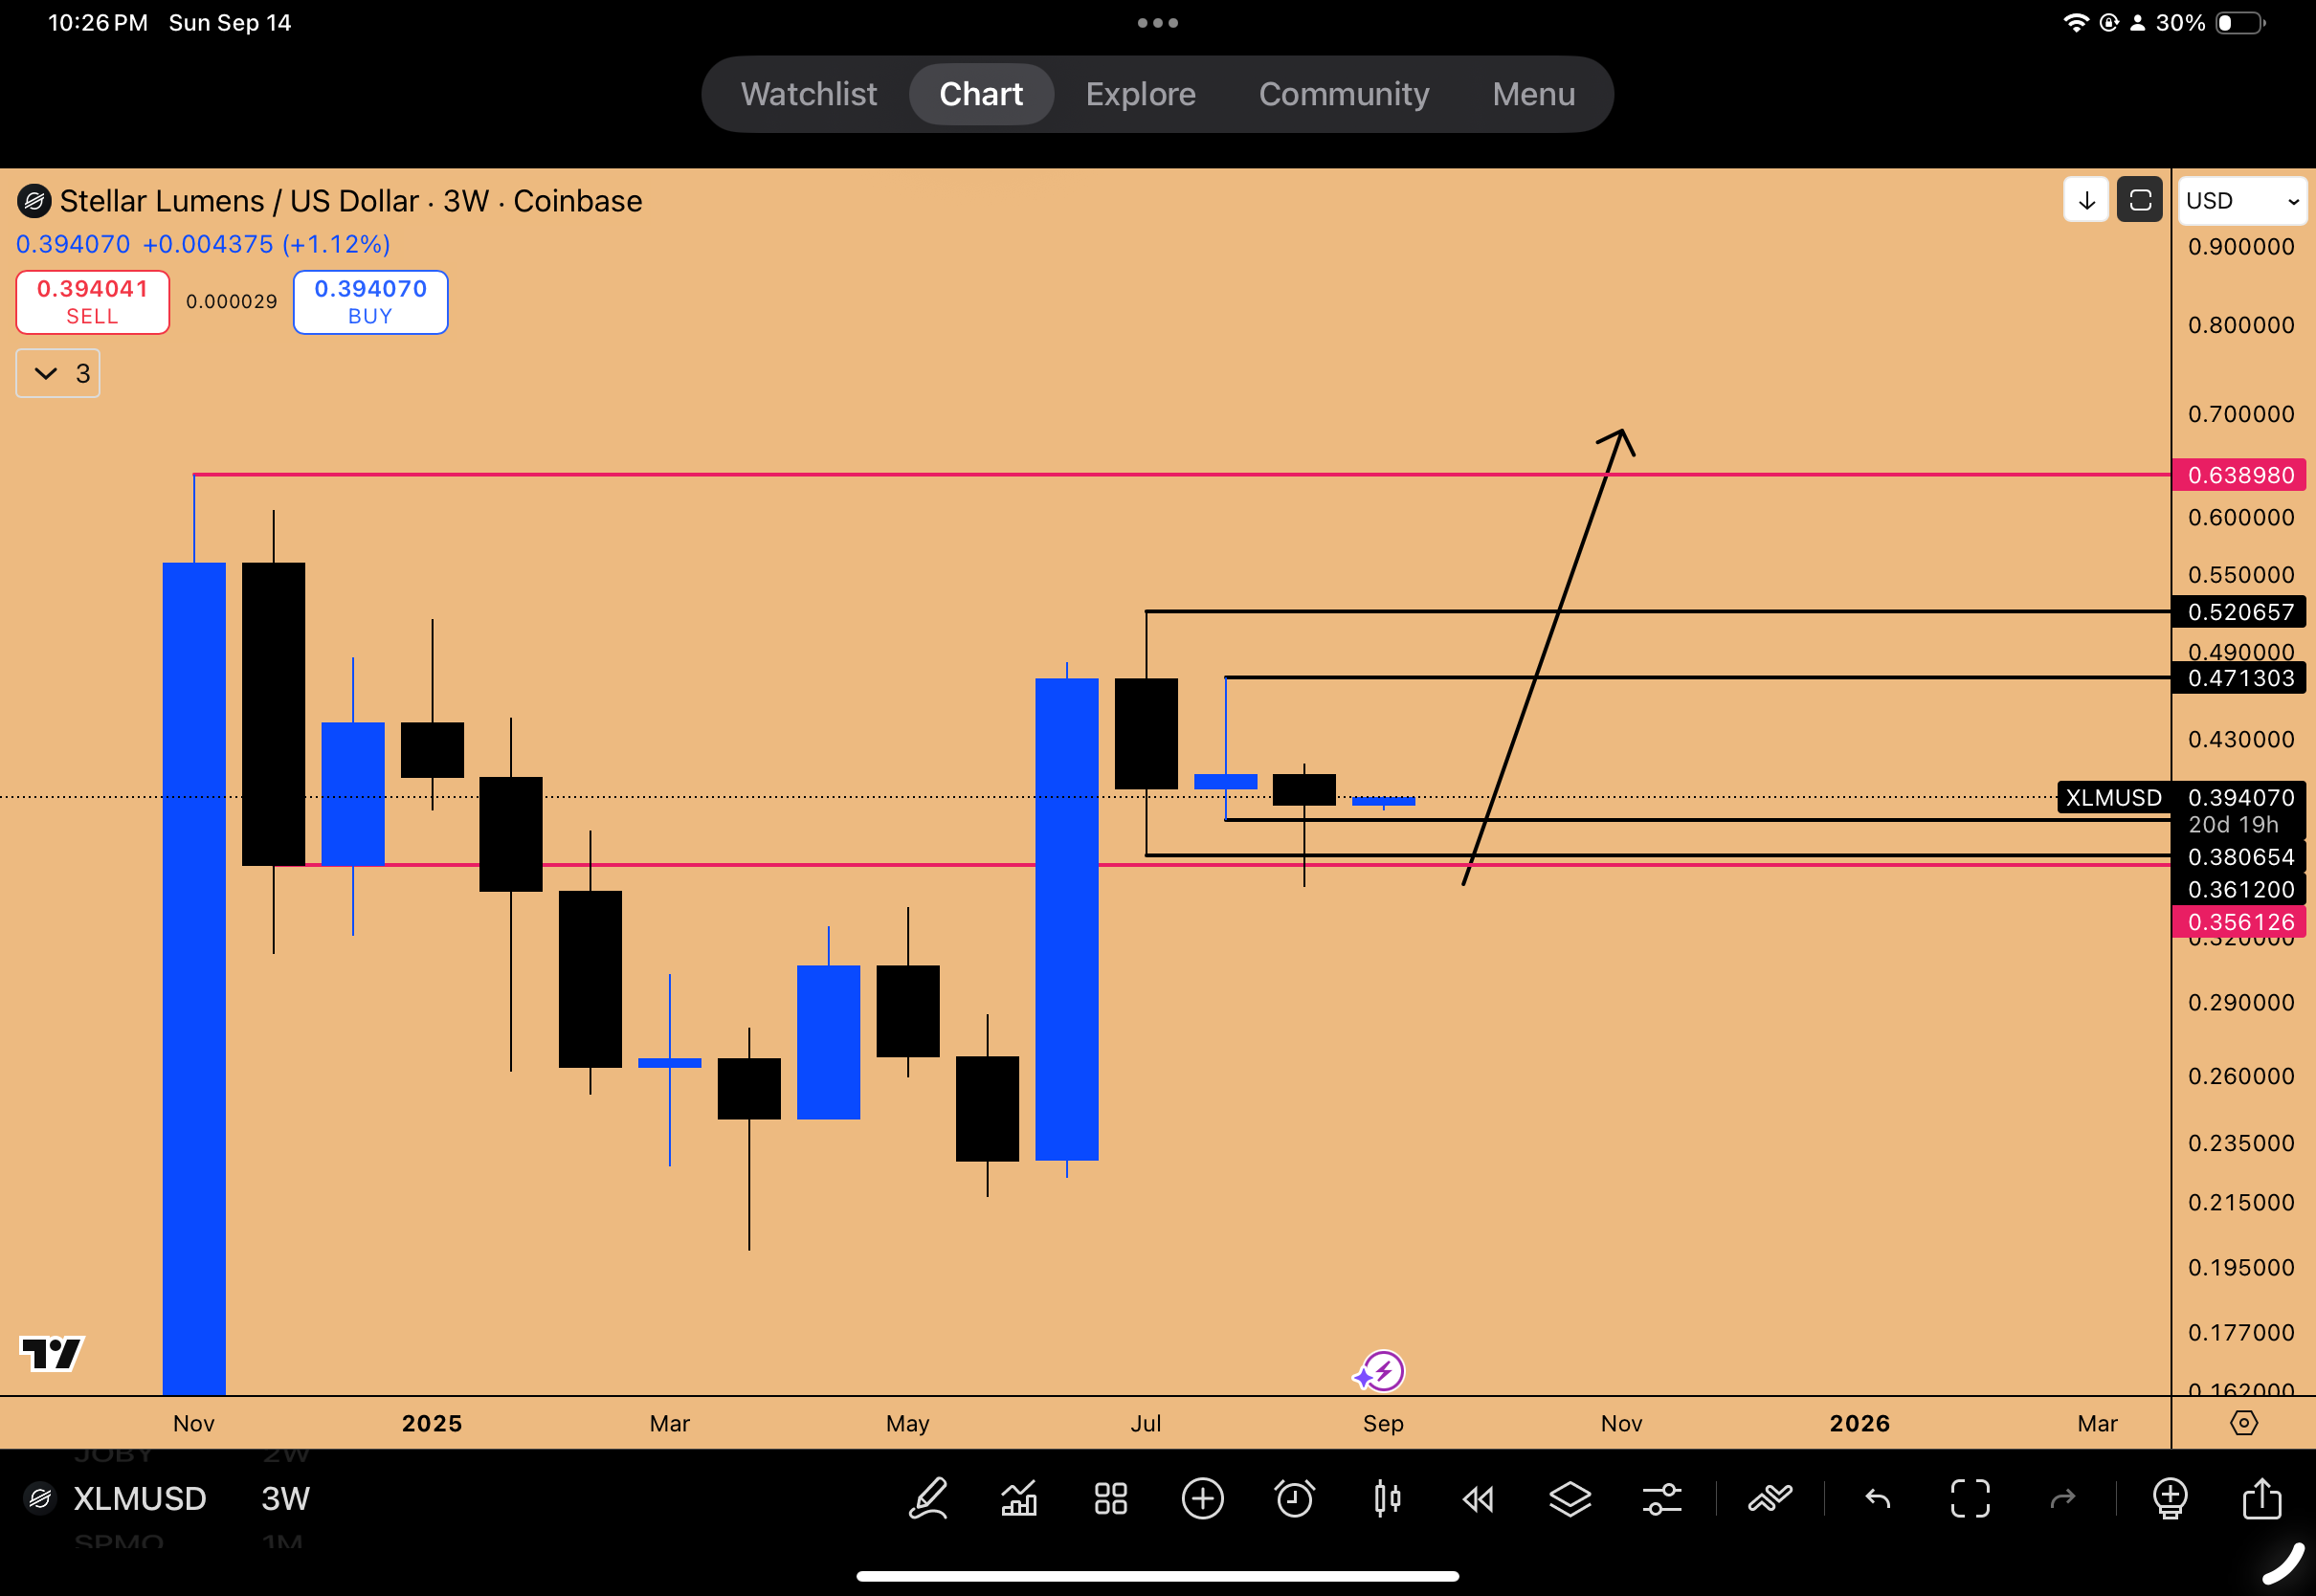
Figure 4: Inside 3-week candle failure triggered long setup
XRP Trade Setup:
XRP also presents an inside three-week candle failure, mirroring the recent Oracle setup.
Entry: $3.04
Stop Loss: $2.69
Target: $3.66 (New ATHs)
XLM vs. XRP: Risk-Reward Comparison
While both assets move hand-in-hand, XLM consistently provides a better "bang for the buck" in terms of percentage returns.
Historical Move ExampleXRP ReturnXLM ReturnBounce from March 31st Bottom64%67%Subsequent Major Push92%140%
More importantly, the position size is determined by the stop loss, making the Risk-to-Reward (R:R) ratio the critical metric.
XRP R:R: 1.83R
XLM R:R: 2.82R
Based purely on the superior risk-reward ratio, XLM is the recommended trade over XRP.
SUI: Quarterly Invalidation and Expansion Trigger
SUI exhibits the same pattern as XLM: an inside three-week candle failure (resolving the range between $3.26 and $4.1825). It is also an inside monthly candle failure.
A key concept in crypto trading involves using quarterly lows as invalidation. When an inside quarterly candle failure occurs and the next quarterly candle jumps up, that candle's low becomes the invalidation for the uptrend. Although the previous quarter's low at $1.961 was taken out, the market quickly reclaimed the previous quarter's high, shifting the structure back to bullish.
New Invalidation Level: $2.6476
The inside three-week failure provides the long trigger, indicating the market is ready to expand into the next quarter (starting October).
SUI Trade Setup:
Entry: $3.7110
Stop Loss: $3.09
Target (Pattern): $4.54
Target (Q4 Expansion): New All-Time Highs
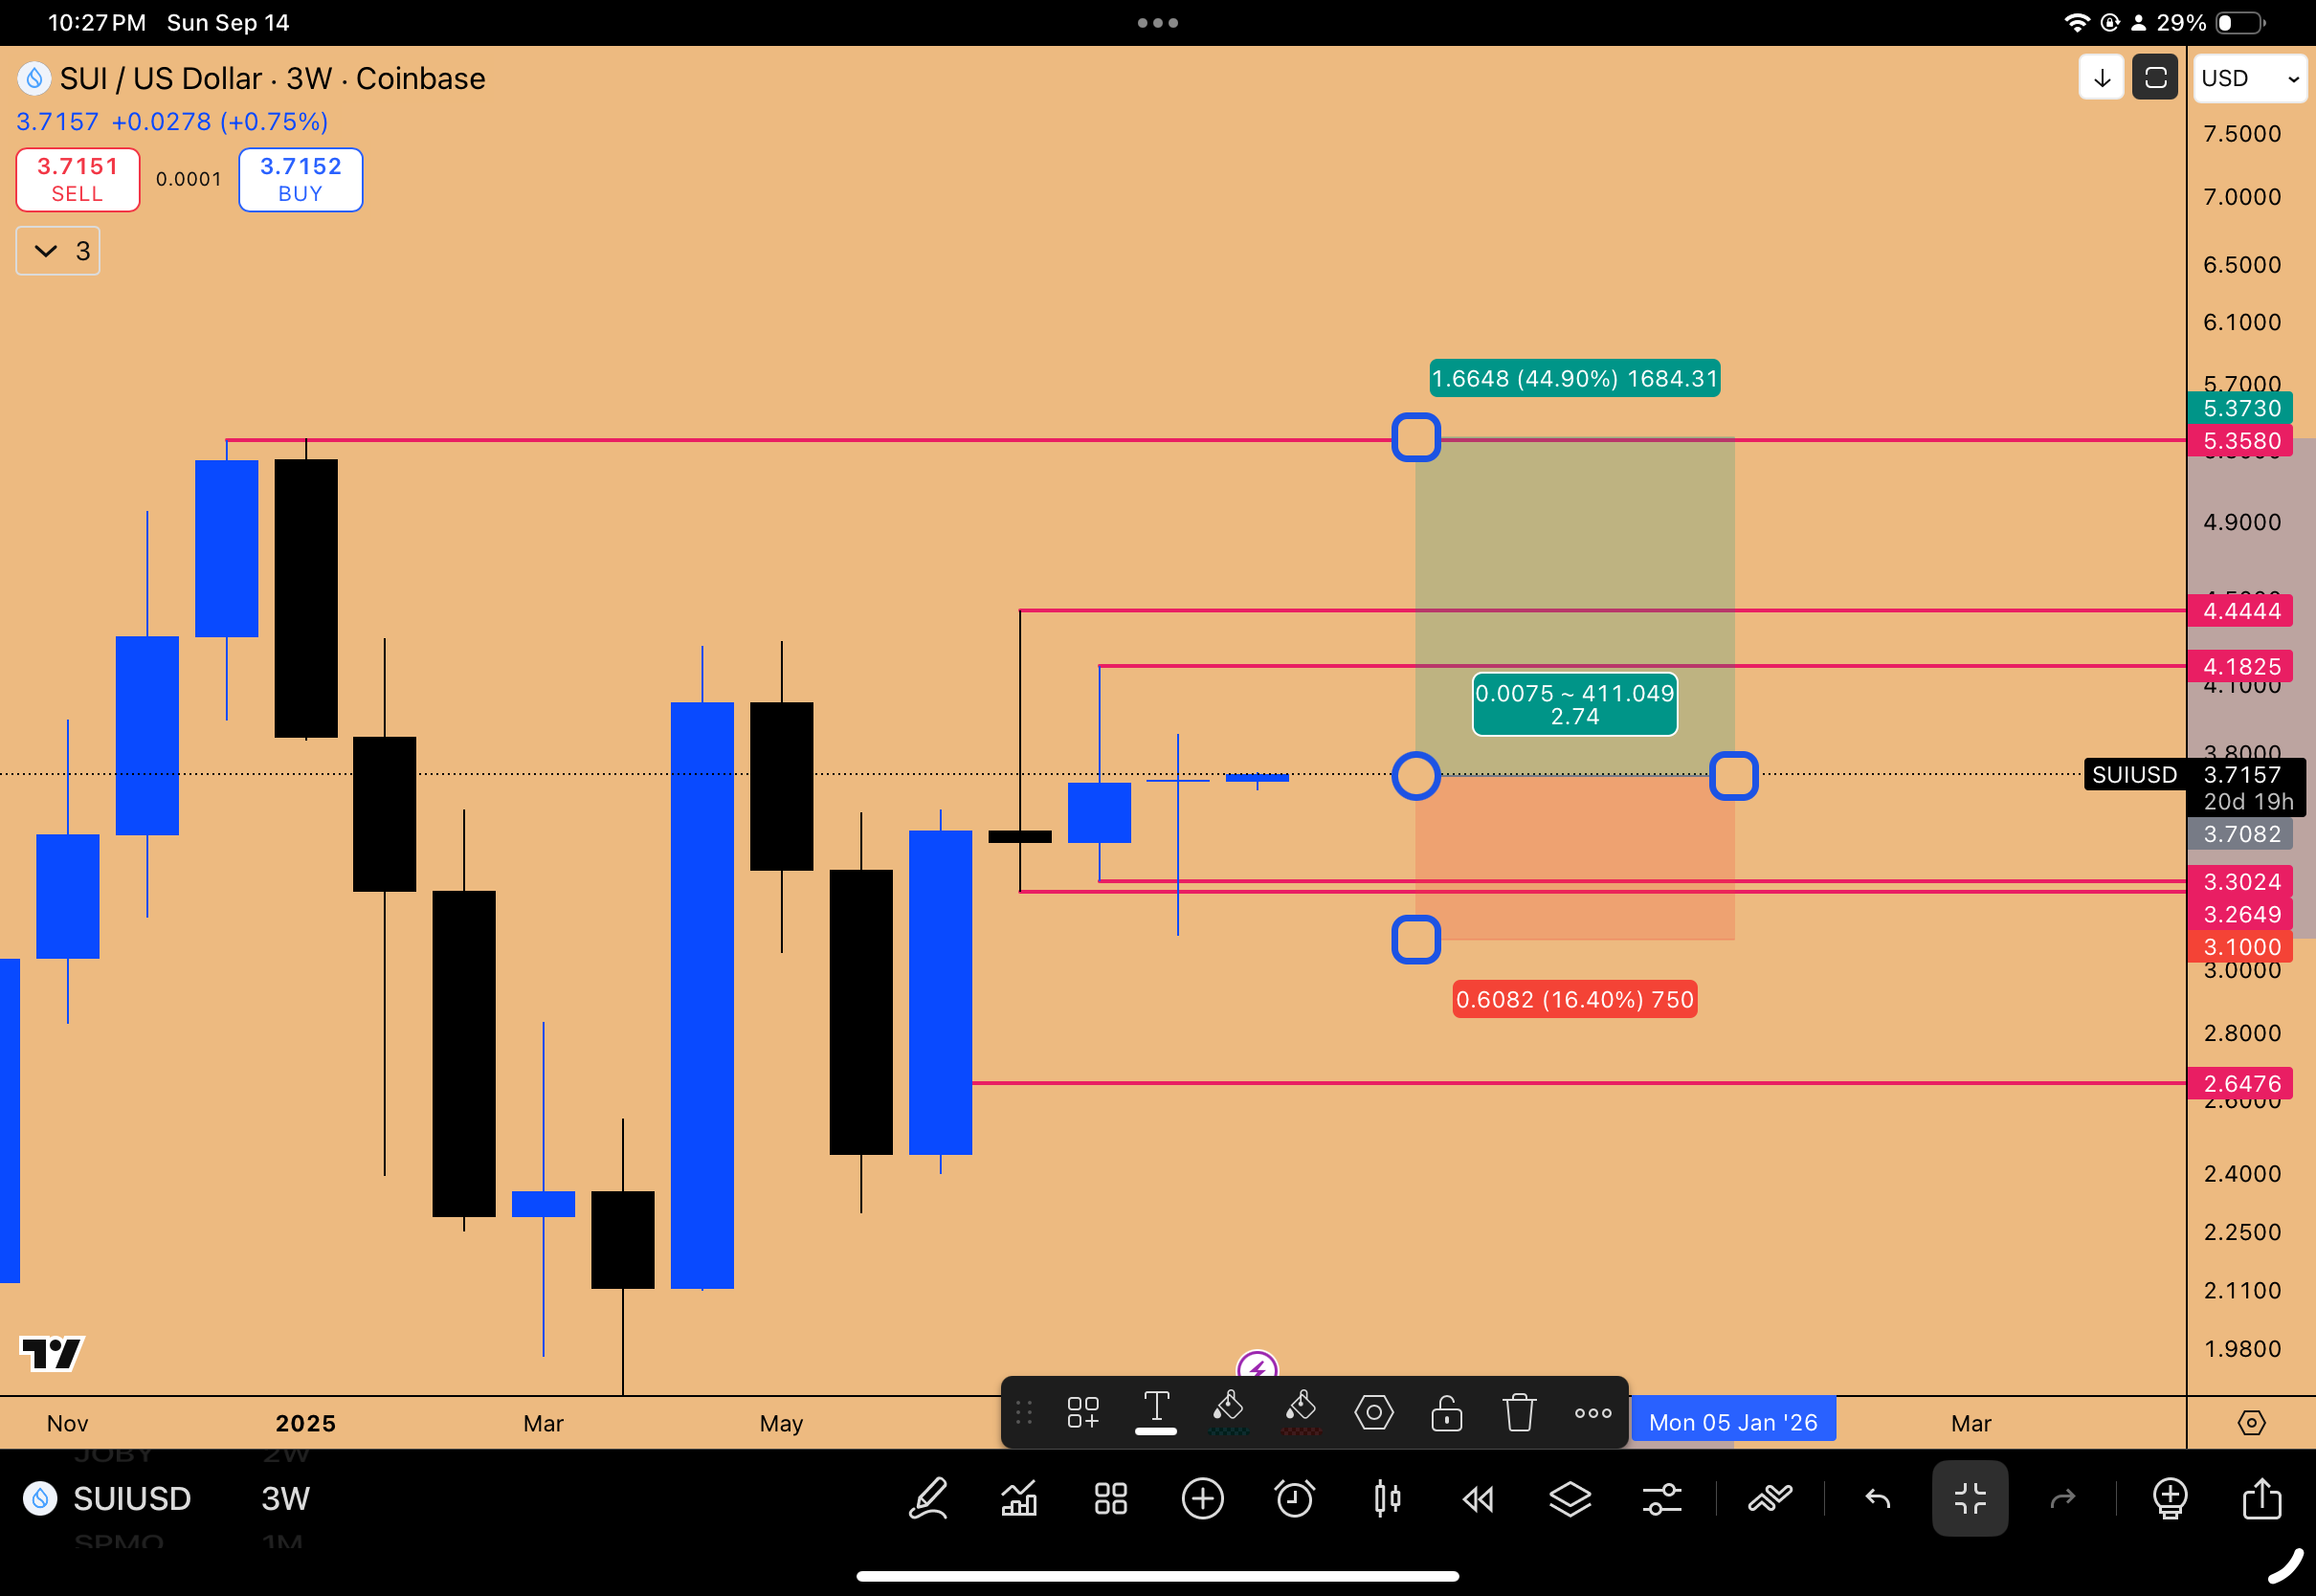
Figure 5: SUIUSD Long setup in play
🇺🇸🇯🇵🇩🇪 Indices Analysis: NASDAQ Meltup, Nikkei Correlation, and the DAX Setup
The flow of liquidity into risk-on assets has created a clear meltup phase in major indices, characterized by relentless upward price action. The underlying trend remains bullish as long as the market never breaks the three-week close—a key risk management principle for riding the trend without being prematurely shaken out.
The Nikkei-NASDAQ Connection
A significant correlation driving NASDAQ's performance is its dependence on the Nikkei index (Japan Index). The quarterly outlook report issued on June 31st highlighted a critical pattern in the Nikkei: an inside three-month candle failure.
Based on this pattern, it was anticipated that the current quarterly candle would expand aggressively to the upside. This is precisely what has occurred. This bullishness in the Nikkei provides massive tailwinds for the NASDAQ, explaining why the NASDAQ has not experienced a significant pullback and continues to print new highs. The strong close of the current Nikkei quarterly candle provides extreme confidence that the next quarter (Q4) will also be expansive, pulling NASDAQ higher.
NASDAQ Outlook and Invalidation Levels
While the trend is strong, traders must be careful over the next two weeks approaching the quarter end. Given the significant expansion this quarter, profit-taking is possible. Historical quarterly candles often form wicks in the closing weeks, signaling distribution.
We may undergo sideways to down price action, or a push higher into the FOMC meeting followed by a pullback. However, this short-term volatility should not disrupt long-term positioning for Q4.
Technical Levels for NASDAQ:
Weekly Invalidation: The previous week's low at 23,615. This proper thrust candle formed a new bullish order block/support zone. A break below this suggests an issue.
Bull Run Invalidation (Three-Week Low): 22,981. This level must be breached for a market structure break. The market is currently nowhere near this level.
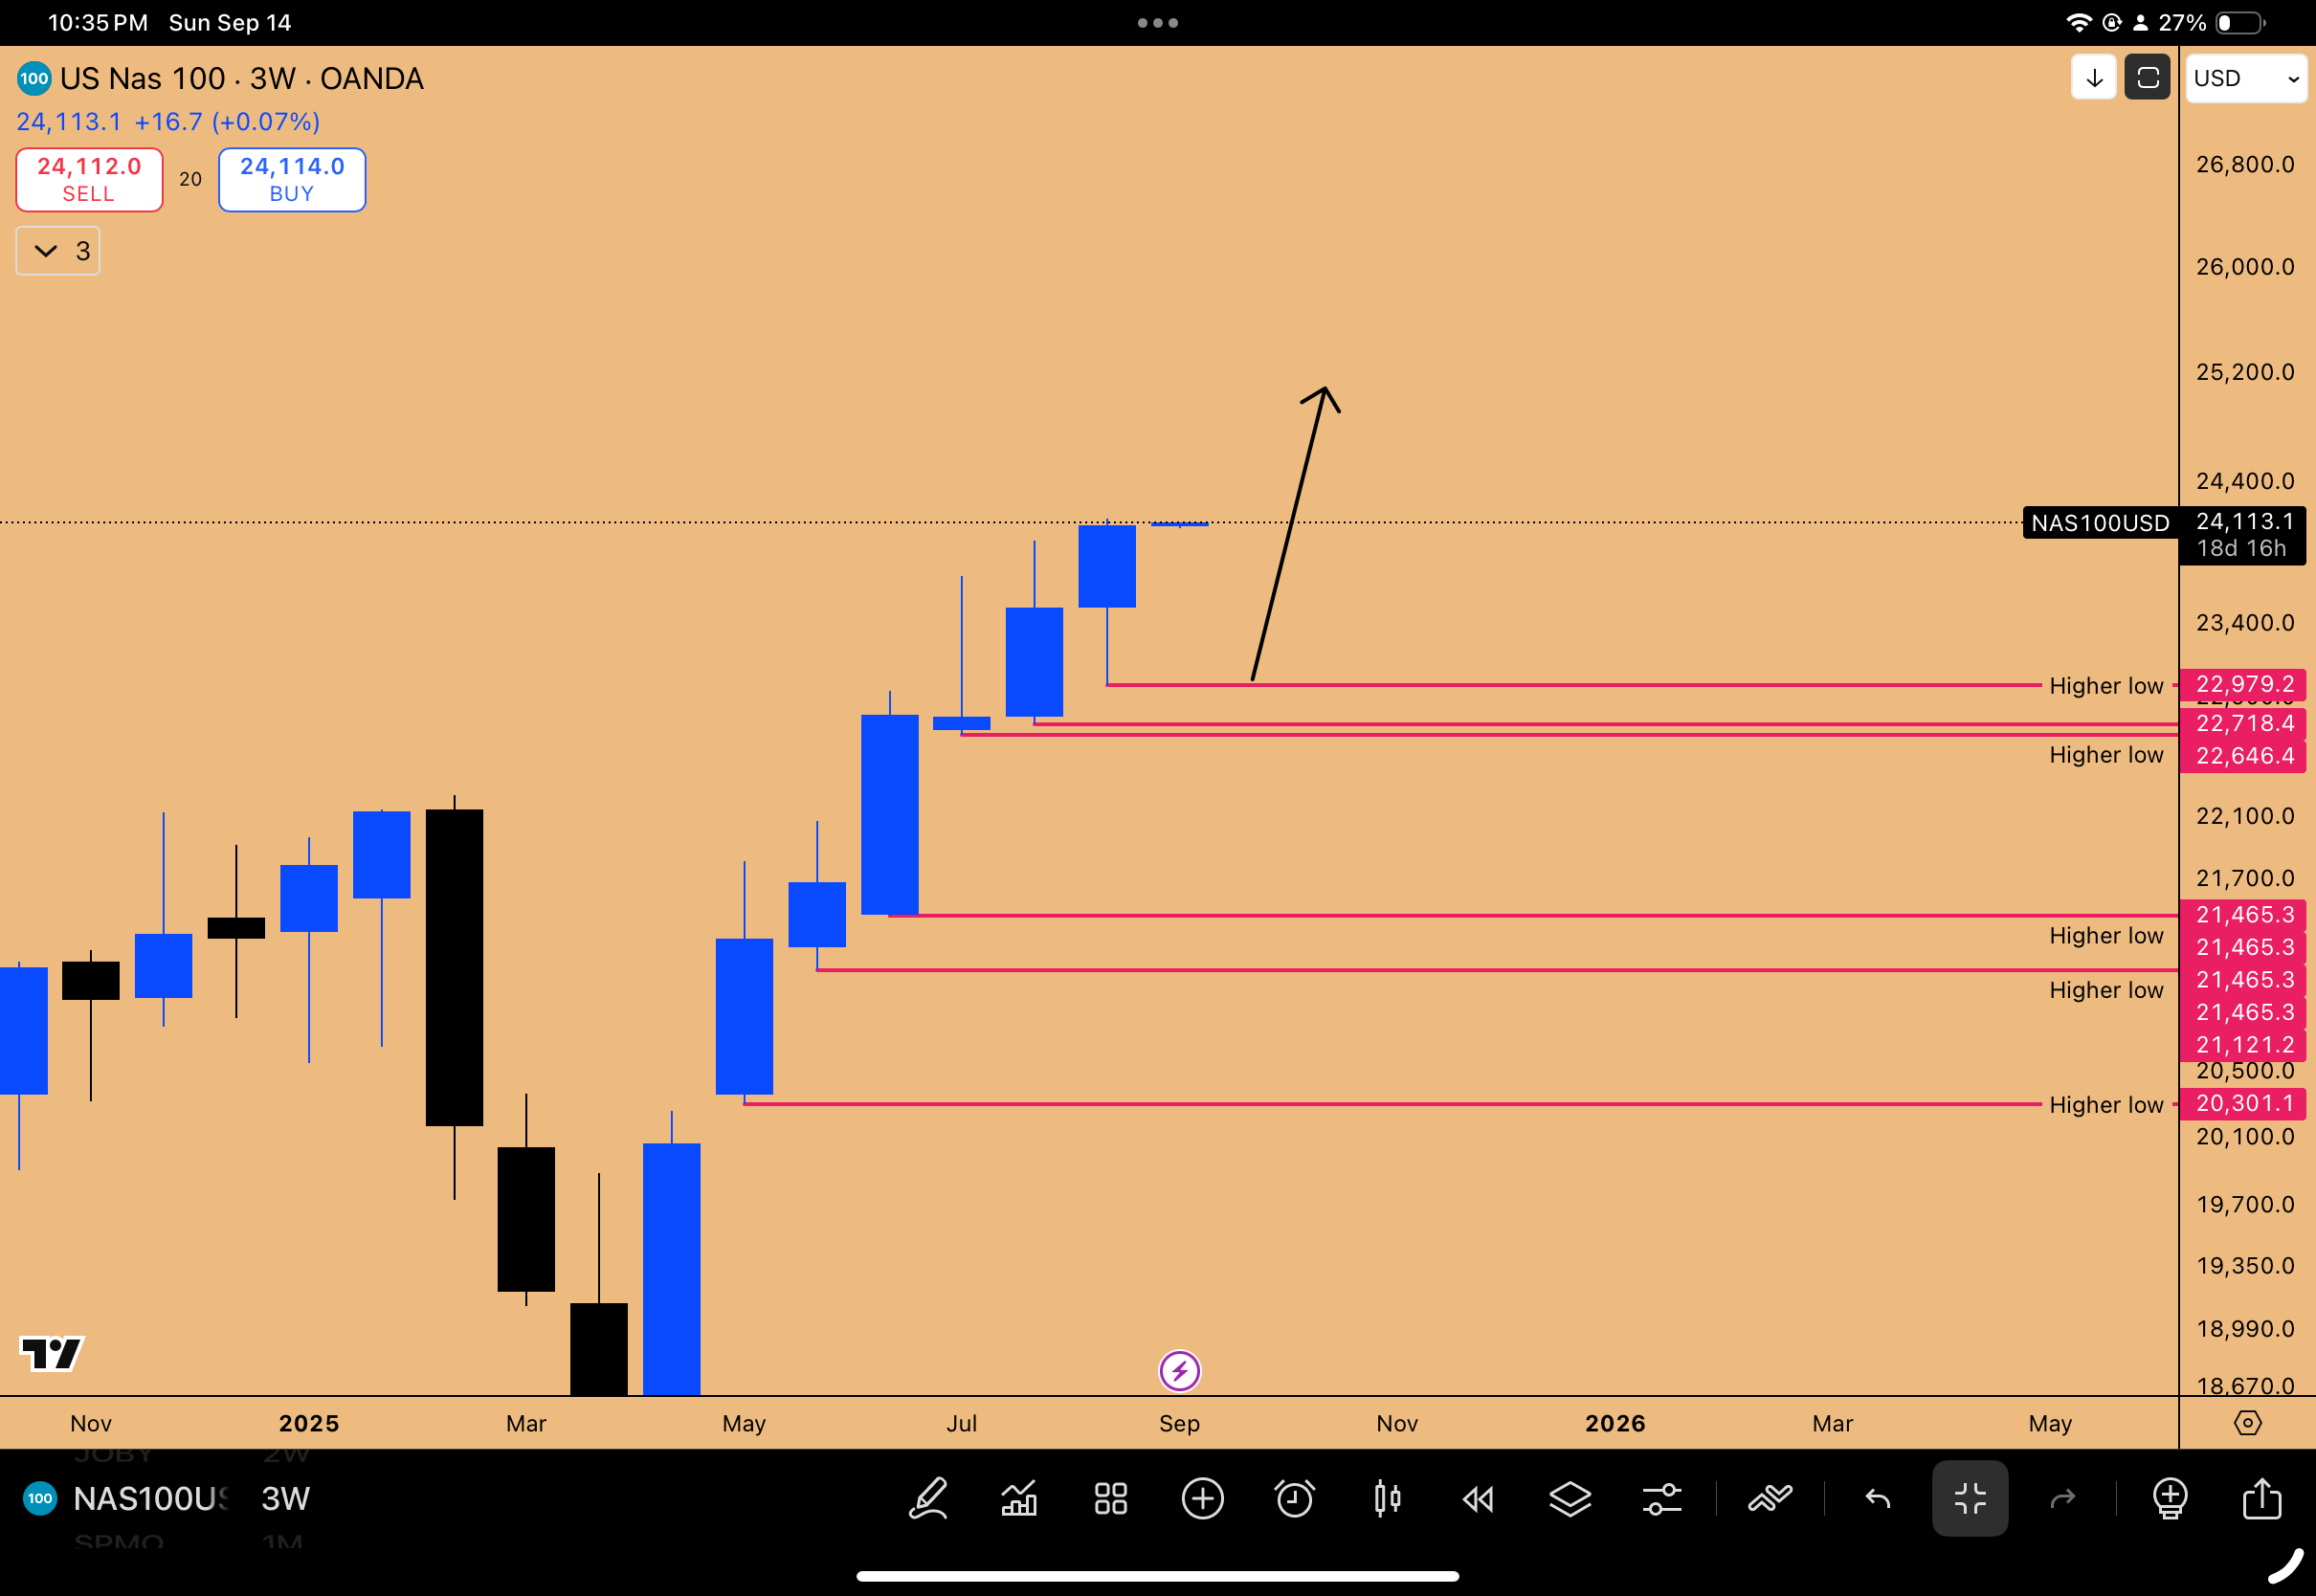
Figure 6: Strong uptrend intact in NAS100
DAX (German 40): The "Setup of the Year"
The DAX presents the “Setup of the Year,” characterized by extreme consolidation that often goes unnoticed. The three-week chart reveals a triple inside three-week candle. This level of consolidation is even more pronounced than the recent setup in Gold. Consolidation leads to expansion, making the risk-reward ratio extremely lucrative.
"Cannon Fodder" and Stop Placement
Understanding market structure and liquidity runs is critical. Certain lows are considered "cannon fodder"—levels likely to be taken out for a stop run without indicating a bearish market structure shift.
Cannon Fodder Lows: 23,476, 23,430, and 23,377. Stops should NOT be placed below these levels, as they were not responsible for making a new all-time high.
Hard Stop Loss: 23,190. This low is critical because it was responsible for punching the market higher and making a new all-time high (taking out 24,490). It is not okay for the market to take out this low.
The 8R Swing Trade Setup
If the next three-week candle runs the downside liquidity (the cannon fodder lows), it presents a long opportunity.
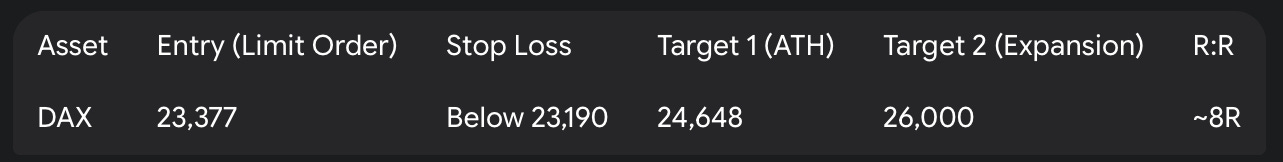
This high R:R is rare for swing trades (typically 2R-3R max) and is only possible due to the extensive consolidation. The 26,000 target is based on expansion towards a nice round number, similar to how a previous DAX rally gravitated towards 20,000 after a similar failure pattern.
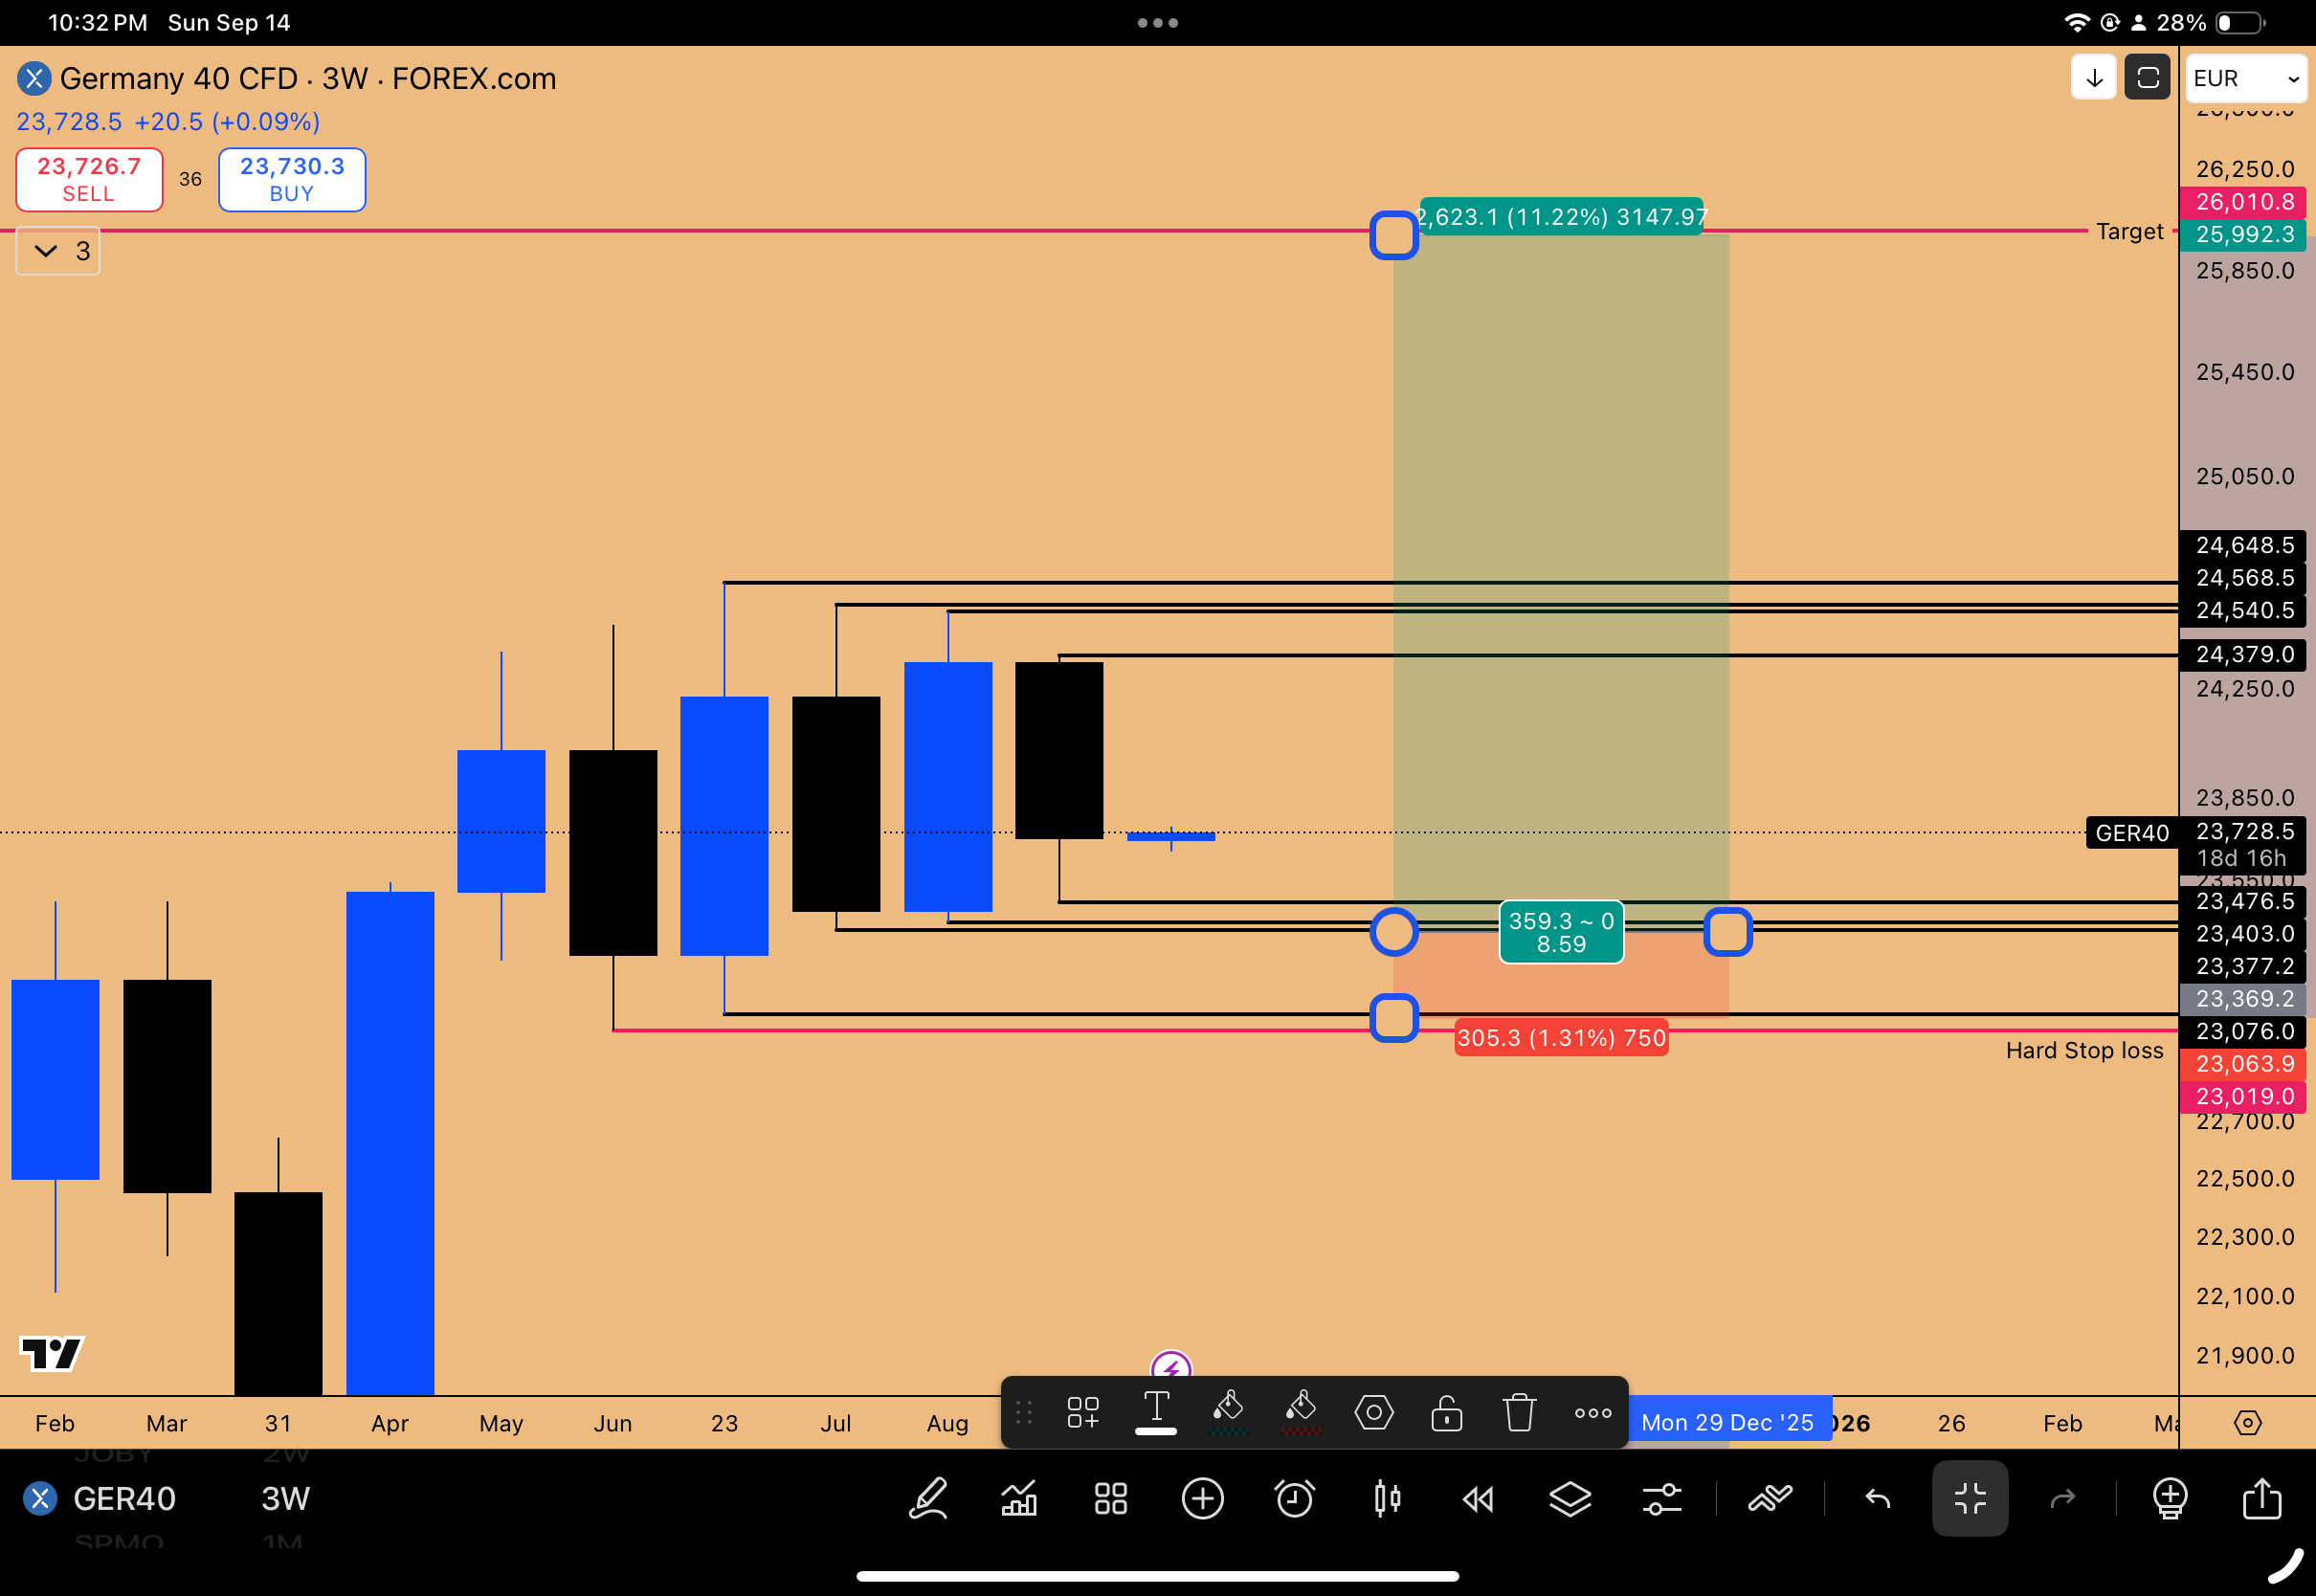
Figure 7: Triple Inside 3-week candle consolidation, ripe for a breakout
The AI Revolution and US Equity Dominance
The US equity market is the primary destination for capital flows moving forward, driven by monetary stimulation and the powerful narrative of the AI revolution. The Q4 setup across the board for US equities looks extremely bullish. We are entering an era reminiscent of the pre-tech bubble boom, with AI companies potentially rising 50% to 100% in the next 1-2 years.
Microsoft (MSFT): The Alpha Play for Q4
Microsoft is identified as the "alpha" play. It is currently lagging the NASDAQ significantly. The bet is on Microsoft catching up.
Key Patterns and Triggers:
Inside Monthly Candle Failure: The overarching bullish pattern.
Inside Three-Week Candle Failure: The immediate trigger for long entry.
The entry on Microsoft utilizes an exception to the three-week risk management rule: it is okay to allow a three-week candle low to be taken out if and only if it is an inside three-week candle. This provided a long trigger rather than a stop-out signal.
Based on cross-market correlation with the NASDAQ, Microsoft should technically be trading at $555.
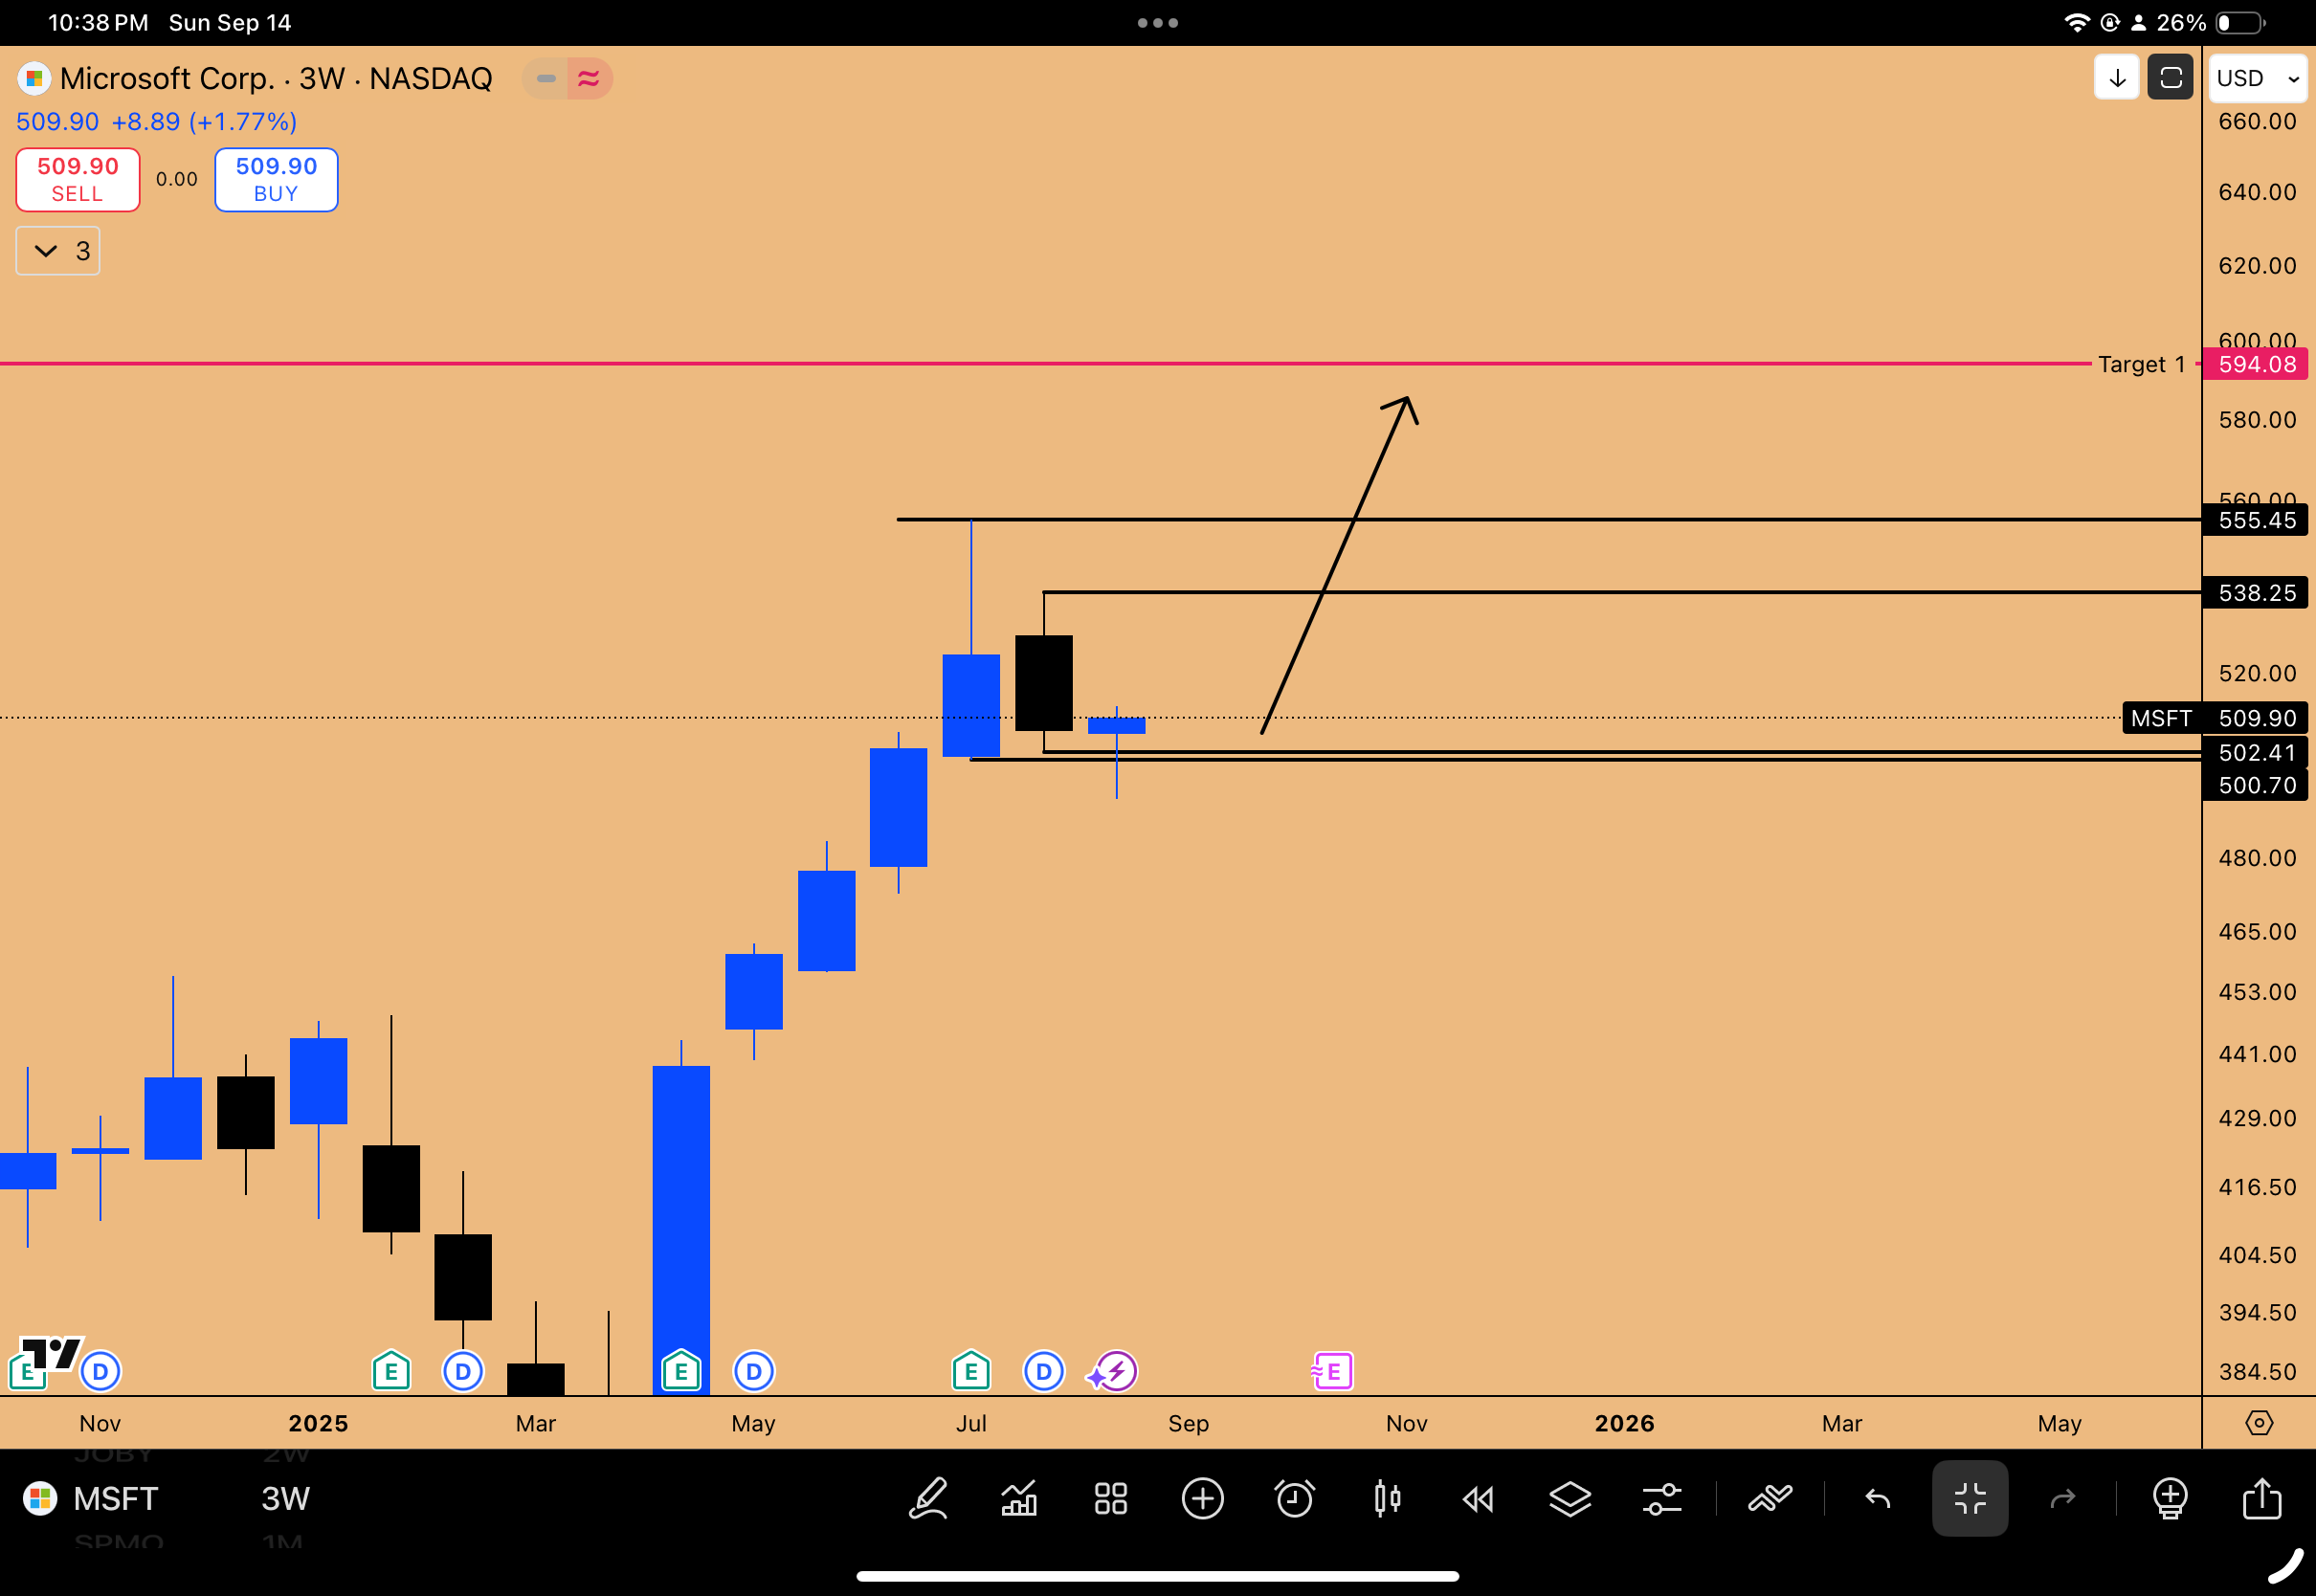
Figure 7: Inside 3-week candle failure trigger for swing longs
Seasonality and Earnings Catalyst
Positioning in Microsoft is based on time, anticipating the Q4 expansion and the earnings report on October 28th. Options positions have been taken with February and April 2026 expirations.
Seasonally, Q4 is very strong for Microsoft, particularly after earnings in late October. In 2021, Microsoft jumped approximately 20% on earnings itself into November. A massive push is expected at the year-end.
AI Fundamentals and the Oracle Comparison
The AI revolution is very real, with massive amounts of money being invested, much of which will begin reflecting in the October earnings season. Microsoft is exceptionally well-positioned due to its partnerships with nearly every major AI company, including xAI and Anthropic, as well as US government contracts.
“The amount of contracts which are being given to Microsoft, it far surpasses on whatever Oracle reported.”
Given Oracle's explosive reaction to its earnings (option calls went up 418% in one day), Microsoft's performance is expected to be significant. Microsoft's integration of enterprises into its tech stack (Azure services, Microsoft Fabric) is creating "customers for life," representing a substantial incremental revenue stream for the next one to two years.
Amazon (AMZN): The Lagging AWS Giant
Amazon is another key AI company lagging behind. Amazon Web Services (AWS) competes directly with Microsoft Azure and Google Cloud. Amazon has been sideways for the past three months, working the monthly resistance zone at $237. A trigger, such as earnings (October 23rd), is needed to break this resistance.
Target 1: $264
Target 2: $292
The Google Comparison:
Amazon's chart structure mirrors Google's (GOOGL). Both experienced the same drawdown and bottom. However, while Google has been pushing relentlessly toward its targets ($226 and $249), Amazon has lagged. Amazon is expected to play catch-up, easily reaching the $292 target.
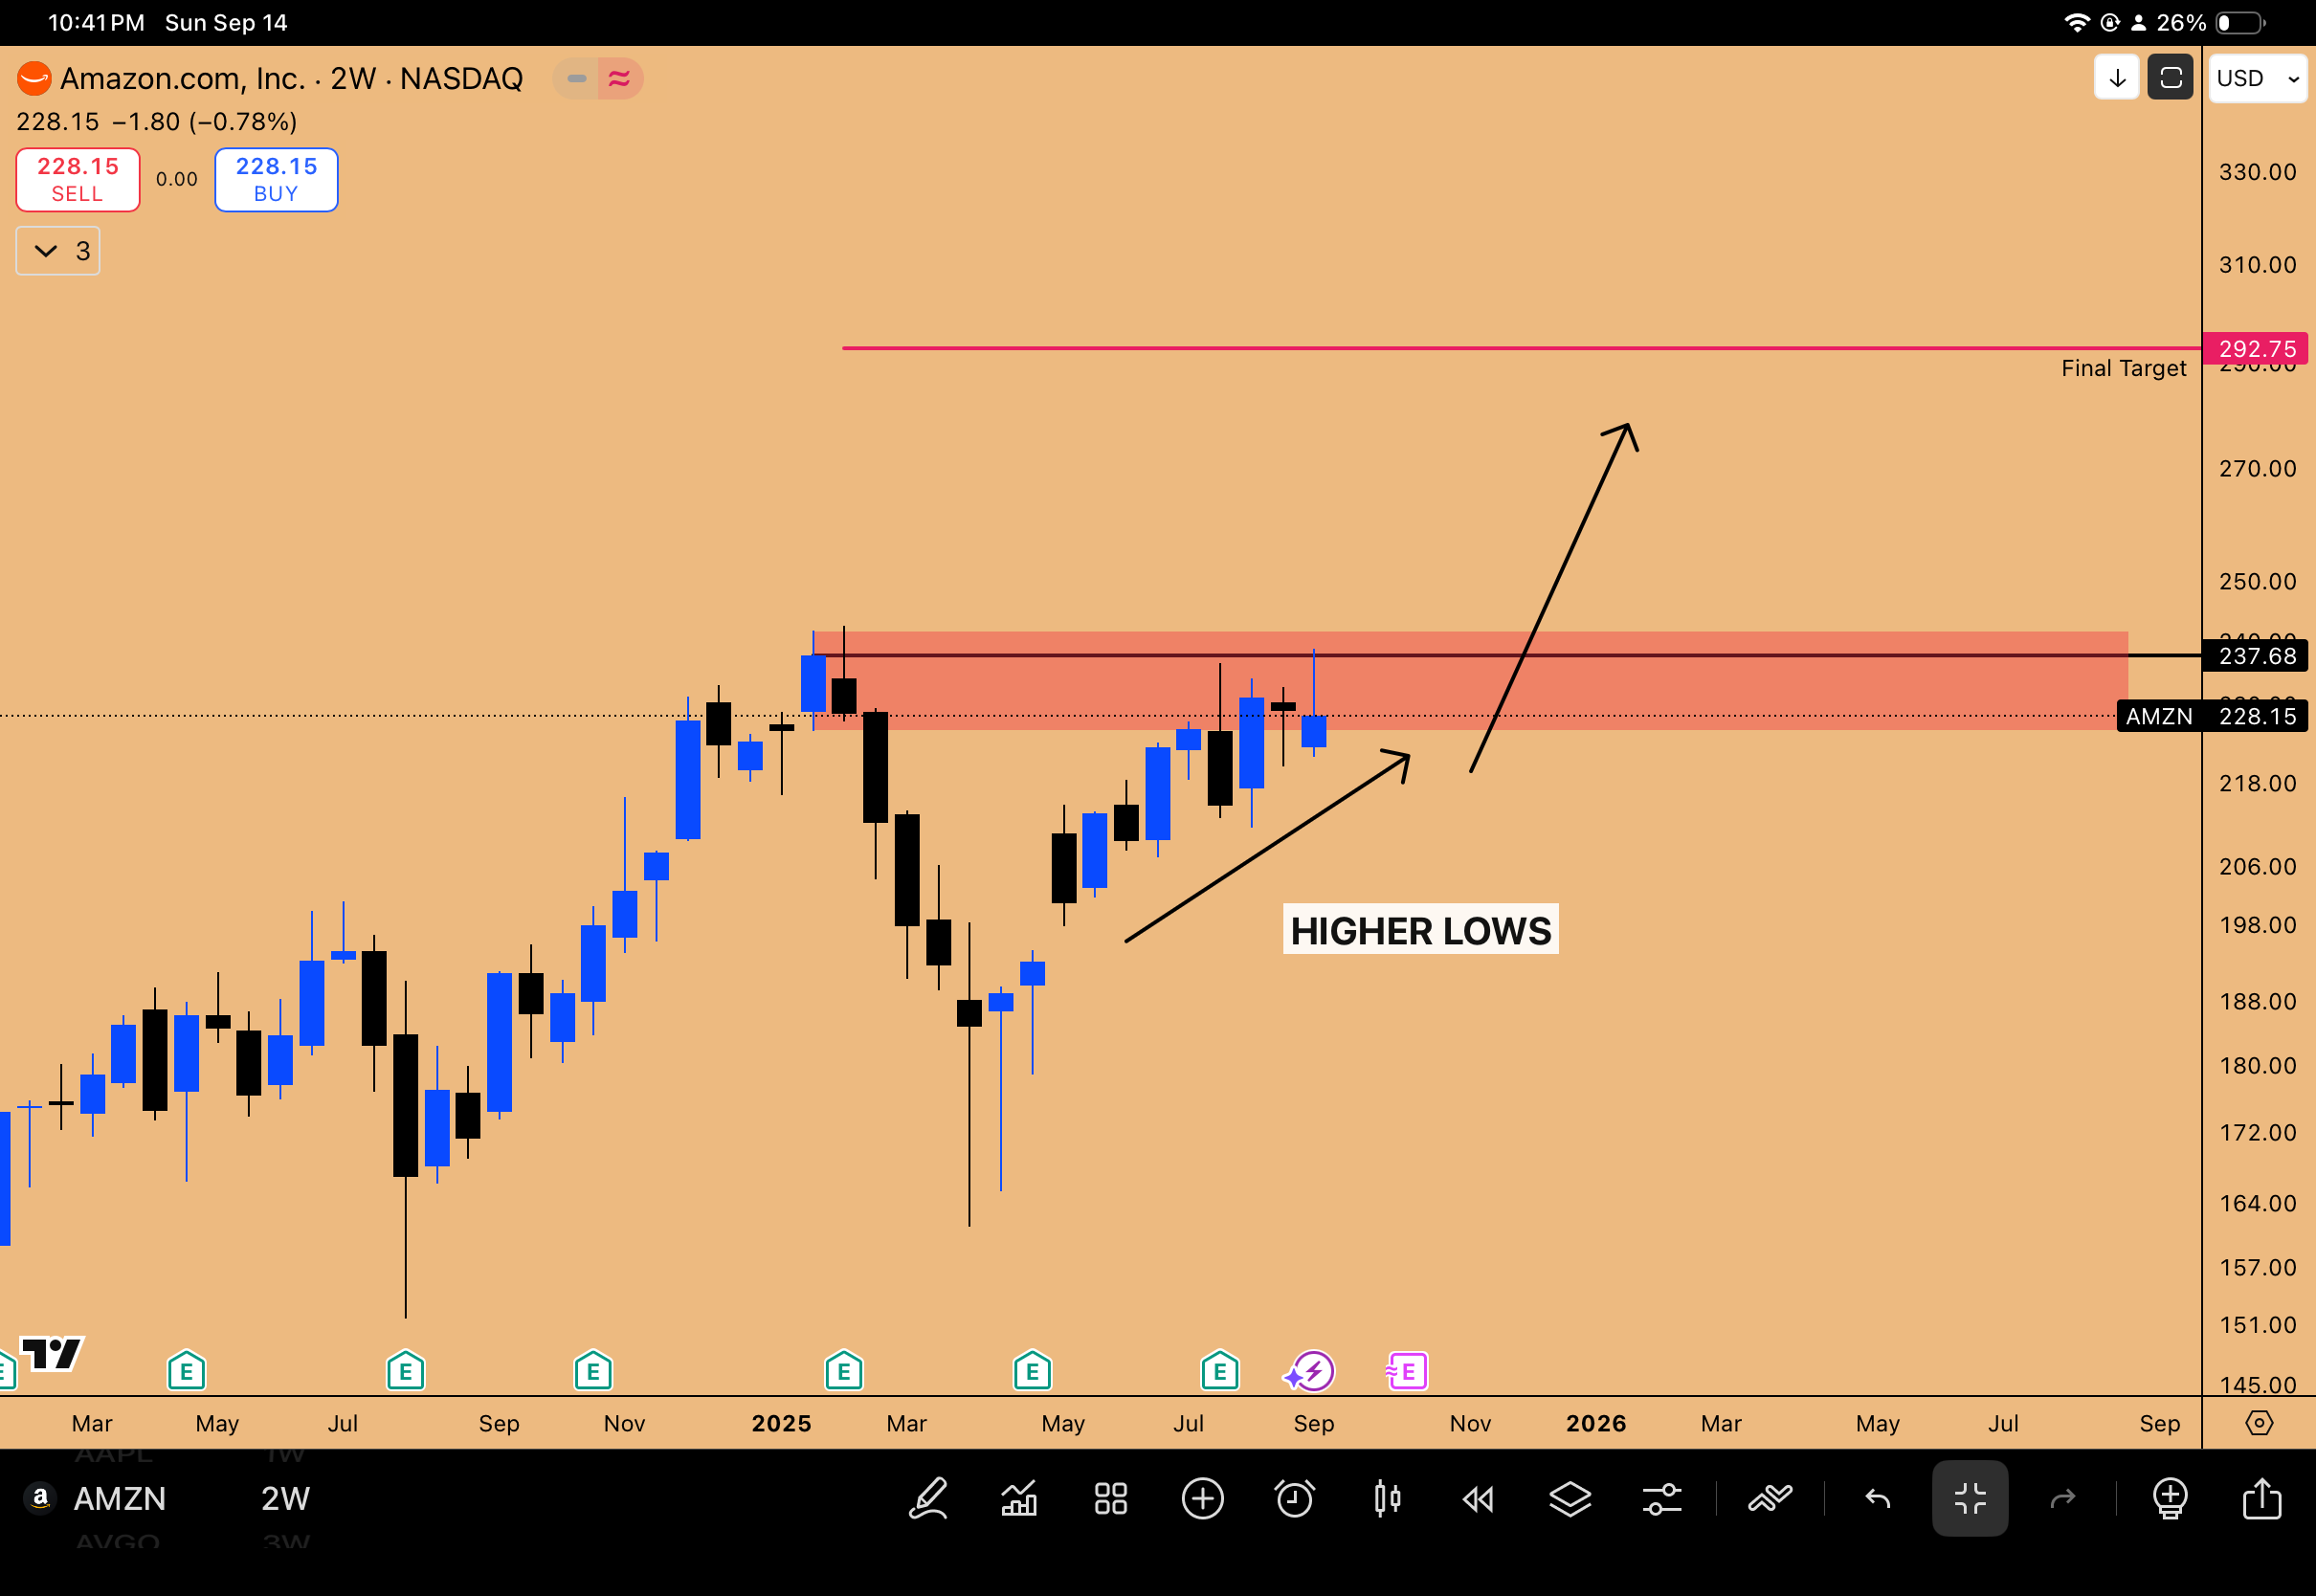
Figure 8: AMZN threatening a breakout from 3 months of consolidation
Netflix (NFLX): AI-Driven Production and Profit Margins
Netflix presents a compelling setup with an inside two-month candle and an impending inside quarterly candle close. As a US company, it is poised to benefit from US economic stimulation.
The Dip Buying Opportunity:
If Netflix experiences a pullback into the area between $1,064 and $1,100, it is a critical buying zone for six-month options calls. Scaling should begin if the downside liquidity at $1,144 is taken out.
Order Levels: $1,100, $1,080, and $1,064.
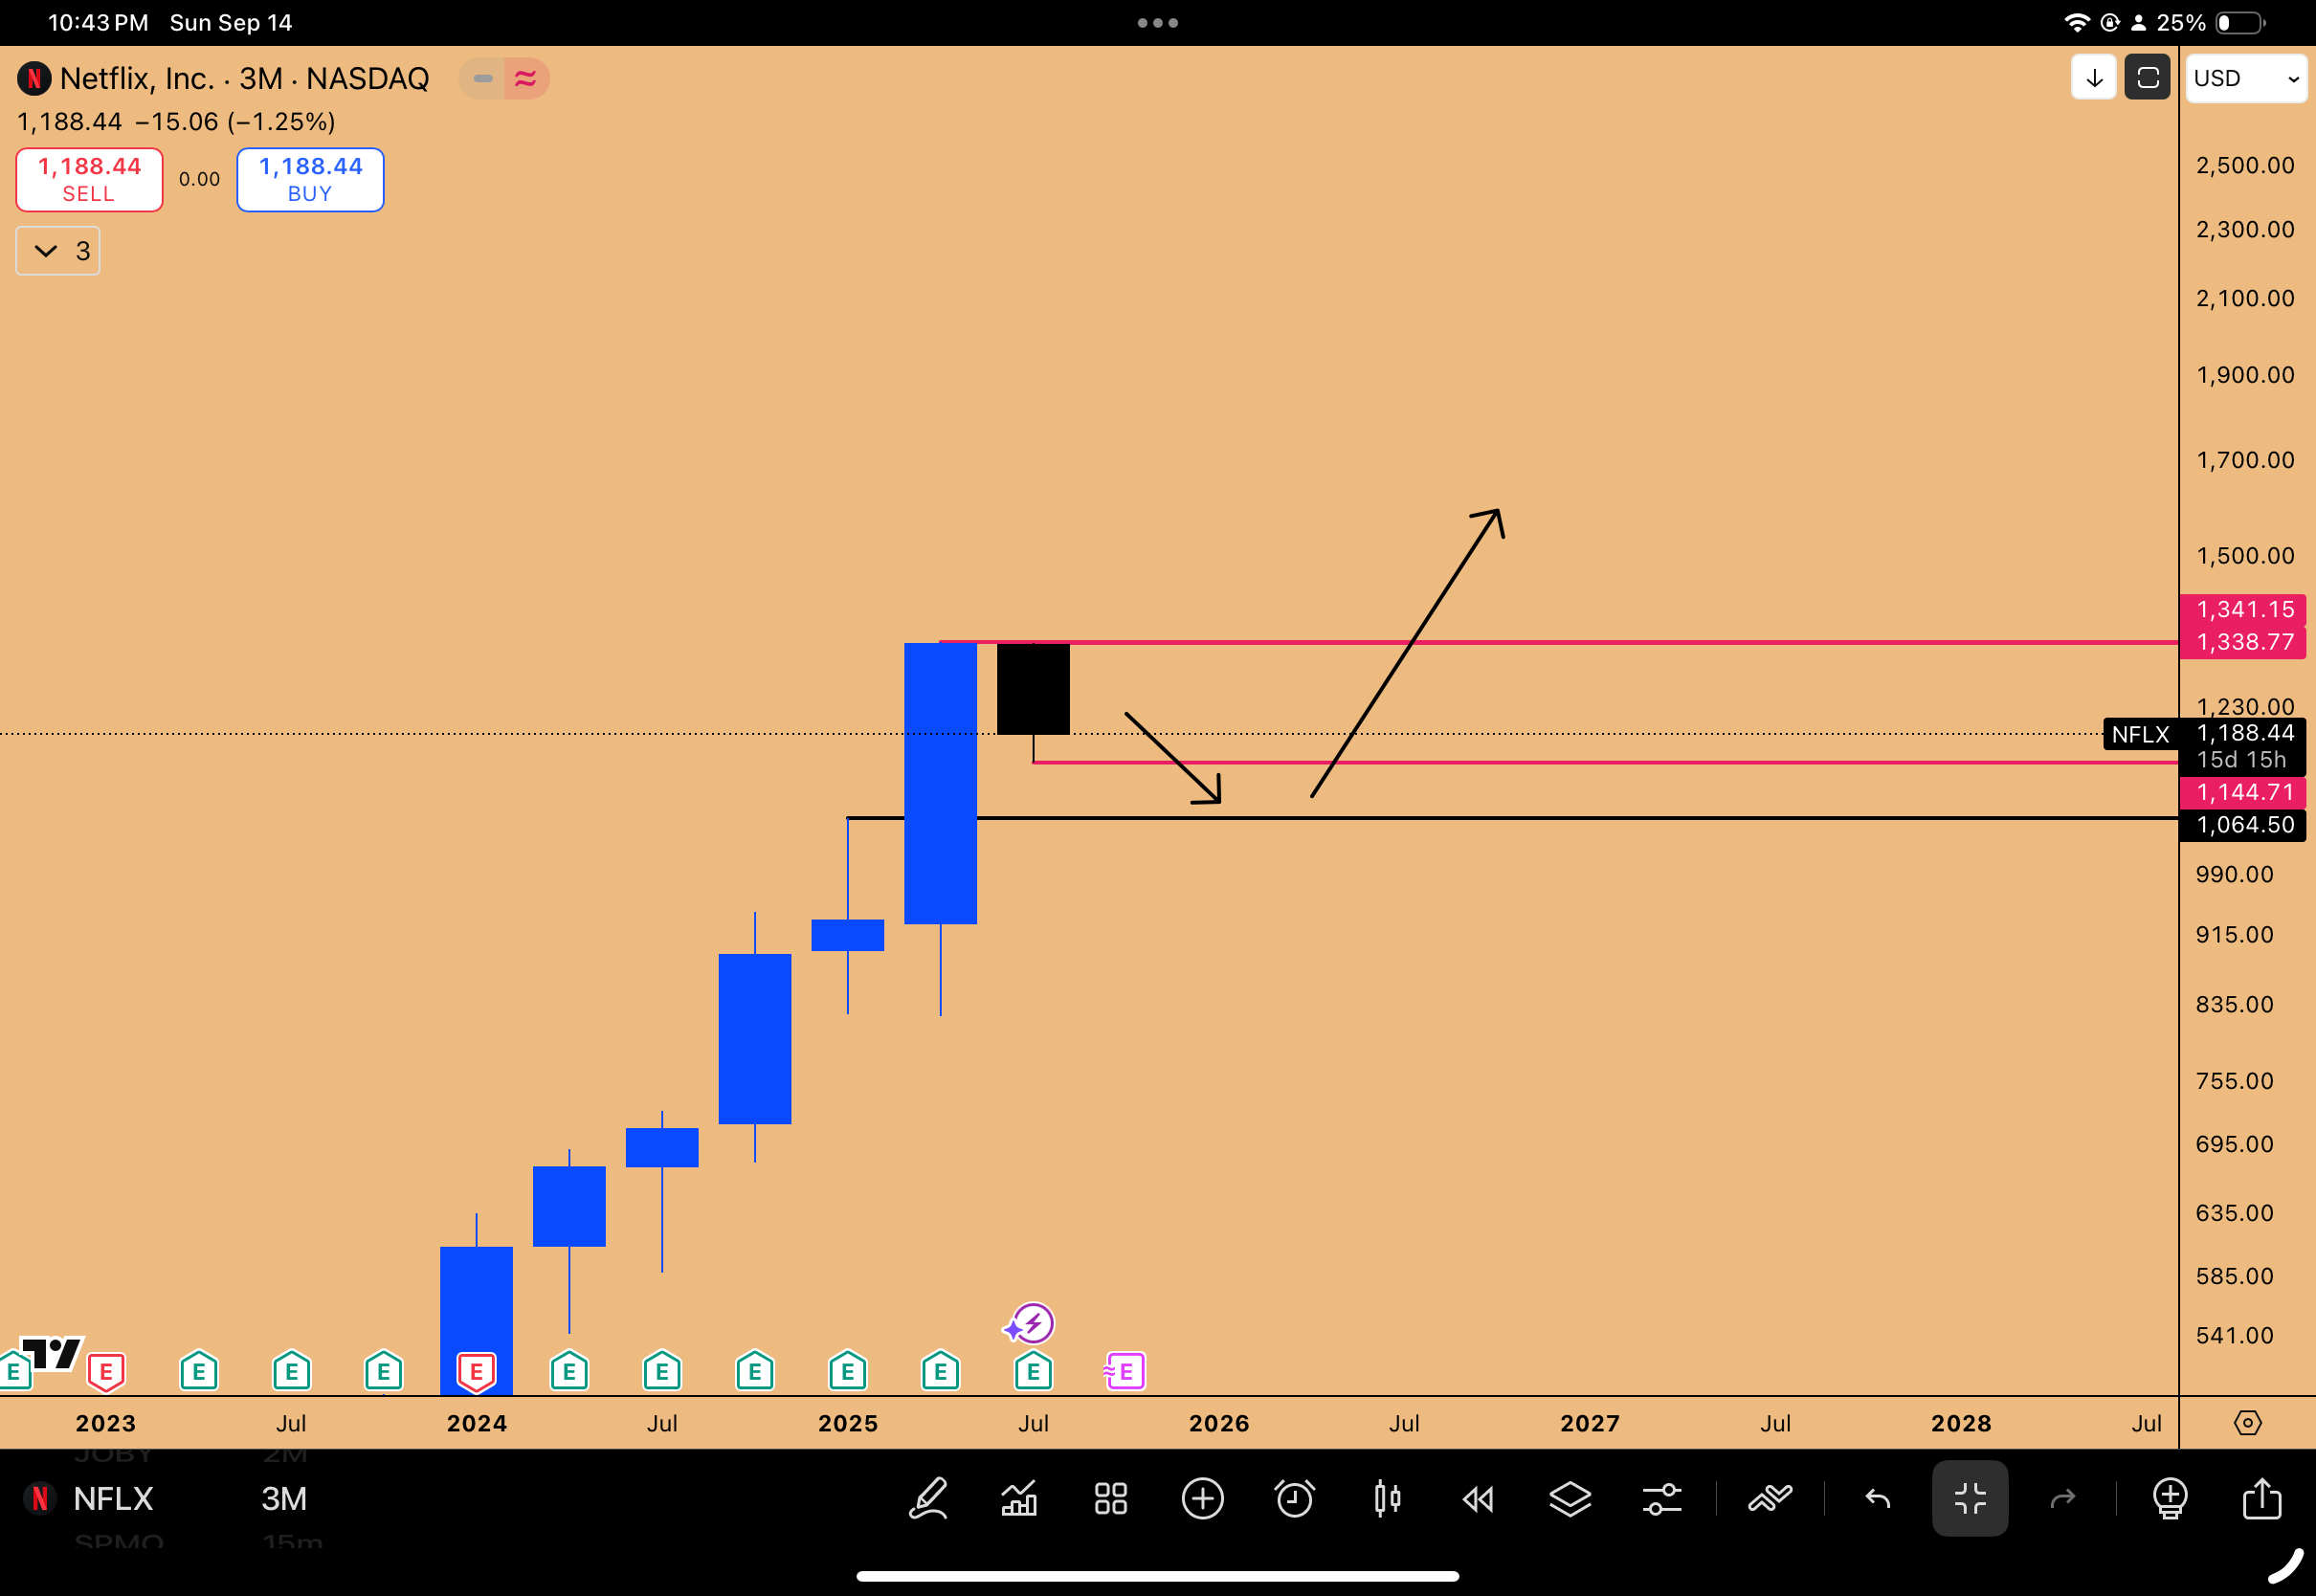
Figure 9: Inside 3-month candle pattern in play
The AI Impact on Filmmaking
The fundamental driver is the AI revolution's impact on productivity. Netflix is utilizing machine learning and models like Google's Veo 3 to generate movies. This technology is drastically cutting down production costs. A blockbuster movie that previously cost $400 million to produce can now be made using AI technology for just $50 million.
This massive reduction in costs means profit margins are going to go “bazooka up.” As highlighted in an interview with Google DeepMind's CEO, they are actively working with Hollywood directors to tailor Veo 3 for the filmmaking industry, aiming for 100x productivity improvements. This will be a very positive shock for Netflix's profitability, potentially causing the stock to double as revenues go vertical.
Tesla (TSLA): The Quarterly Breakout
Tesla is exhibiting heavily bullish price action with an inside quarterly candle failure to the upside. This breakout is occurring from a consolidation that can be viewed as a double inside quarterly candle.
Invalidation: The current quarter's low at $288.
Target 1: All-Time High
Target 2: $563
Target 3: $658
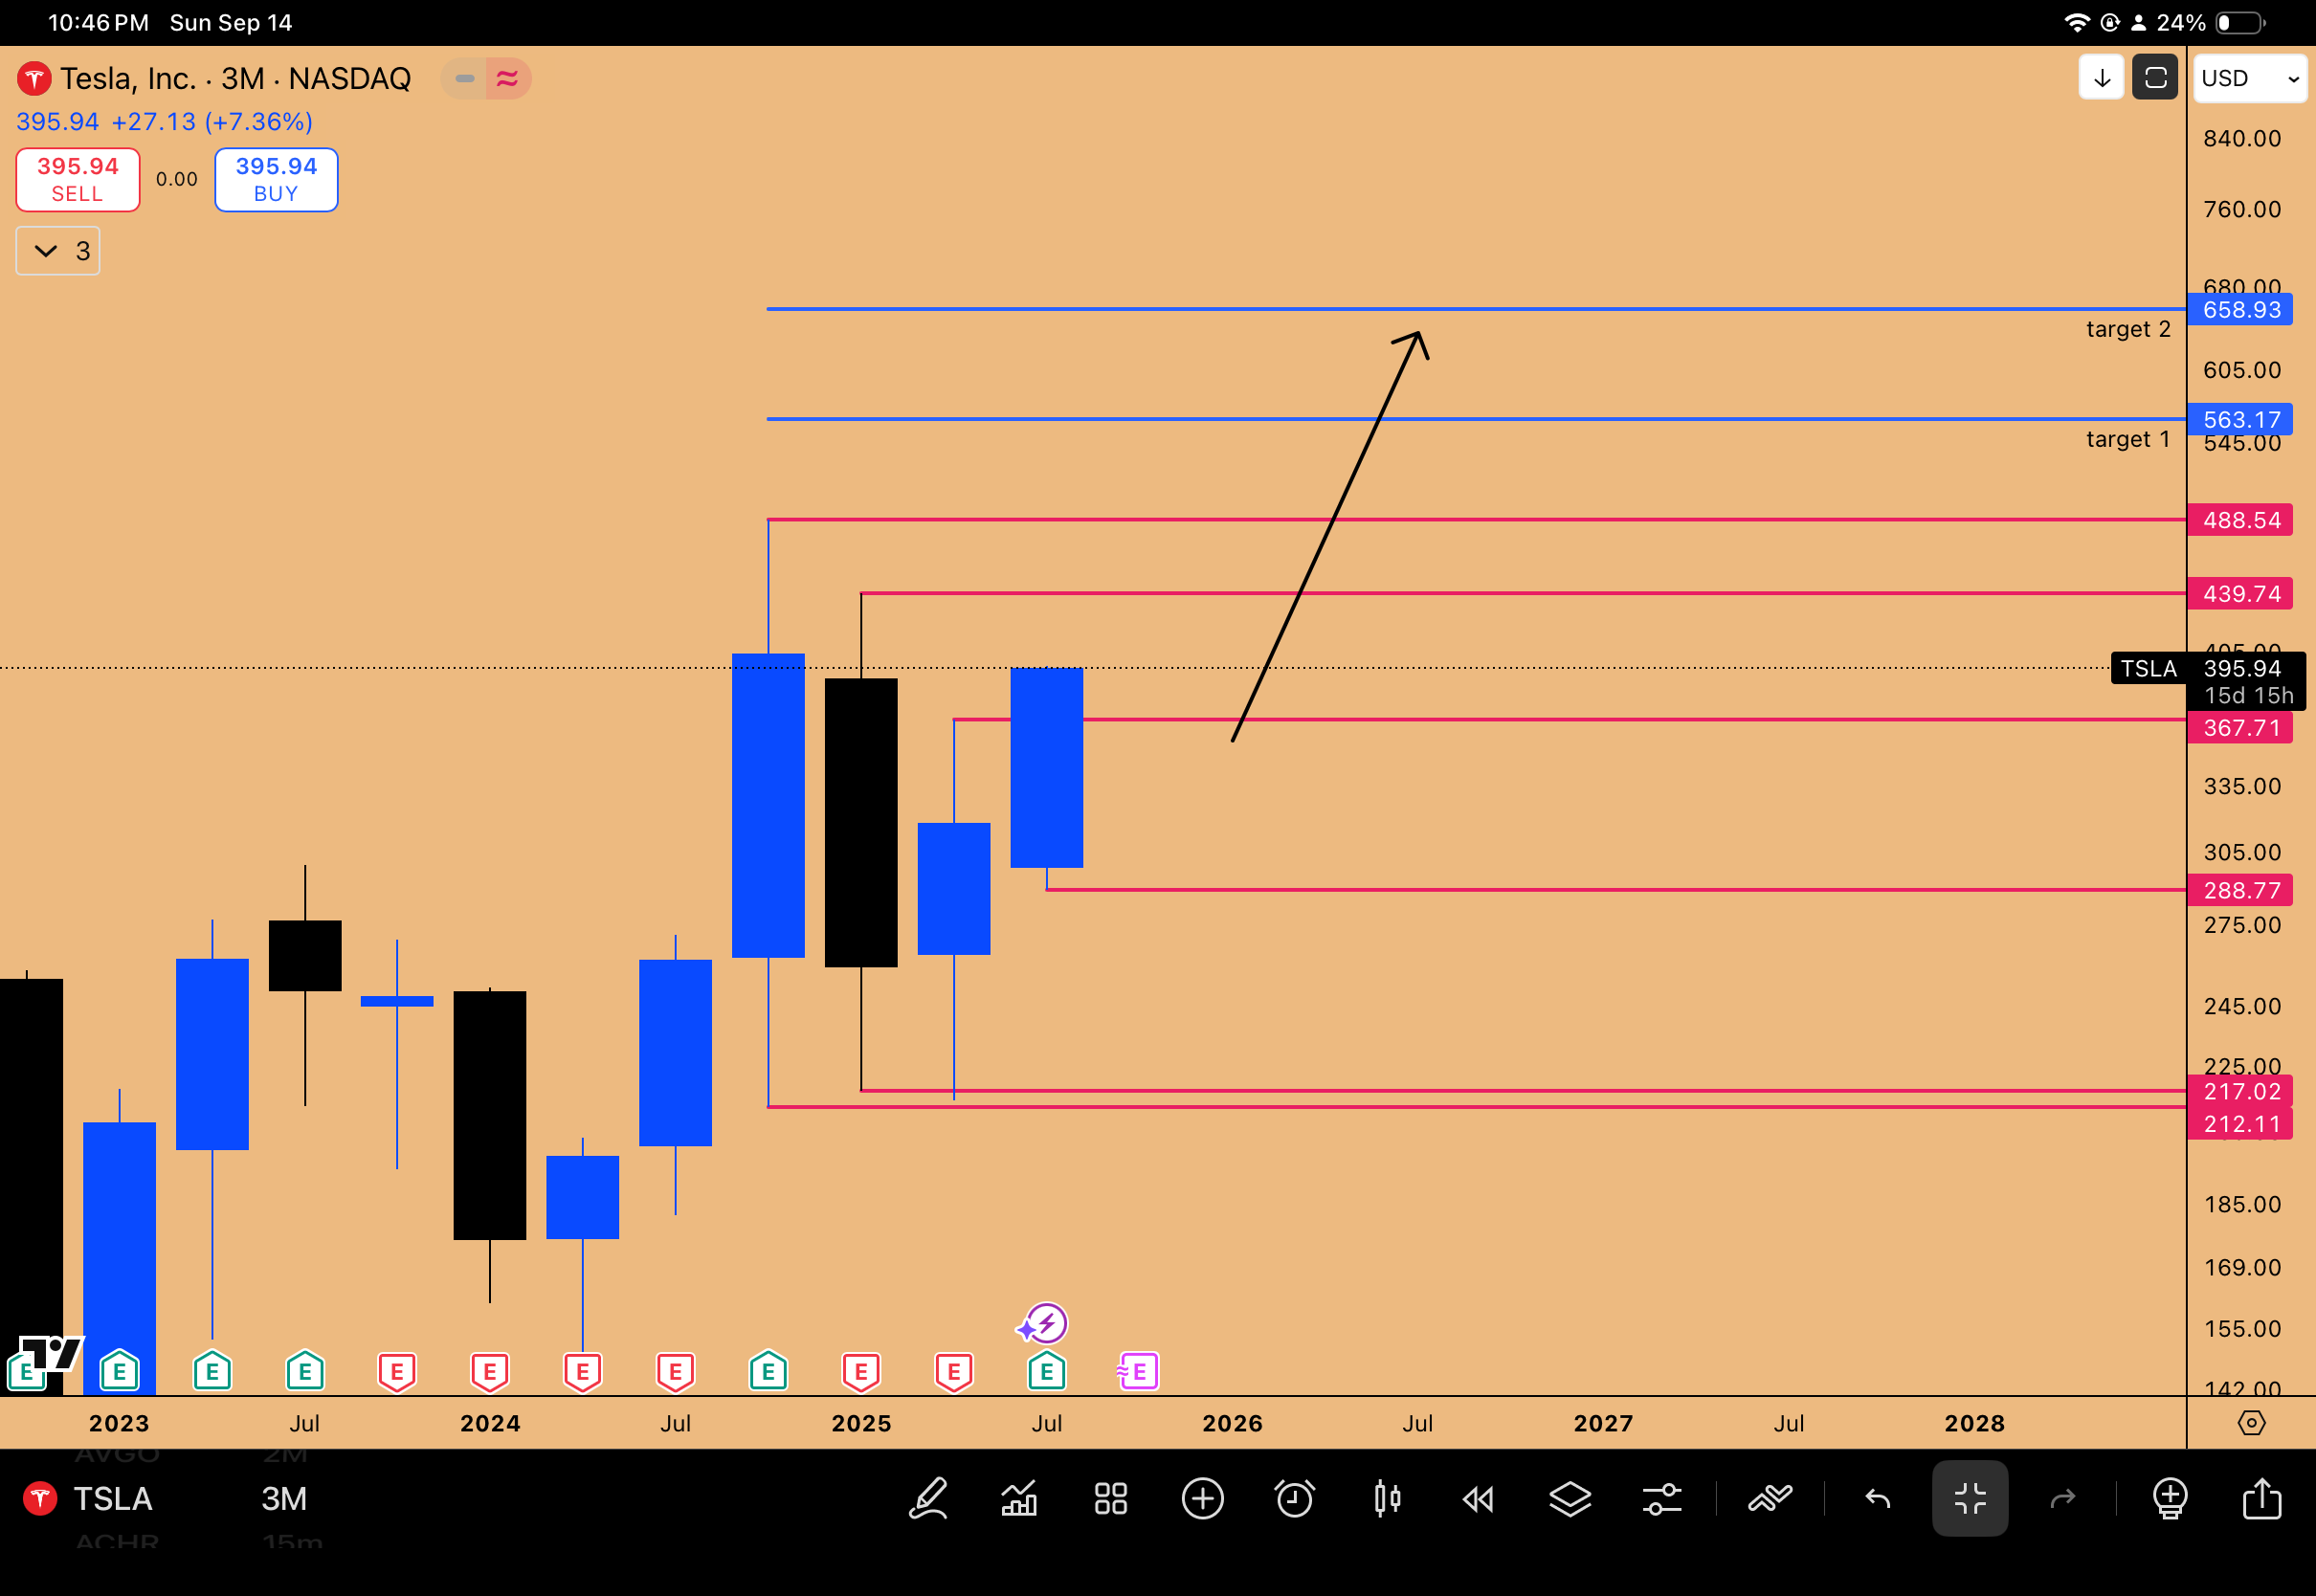
FIGURE 10: Inside Quarterly candle failure breakout in progress
💻 Options Tool Spotlight: Tracking Option Contracts on TradingView
A useful tool for tracking options positions is available directly within TradingView, eliminating the need to check Yahoo Finance or broker platforms. Here is a step-by-step guide using the Microsoft February 2026 $550 strike calls as an example:
Go to the bottom right of the TradingView interface and click on the "Products" page.
Select "Options."
In the search bar, type the ticker (e.g., Microsoft) and open it.
Click on "Chain" to view the entire option chain.
Select the expiration date (e.g., February 2026).
Scroll down to the desired strike price (e.g., $550). The current price will be displayed (e.g., $19.08/$19.20).
Click on the specific contract and select "See overview."
Click on "Full chart" to view the option contract's price history on a daily chart.
You can also copy the full ticker description (e.g., OPRA:MSFT260220C00550000) from the overview page and add it directly to your watchlist for easy monitoring.
🎯 Key Takeaways and Outlook
The landscape heading into the final quarter of the year is overwhelmingly bullish for risk-on assets. The confluence of macroeconomic catalysts (Fed rate cuts), strong seasonality, and the burgeoning AI revolution is creating a meltup environment where the primary risk is under-exposure.
Crypto Outlook: Bitcoin is undergoing a bullish consolidation, with the $108,388 level critical for the Q3 close. A breakout is expected in October. Ethereum is confirming a macro breakout targeting $10,000. Altcoin season is active, with XLM (targeting $1-$2), SUI, and Solana presenting strong setups driven by technical breakouts and M2 money supply correlations.
Equities Outlook: The NASDAQ remains in a strong uptrend, supported by the Nikkei's expansion. While the DAX offers a compelling 8R technical setup targeting 26,000, the focus remains on US equities due to stronger fundamental support. The AI narrative is dominant. Microsoft is the key holding for Q4, expected to outperform significantly. Lagging plays like Amazon (targeting $292) and Netflix (poised for massive profit margin expansion due to AI-driven cost reductions) offer substantial catch-up opportunities. Tesla is also breaking out with targets up to $658.
Strategy: The next two weeks may see consolidation or volatility as Q3 closes. The real movement will begin in October when Q4 starts. The structures forming on the quarterly charts will remain bullish as long as the Fed continues its path of rate cuts, which the market is fully pricing in.
A comprehensive quarterly outlook report will be provided on September 30th to detail portfolio positioning strategies for the next three months.
What's your take on these setups and the Q4 meltup? Share in the comments—let's discuss strategies. Subscribe for more market breakdowns!
Disclaimer: This isn't financial advice – just market musings from the charts. Always do your own research.
If you enjoyed this deep dive, please share it with fellow traders!