

Q4: The Last Discount Window: Liquidity Drivers Point to Explosive Setups Where No One Is Looking

💼 Executive Summary
Welcome to the Quarterly Market Outlook, a comprehensive analysis detailing the technical setups, macroeconomic drivers, and strategic positioning poised to define the final quarter of 2025 and beyond. This deep dive reveals an environment characterized by loose monetary policy, accelerating liquidity, and the significant threat of currency devaluation. These factors are creating a powerful tailwind for risk-on assets, setting the stage for a new bullish leg in equities and significant catch-up trades in the cryptocurrency market. As we navigate this landscape, understanding institutional behavior and identifying key technical patterns will be crucial for capitalizing on the impending volatility.
The central thesis revolves around the expansion of the M2 money supply and the monetary easing pendulum swinging once more with interest rate cuts expectations rising. The Fed under current Chair Powell leaning on cutting rates 4 more times by the end of 2026. This liquidity injection is a slow motion dilution of the dollar a devaluation happening in plain sight. Capital is being forced into wealth-preservation assets. Gold’s 139% rally since the 2022 bottom, outpacing the S&P 500’s 92%, is the clearest signal of this new era. The hard asset supercycle is here, and with it comes the need to own tangible stores of value and high-growth equities to safeguard purchasing power.
In the cryptocurrency sphere, Bitcoin (BTC) is exhibiting strong macro bullish signals, comfortably holding previous monthly and quarterly lows. A critical observation is the role of the IBIT ETF, which reveals institutional positioning not always evident on BTC futures charts. Bitcoin is currently lagging behind NASDAQ, which has consistently printed new all-time highs. We anticipate a significant catch-up trade in Q4, driven by strong seasonality and the correlation between the two assets, described as “almost near 100%.” Ethereum (ETH)presents an even more lucrative setup, poised to break out of a 3.5-year macro range. Cross-market analysis with Binance Coin (BNB), which has already rallied 44% above its 2021 high. This development suggests Ethereum is significantly undervalued relatively speaking and this bull trend in ETHUSD should target $6,000 to $7,000 in the coming month(s).
The US equity market is defying traditional bearish seasonality. The lack of a September pullback is an “ultra bullish signal,” pointing towards significant acceleration going into October’s earnings season. Then as the year closes, investors will be pressed against the glass, eyeing the shelves, and buying everything worth having. Microsoft (MSFT) is the linchpin of this rally. A deep dive into Microsoft’s fundamental strategy reveals a brilliant move to create an AI “walled garden” through Microsoft Fabric and OneLake. This strategy establishes “data gravity,” making it prohibitively expensive ($1-5 million in transfer fees) and time-consuming for enterprise clients to switch platforms to competitors such as Google’s BigQuery and Amazon’s Redshift. This first-mover advantage is accelerating revenue via Azure AI studio applications and Business Analytics tools which are in high demand amongst large enterprise customers.
Azure AI Studio as the ultimate enterprise toolkit. It provides the crucial services that companies need: fine-tuning, security, data governance (via Purview), and integration with business applications. Large Enterprise customers with huge repositories of data desire a secure, and integrated environment for warehousing their client’s data compliance and ease of use.
Furthermore, Tesla (TSLA) is exhibiting a powerful inside quarterly candle failure (a highly accurate bullish pattern), aligning with its historical Q4 explosive seasonality, targeting $565 to $658.
Key takeaways from this outlook include:
Liquidity is King: Anticipate continued asset inflation driven by expanding M2 supply and impending rate cuts.
The Crypto Catch-Up: Bitcoin and Ethereum are expected to accelerate in Q4 to match NASDAQ’s performance, driven by institutional ETF flows (IBIT/ETHA) and strong seasonality.
AI Dominance: Microsoft’s enterprise AI strategy is creating a sustainable moat, driving the NASDAQ higher and signaling the early stages of the AI bubble.
Commodity Supercycle: Gold is targeting $4,085, and Silver is poised to break 45-year highs, reflecting global currency devaluation.
Technical Strategy: Utilizing patterns like the Inside Monthly Candle Failure and 3-Week Candle Supports, alongside the Opens Indicator, provides high risk-reward entries for the upcoming quarter.
What does this environment mean for your portfolio? As we enter a new quarter characterized by unprecedented liquidity and technological acceleration, strategic positioning in key assets is imperative.
If you’re finding value in our research, we’d like to extend a personal invitation to explore the next level of market analysis within our Speculators Trading community. Our Discord server is a collaborative space dedicated to helping traders optimize capital allocation. Inside, you’ll gain access to our real-time Trading-floor commentary, high-conviction technical setups, proprietary educational resources, and strategic bi-weekly livestreams. We invite you to experience these premium resources firsthand and see how they can enhance your portfolio management. Join us with a 14-day free trial (120 USD/month after trial is over), you can cancel anytime.

🏛️ The Macro Environment: Liquidity and Currency Devaluation
The bullish outlook across asset classes is fundamentally driven by the macroeconomic environment, specifically the expansion of system liquidity and the resulting devaluation of fiat currencies. This dynamic is the core function driving assets like Bitcoin and NASDAQ higher.
Liquidity as the Primary Driver
If there is surplus liquidity in the system, it invariably flows into the NASDAQ, and consequently, further out the risk curve and into Bitcoin. The NASDAQ (tracked via the QQQ ETF) serves as a major global store-hold of wealth. Massive capital flows into QQQ not just from hedge funds and retail traders, but also from international central banks (Japan, South Korea, Australia, European countries etc.) and pension funds (US and Canada), who often prefer QQQ over their domestic markets due to limited growth opportunities locally.
We are currently in an environment where monetary policy is loose. Excess liquidity was already introduced via the Trump administration’s Big Beautiful Bill passed in the summer, which catalyzed the past 4 month’s of heavy outperformance in US equities. Furthermore, the expectation is that interest rate cuts are coming, with anticipation that “Powell is going to cut rates 4 times in the future.” These impending cuts will introduce even more liquidity into the system and continue fueling the Risk-On Appetite going into Year end and first half of 2026.
The Threat of Currency Devaluation and Loss of Purchasing Power
The most significant macroeconomic factor at play is currency devaluation, described as a “society killer in the longer term. ”
When liquidity is flooded into the system and asset prices rise, the value of the underlying currency, any currency e.g. USD, EURO, GBP, CAD, YEN etc—simultaneously decreases. This disproportionately affects individuals who do not own assets. Their salaries and income lose purchasing power day over day. This leads to an inability to afford homes or maintain lifestyles, eventually causing frustration and potential social revolt.
It is imperative to understand that liquidity injections happen at the expense of that country’s currency. This devaluation is global, affecting the US Dollar, Euro, British Pound, Japanese Yen, Chinese Yuan, Australian Dollar, Indian Rupee, and Canadian Dollar and any country out there which has engaged in Money Printing mechanism.
Wealth Preservation Assets and Asset Inflation
If all federal currencies are going down, wealth preservation assets go up. The four key assets identified are: Gold, NASDAQ, S&P 500, and Bitcoin. Holding these assets is essential to protect against inflation and currency devaluation.
The performance comparison between these assets since the October 2022 bear market bottom reveals the severity of the devaluation threat:
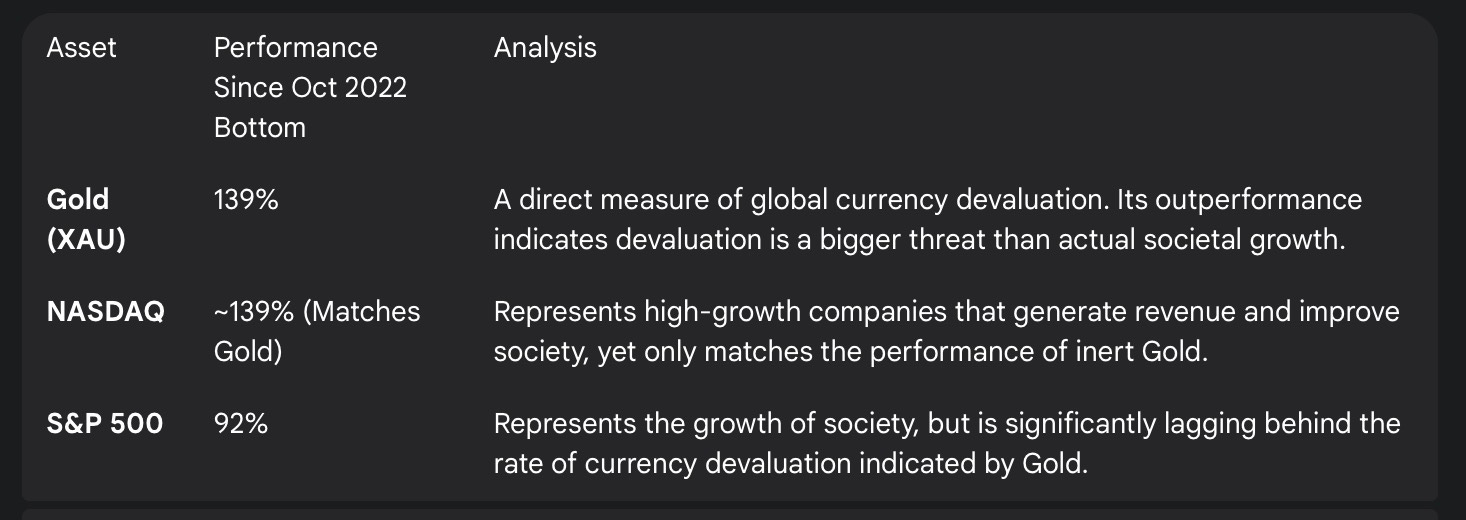
This comparison underscores that the currency devaluation threat is massive, driving central banks, hedge funds, sovereign investments, and even monarchies into gold because they fear that paper currency will lose its value, leaving only hard assets as valuable.
When rate cuts happen, they are stimulatory because the central bank is signaling the green light to devalue the currency. This leads to asset inflation, while carrying out the devaluation of US Dollar’s Purchasing power. Inflation doesn’t just affect household utilities, groceries, or car insurance; it shows up as Asset Inflation as well, significantly inflating the prices of assets such as: Bitcoin, SPX500, Gold and NASDAQ. The strategy for the next 6-8 months must be to position in these asset classes, potentially utilizing leverage (option calls, leveraged ETF’s, margin via prop firm funding) to outpace inflation.
M2 Money Supply and the Return to Quantitative Easing
The bullish stance is supported by the trajectory of the M2 Money Supply. After a brief dip during the Federal Reserve’s Quantitative Tightening (QT) phase in 2022, where liquidity was sucked out of the system, the M2 money supply is now rising again (since 2023 bottom).
The NASDAQ essentially tracks the M2 money supply. If the Fed stops QT, moves towards Quantitative Easing (QE), and starts cutting rates, the M2 graph will accelerate significantly. This scenario mirrors the COVID-19 pandemic response, where $4.5 trillion worth of money was printed overnight, inflating the balance sheet and causing a massive acceleration in all risk-on assets due to currency devaluation. This is the environment we are entering now.
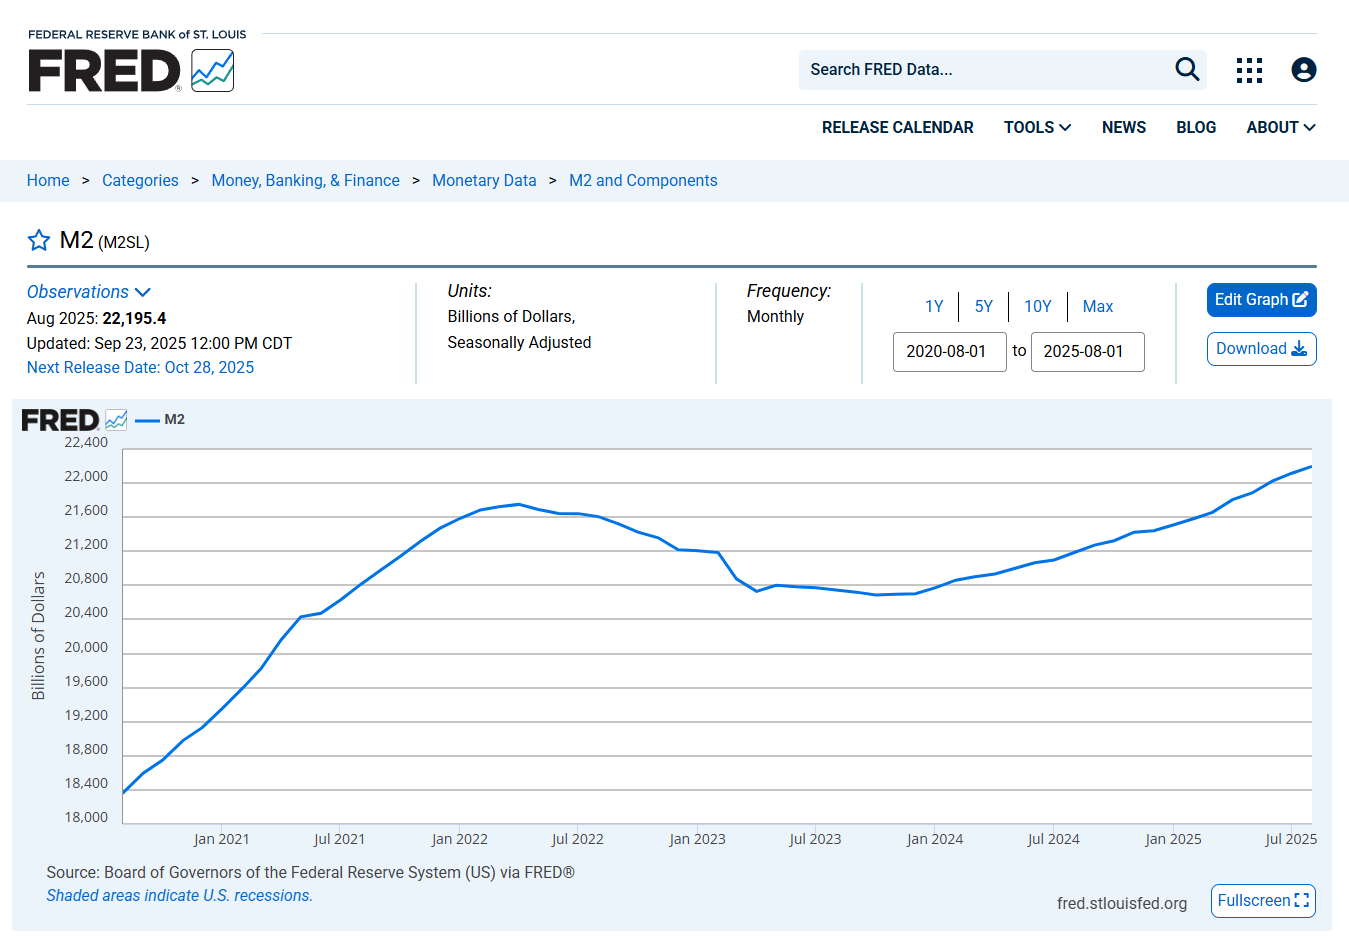
Figure 1: M2 money supply trajectory (January 2021 - July 2025), Source: St. Louis Fed
₿ Bitcoin’s Q4 Trajectory: Institutional Influence and the NASDAQ Correlation
The analysis of Bitcoin begins with a high-timeframe perspective, emphasizing the importance of quarterly and monthly closes, and the significant influence of institutional capital flows via ETFs. The outlook for Q4 2025 remains decidedly bullish, predicated on technical support holding and a strong seasonal tailwind.
Macro Technical Outlook and Invalidation Levels
From a macro perspective, Bitcoin remains in a bullish environment. The key invalidation level moving forward is the previous quarter’s low (July 2025). As long as this quarterly low is not taken out, the market structure remains intact. Furthermore, the market has not taken out any previous monthly lows, indicating sustained upward momentum.
Currently, an inside monthly candle is in formation. This suggests that the downside liquidity for the recent lows is still vulnerable. It is acceptable for the price to sweep this liquidity and still maintain the higher timeframe bullish bias.
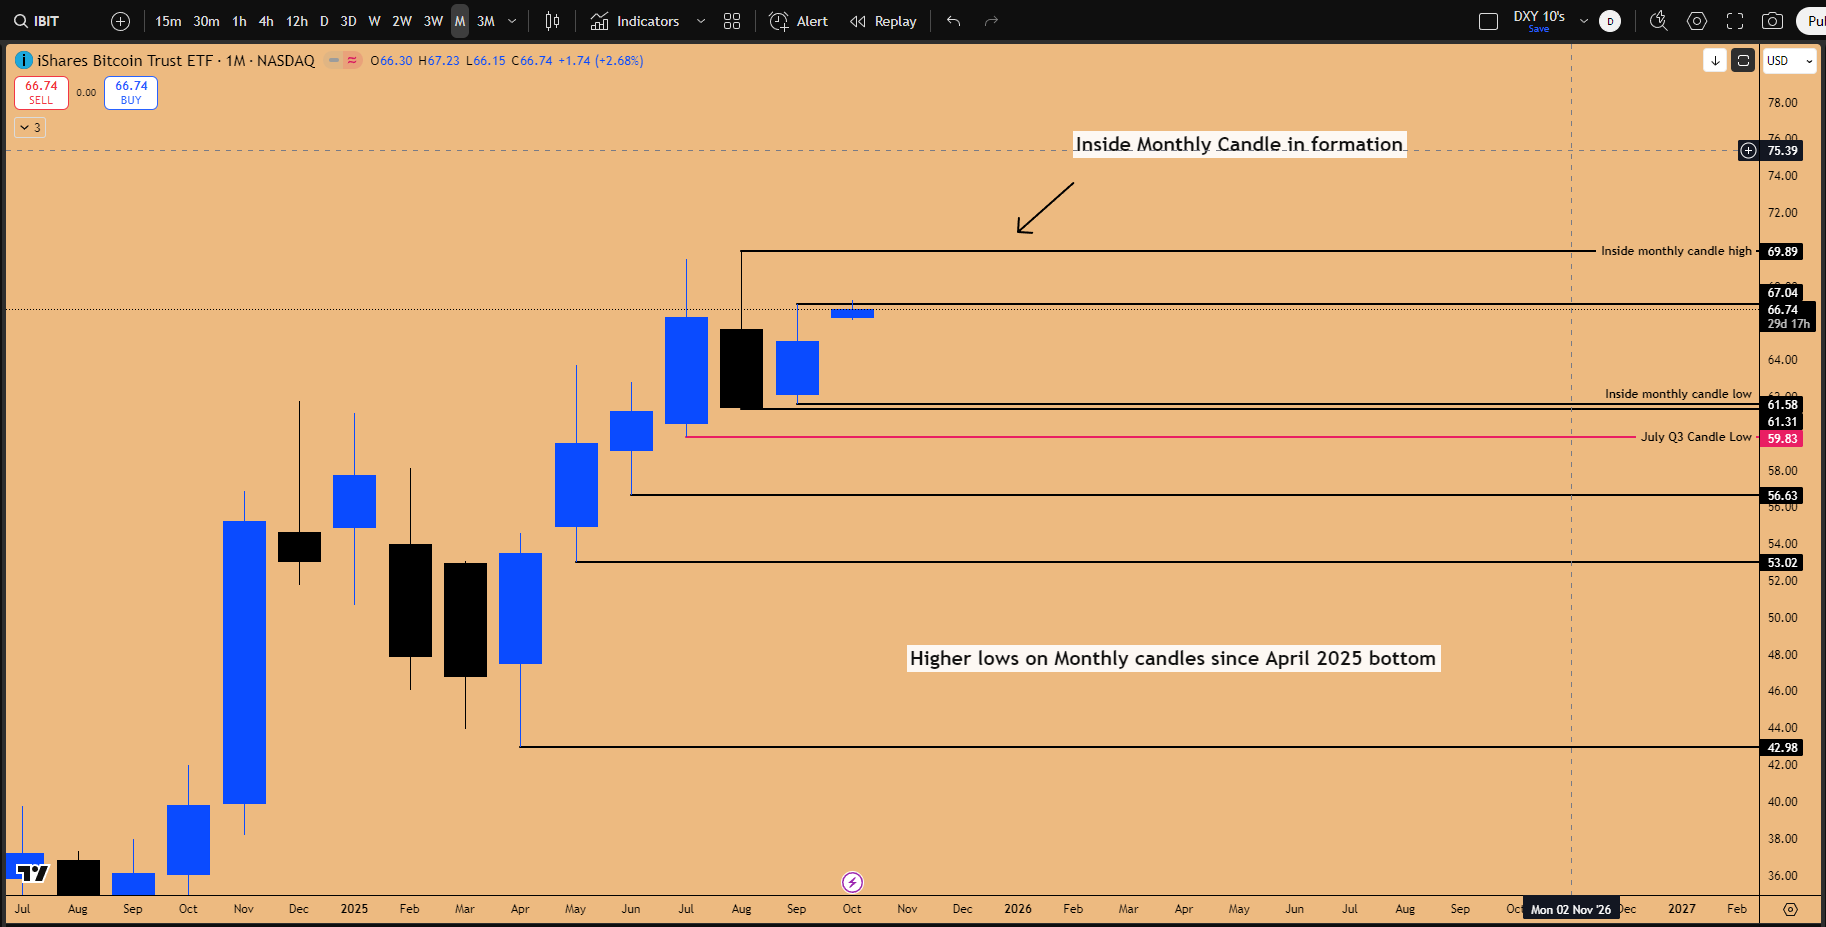
Figure 2: Macro Bullish structure on the monthly time frames for IBIT (BITCOIN), suggesting further upside in Q4, 2025.
The IBIT Factor: Analyzing Institutional Flows
A crucial element of modern Bitcoin analysis is monitoring the iShares Bitcoin Trust ETF (IBIT), as it is a “very powerful way of institutional investment to come into the crypto markets.” Comparing IBIT with BTC futures reveals key discrepancies that inform the institutional perspective.
Pattern Discrepancies: The inside 3-week candle failure visible on IBIT was not present on the Bitcoin futures chart. Traders relying solely on futures would have missed this critical bullish support signal. The SR level defended on IBIT corresponds to 108,364 on the BTC futures chart.
Monthly Lows: While Bitcoin futures took out the previous month’s low (August) at 107,389, IBIT did not. Because institutional investment flows through IBIT, this is judged as a higher low from an institutional perspective. The higher lows on IBIT have been defended ever since the April bottom.
Overnight Action and Manipulation: The low taken out on BTC futures occurred during overnight price action on a Monday and was never registered on the IBIT ETF. Furthermore, the recent pump and gap up over the weekend is viewed as a way for institutional investors to manipulate the quarterly candle close, ensuring it closes bullishly without significant bearish rejection.
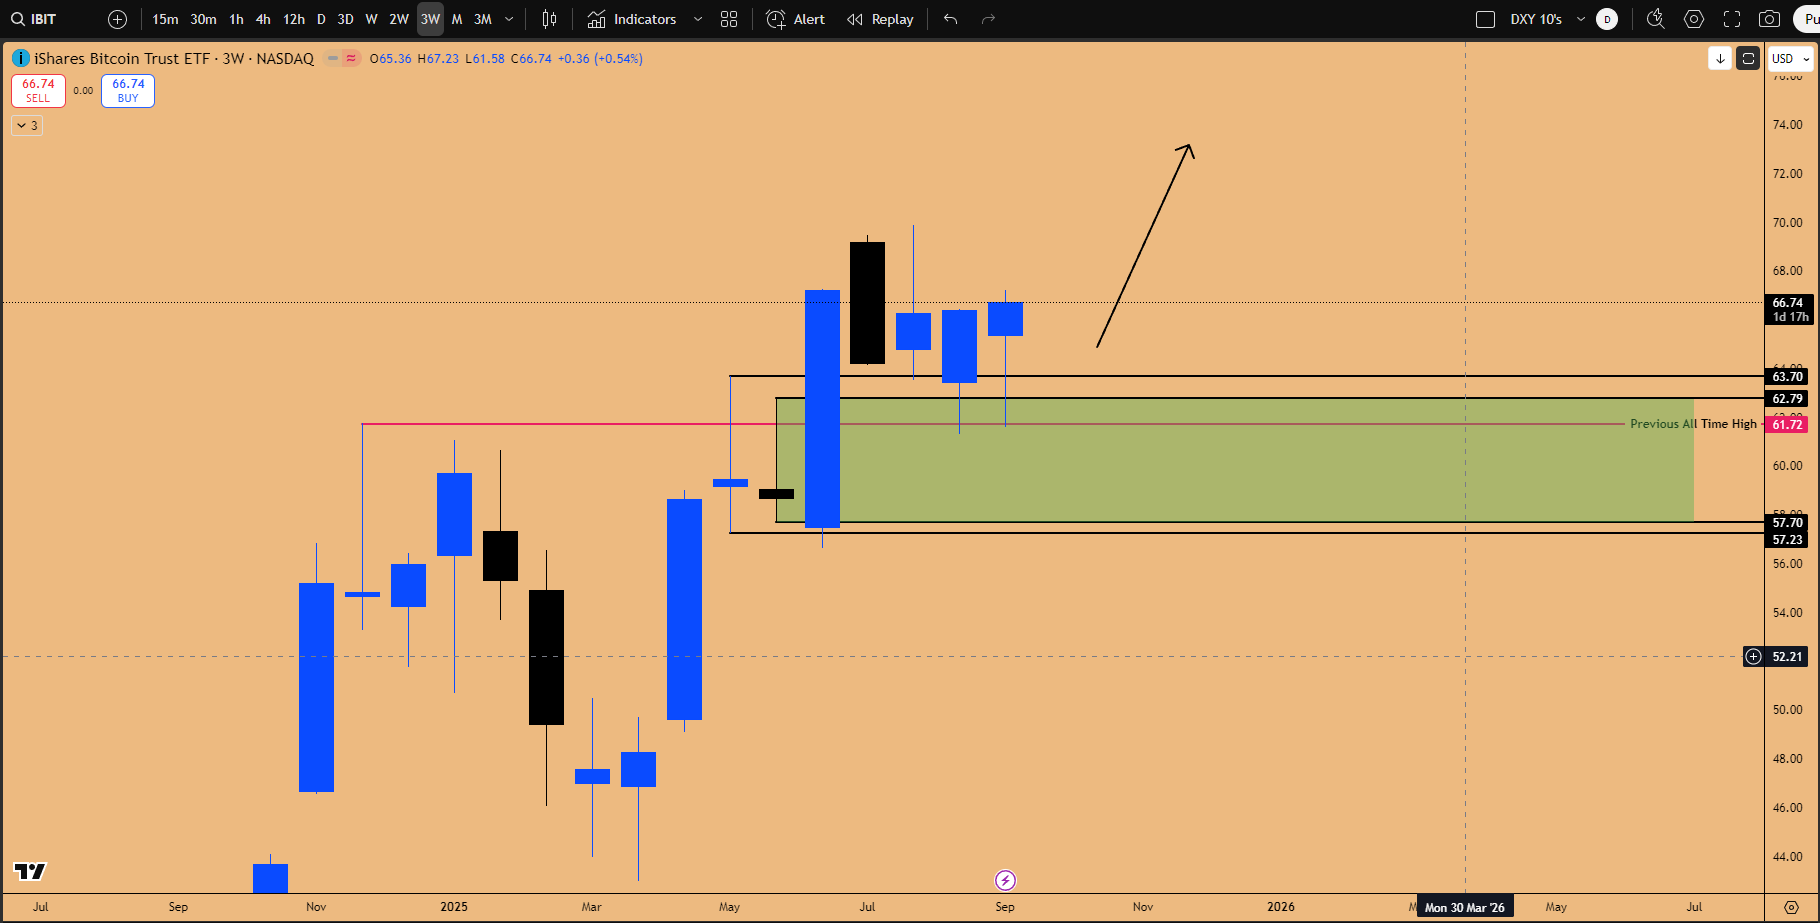
Figure 3: 3-week Bullish Orderblock defending price, suggesting next leg up about to begin
The NASDAQ Correlation and the BTC Catch-Up Trade
The primary reason for the necessity of a bullish quarterly close lies in the correlation with NASDAQ. Ever since the bear market bottom in October 2022, Bitcoin has been following NASDAQ almost perfectly, with the correlation described as “almost near 100%.” An up quarter in NASDAQ typically translates to an up quarter in Bitcoin, and vice versa.
However, there have been periods of divergence. In the April and July quarters of 2024, NASDAQ printed two bullish quarters while Bitcoin consolidated sideways. Historically, when this occurs, Bitcoin eventually accelerates significantly to catch up with the upside already transpired in NASDAQ.
This is the anticipation for the coming quarter. “NASDAQ has already shown you the path that it is telling you that it is sitting at all-time highs, and Bitcoin needs to go and do that same thing as well.” Bitcoin has significant catching up to do.
Trading Strategy: Utilizing the Opens Indicator
To capitalize on this expected move, the Opens Indicator is the recommended tool. This indicator plots monthly and quarterly opens (dotted lines).
The strategy focuses on the behavior around new quarterly and monthly opens:
Identify the Open: When the new quarterly/monthly candle opens, monitor the price action closely for the first 2-3 days.
The Retracement Opportunity: Historically, the market often trades down from the open before reversing higher, creating a bullish order block (e.g., the July quarterly open and September monthly open). Any retracement off the bat in the first few days is a buyable opportunity.
Anticipating the Bottom Wick: This downward price action is the formation of the “bottom wick” of the monthly or quarterly candle. The goal is to long this downward wick and position for the entirety of the quarterly expansion.
IBIT Gap Fill: A downward move may be warranted to fill an open gap present on the IBIT monthly chart, sitting between 65 and 66.30 (Weekly/Monthly chart gaps are significant inefficiencies). Filling this inefficiency would signal the bottom wick is complete.
Trigger Identification: Look for consolidation patterns forming on the monthly open, such as nested inside daily candles. A failure pattern, where lows are taken out but immediately rejected with no downside follow-through, is a massive long trigger. Historically, such triggers have rendered at least 8% return in the following week.
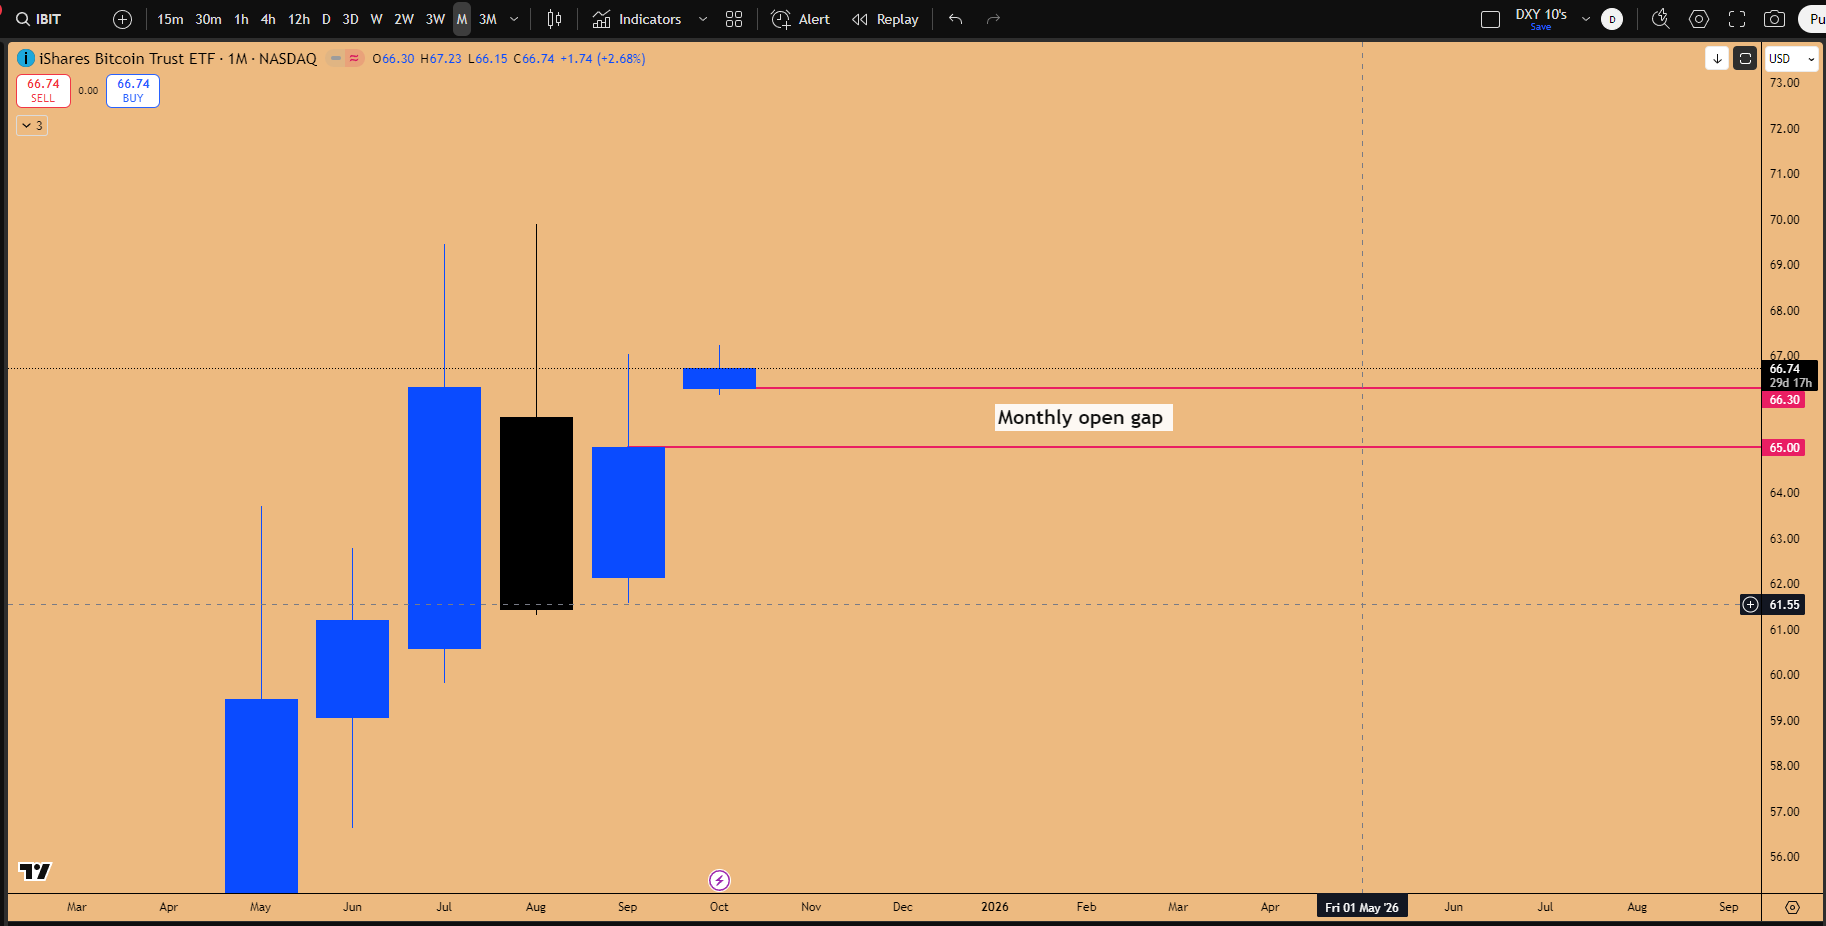
Figure 4: Open Gap on the monthly chart for IBIT (Bitcoin ETF)
Trade Setup Parameters:
Entry: Dips occurring when the new monthly candle opens, anticipating a gap fill to happen to test 114,792$.
Stop Loss: Below the monthly low at $108,672.
Confirmation: A bullish market structure break has occurred as price has taken out the nearest lower high (118,000$) .
Target: New all-time highs at 123,000$ (a 10% rally) and beyond, anticipating a massive catch-up in Q4 2025.
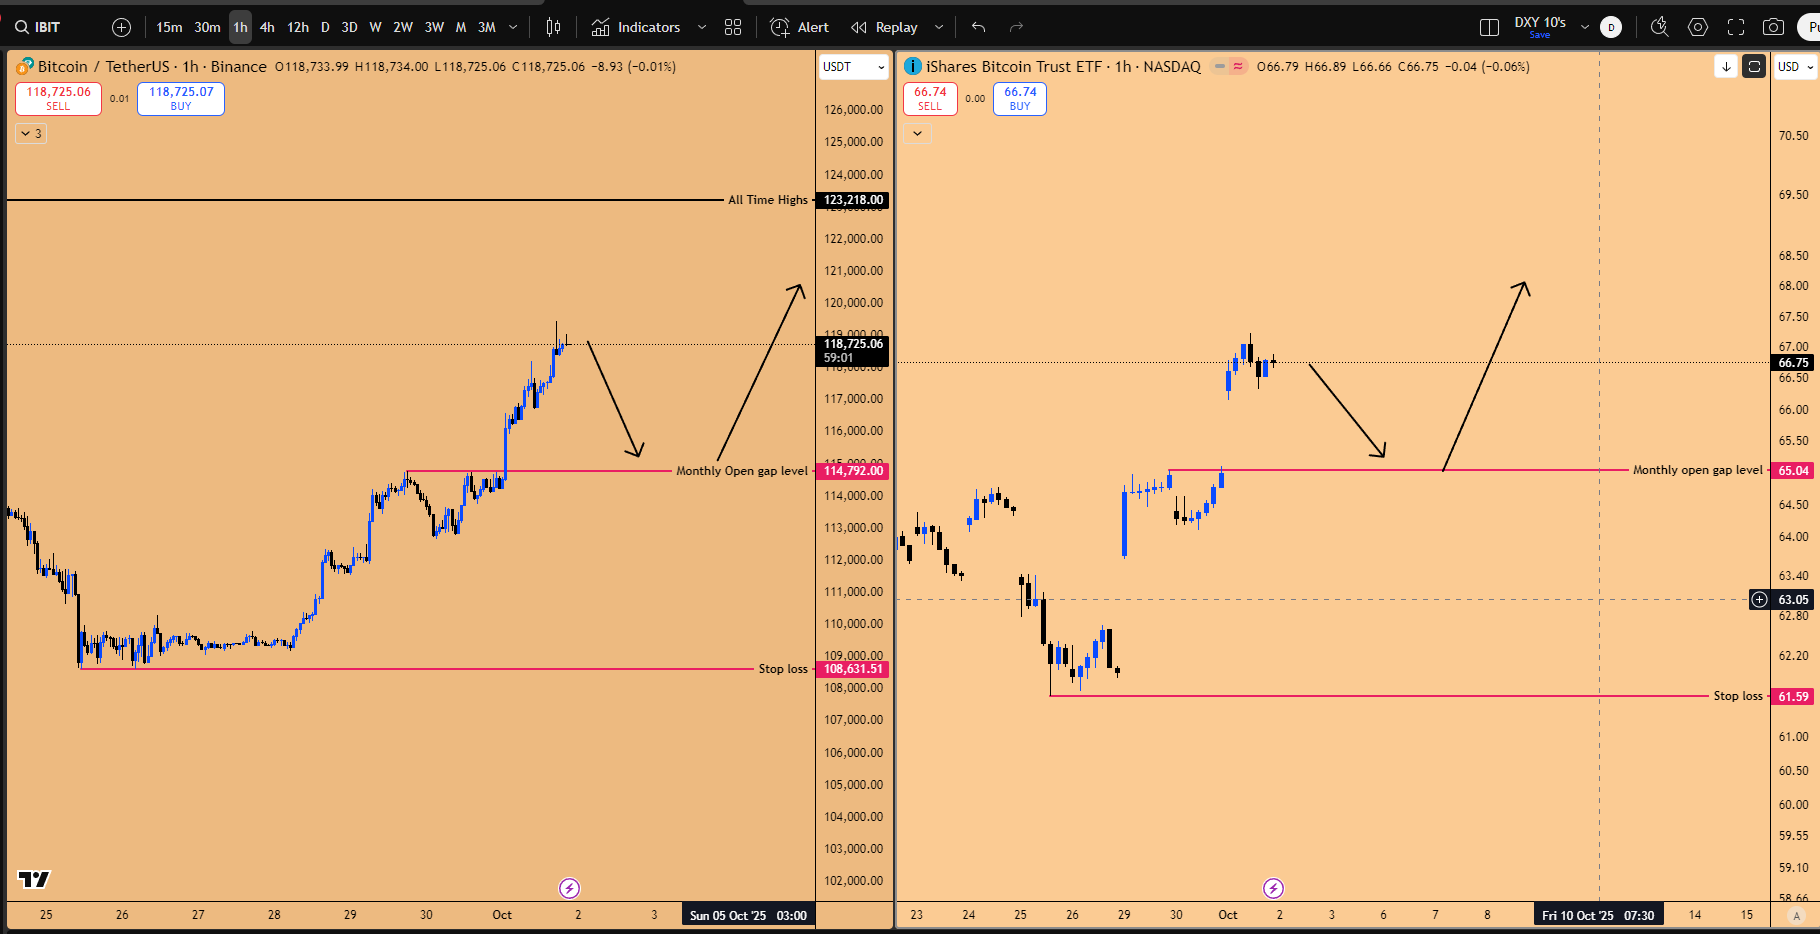
Figure 5: Trade setup for BTCUSD going into October month
🖼️ Ethereum and the Altcoin Landscape: Macro Breakouts and Cross-Market Correlations
While Bitcoin offers stability, Ethereum presents a potentially more lucrative setup, characterized by a macro range breakout and compelling high-timeframe technical patterns. The altcoin market largely mirrors Ethereum’s structure, requiring strategic diversification.
Technical Setups: Inside Candles and Failures
Several interesting patterns are forming, providing high-confidence setups for Q4:
Inside Monthly Candle: An inside monthly candle is confirming at the close of September, presenting a very good setup going into October.
Inside 3-Week Candle Failure (In Making): Price is leaving the inside 3-bar candle highs intact and attacking the lows. This is a high-probability setup in the making.
The key invalidation zone is the weekly support zone low at approximately $3354 (or $3345/3355). This is the bull/bear line. The primary expansion is expected in the next 3-week candle starting October 6th.
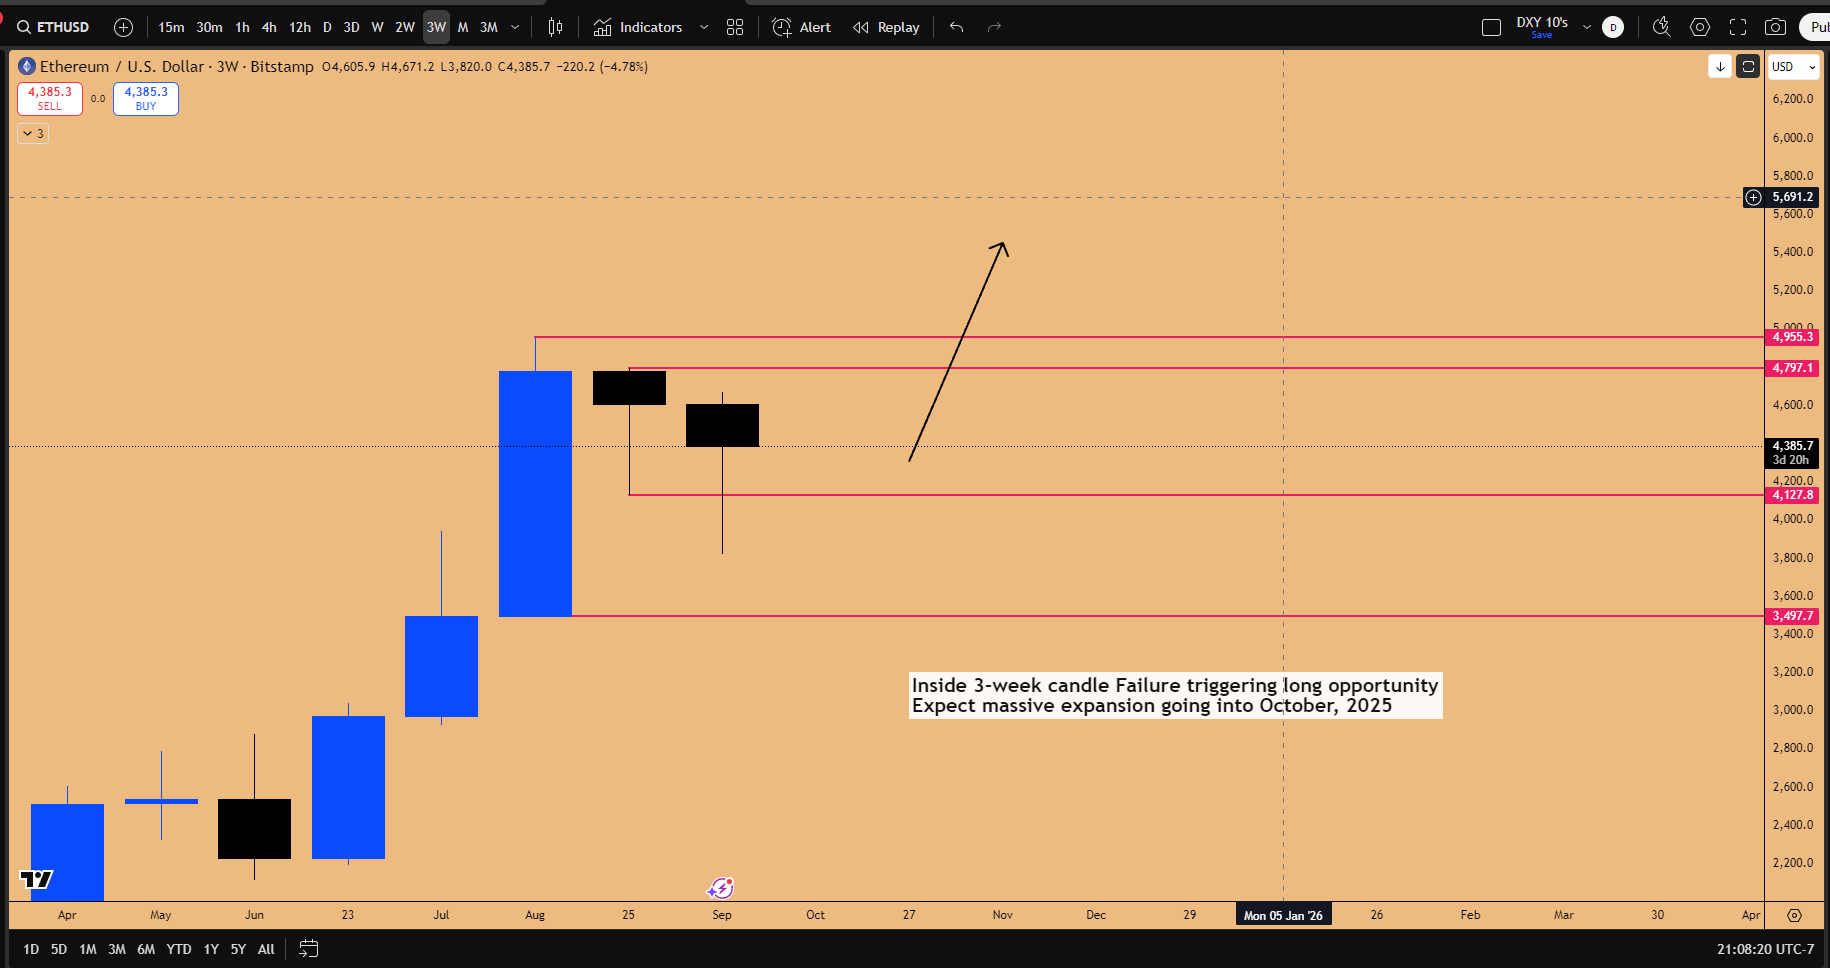
Figure 6: Inside 3-week Candle failure pattern emerging in ETHUSD. Triggering Long to capture massive upside potential in October, 2025.
Cross-Market Analysis: BNB as the Leading Indicator
Comparing Ethereum with Binance Coin (BNB) provides critical insight into Ethereum’s potential trajectory. BNB is a “carbon copy of Ethereum,” printing the same cycle highs (Nov 2021) and lows (June 2022).
A recent divergence occurred where Ethereum collapsed, taking out the August 2024 low, while BNB held its low. This collapse in ETH is attributed to political factors—the Biden administration’s attempts to clamp down on altcoins. When Trump took office, the sentiment shifted toward institutional capital flowing into crypto (ETH, LINK, SUI), allowing ETH to start catching up.
Furthermore, Ethereum’s drop was exacerbated because it is listed in the NYSE via the ETHA ETF (Grayscale Ethereum Trust), which was used by short-sellers to drive prices down at an accelerated pace. BNB, not listed in the US stock market and lacking a NYSE ETF, did not face the same pressure. Institutional money flow is dictated by ETHA and IBIT.
Crucially, BNB is already trading 44% higher than its November 2021 cycle high. This serves as a leading indicator for the Ethereum algorithm. The true pricing for Ethereum, based on BNB’s performance, should be 44% higher than its cycle high, placing it at approximately $7,000. This indicates Ethereum is currently trading at a significant discount.
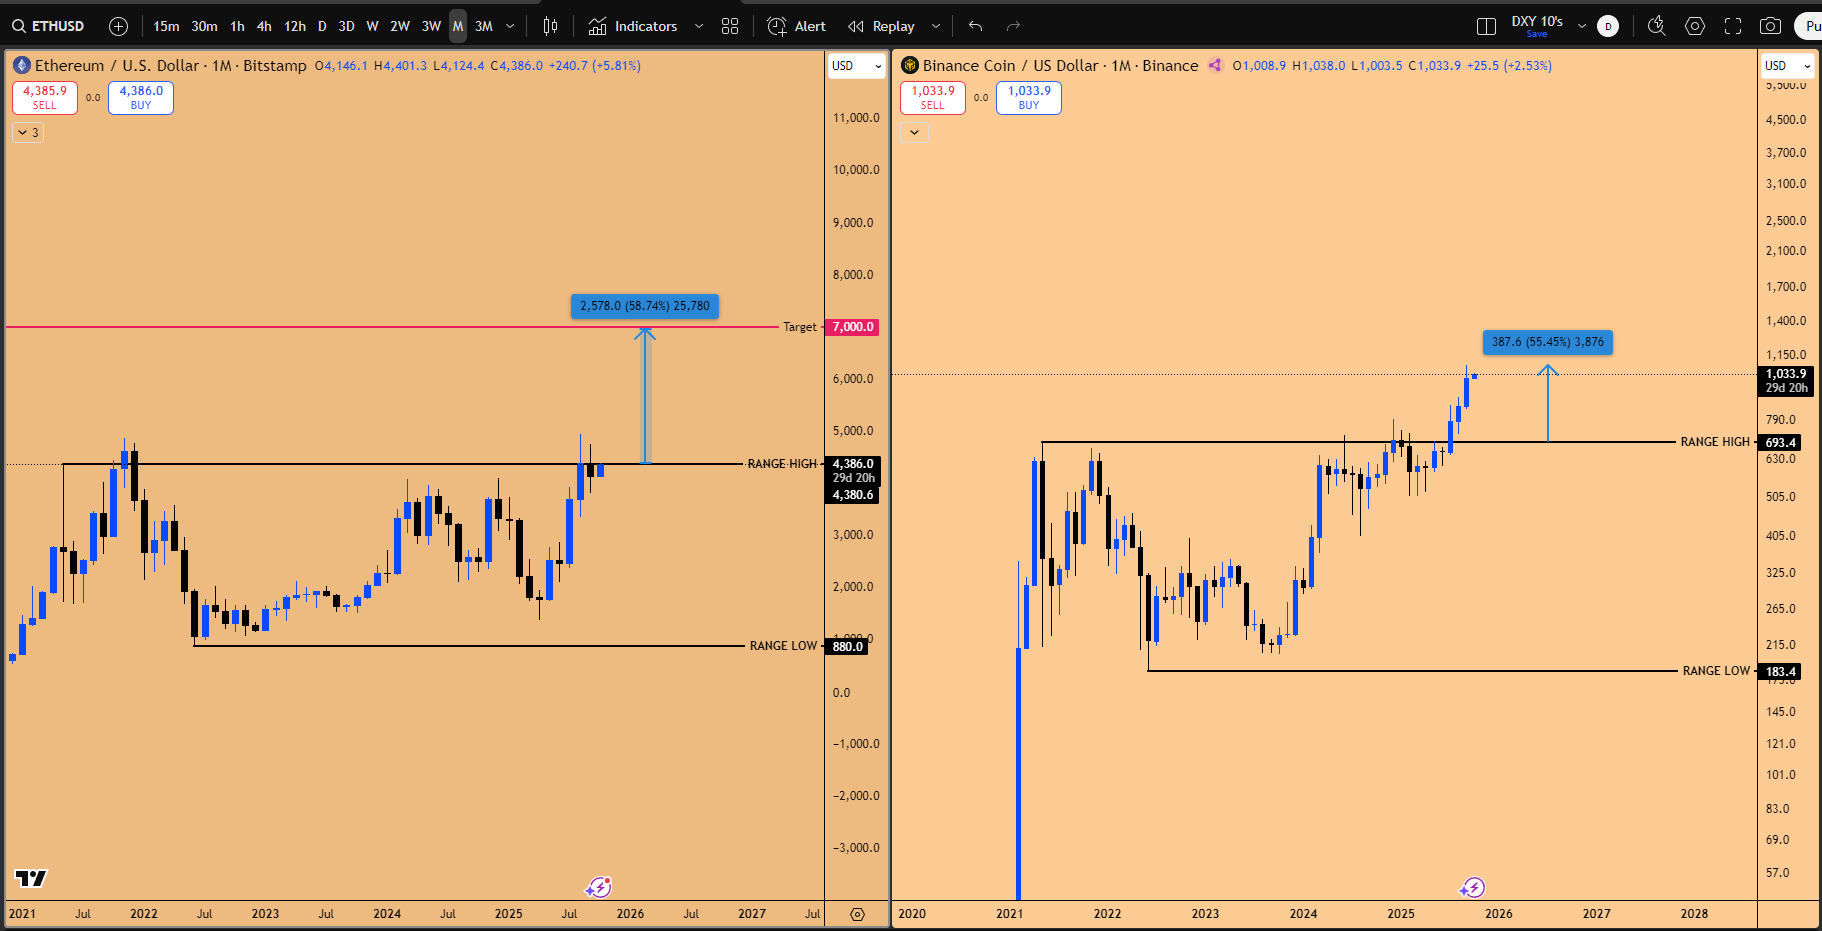
Figure 7: ETHUSD vs BNBUSD, catch up trade.
Altcoin Analysis: LINK, AVAX, and SUI
The analysis differentiates between “majors” (Bitcoin, Ethereum, Solana, XRP, and BNB) where serious investment capital rotates, and mid/small caps, which are purely speculative.
Chainlink (LINK): LINK exhibited an inside quarterly candle failure, taking out the 11.926 low (SFP). It is targeting $27.2 and $30.949/$31. On the monthly chart, it is a carbon copy of Ethereum, featuring the inside monthly candle pattern and the same weekly support structure.
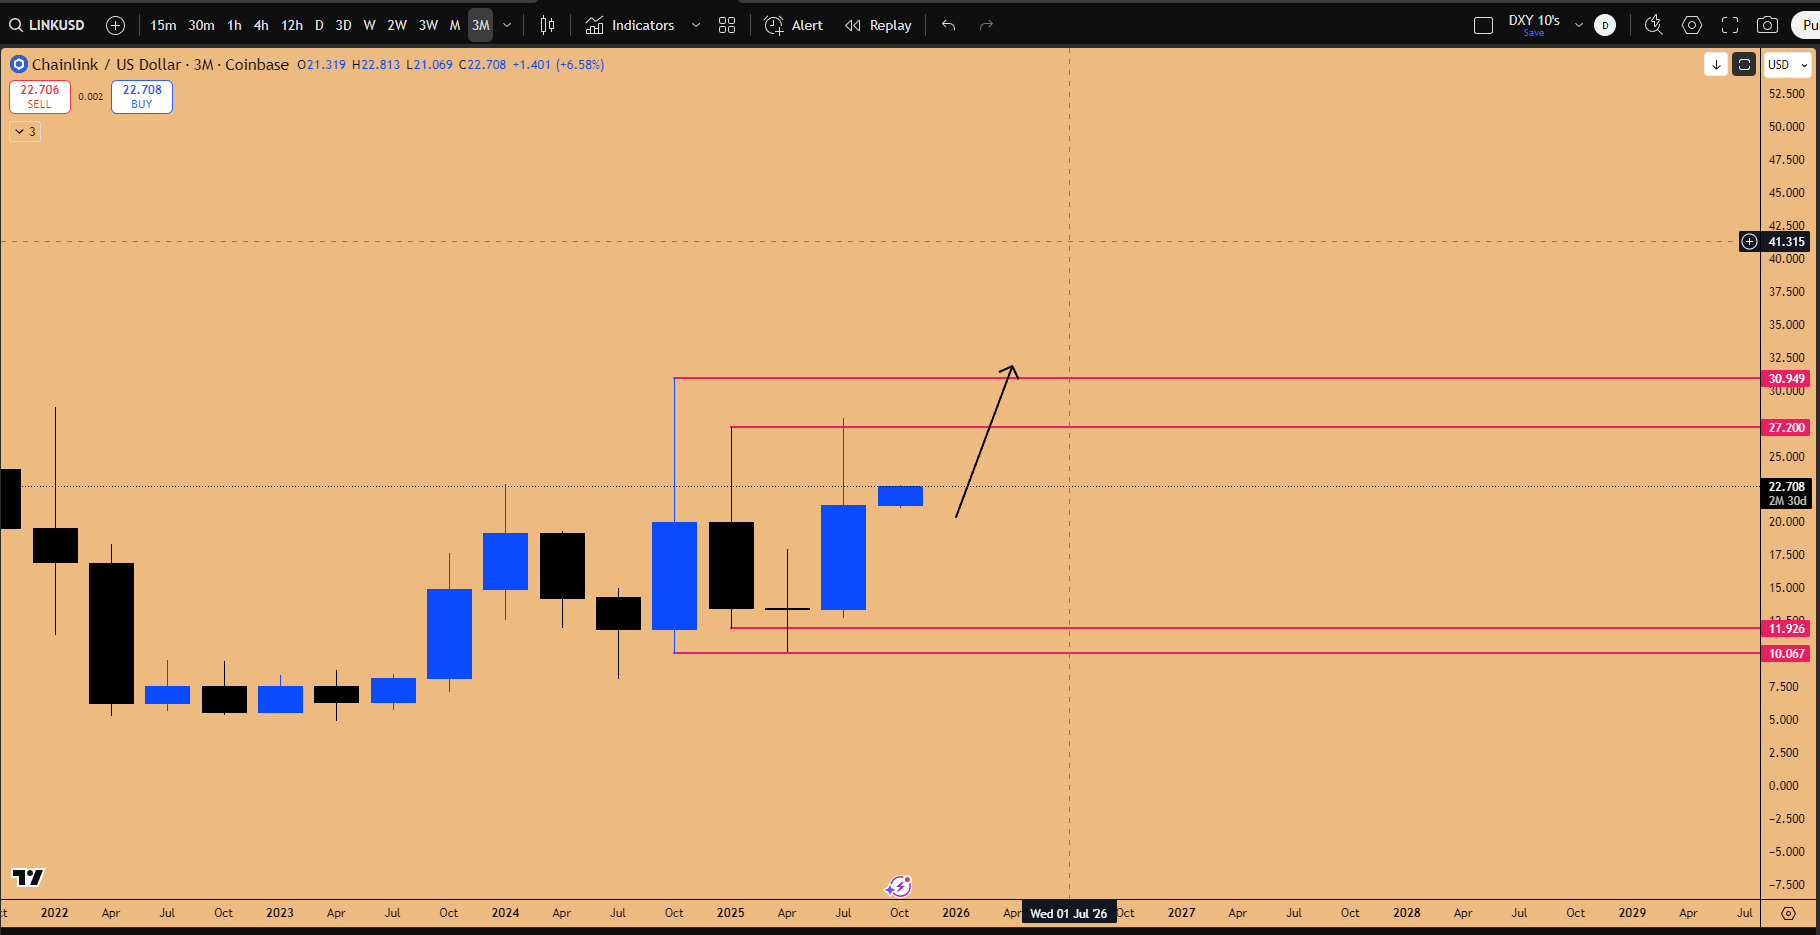
Figure 8: Inside Quarterly Candle Failure pattern in play for Link/USD, targeting 30.949$
Avalanche (AVAX): A spot position play based on an inside 8-month candle failure, which is confirmed. It is also confirming an inside 9-month candle failure, suggesting the next 9 months will see expansion. This is speculative, but if it plays out, it could render a 120% return.
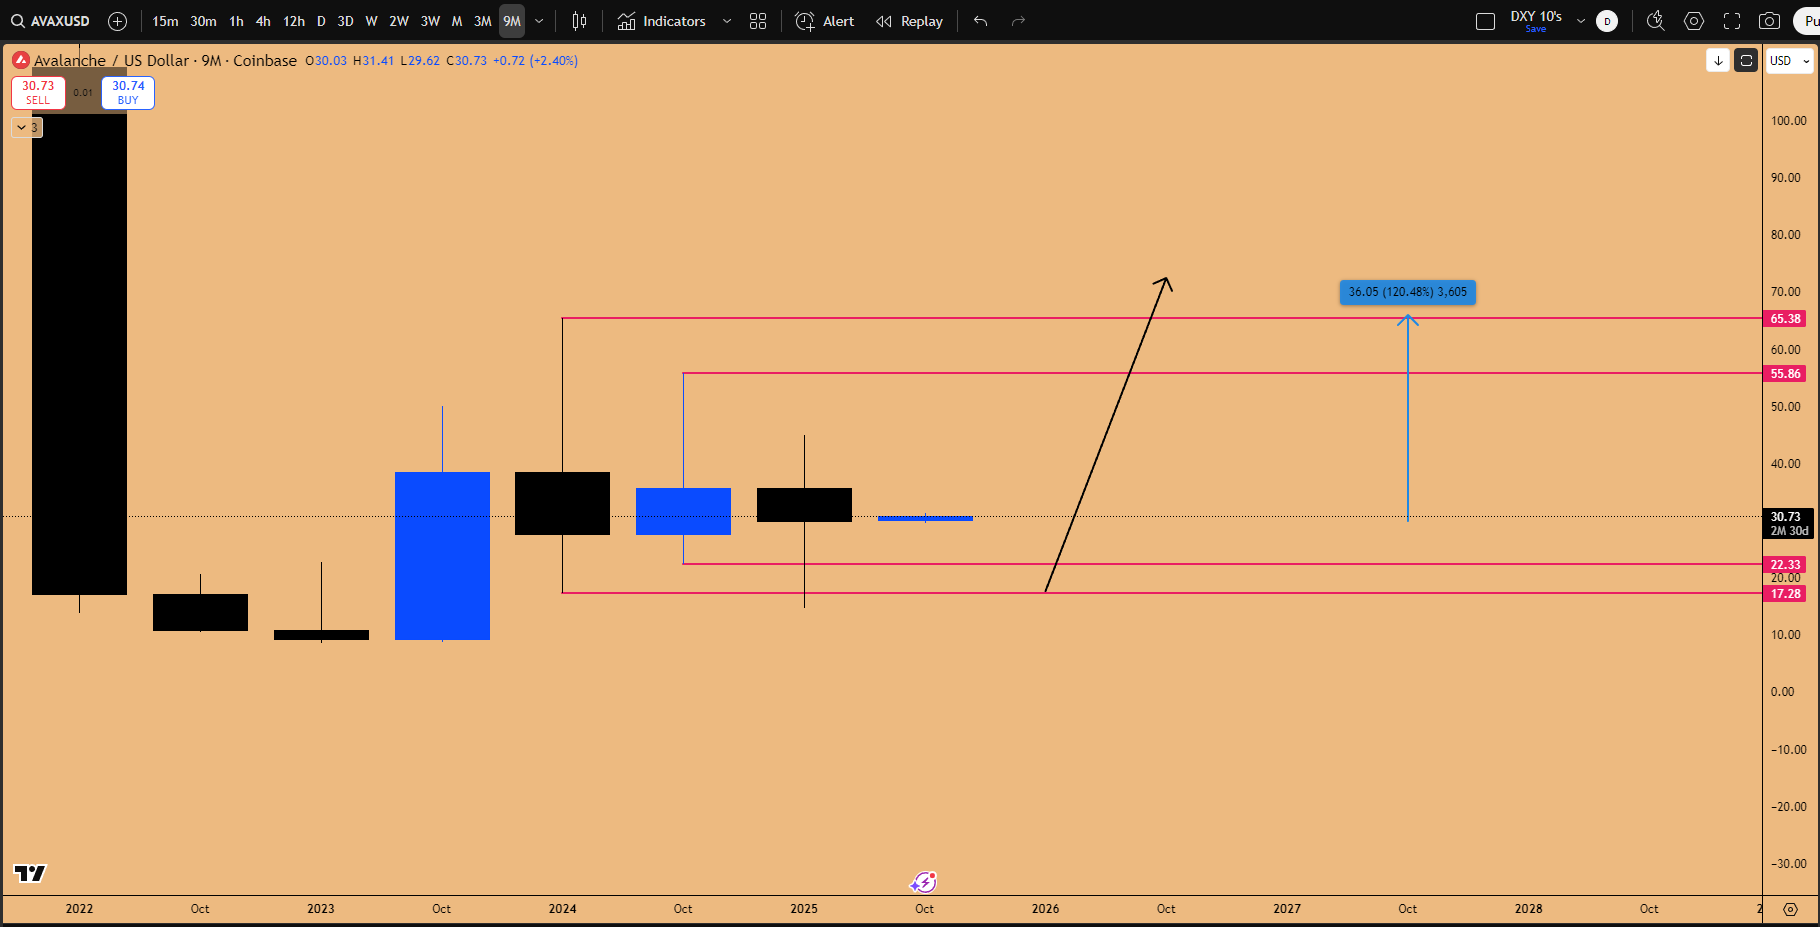
Figure 9: Inside 9-month Candle Failure pattern in effect for AVAX/USD, targeting 65.38$
SUI: SUI is forming a bullish ascending triangle. It is also showing an inside monthly candle failure and potentially an inside 3-week candle failure.
SUI Setup: Entry at $3.5. Stop loss below the daily bullish order block at 2.9$. Target all-time highs at $5.3765.
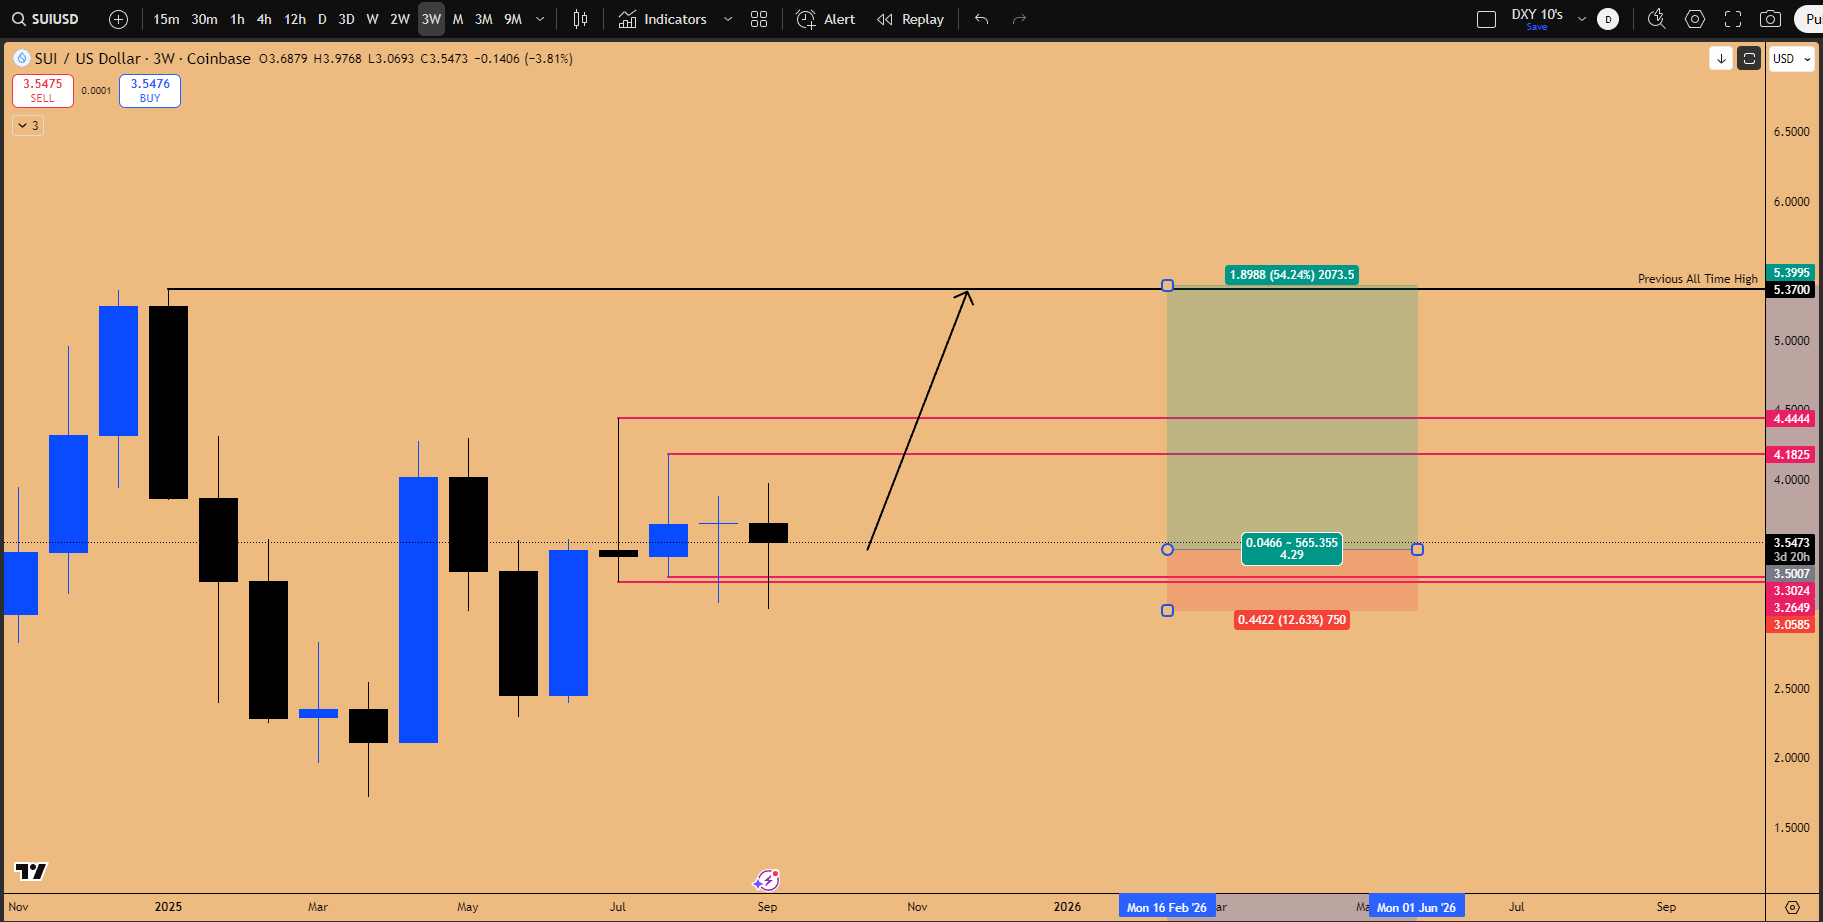
Figure 10: Inside 3-week Candle failure pattern triggered, Targeting New All Time Highs at $5.370.
Crypto Strategy: ETF Liquidity and Diversification
The main source of liquidity for crypto is the ETFs (IBIT and ETHA), not treasury companies. The reason ETFs are so powerful is because of the associated options chain, specifically Zero Days to Expiration (Zero-DTE) options volume. This allows large institutions to flow significant capital through option contracts, causing Bitcoin to behave like a traditional asset (e.g., NASDAQ).
Portfolio Diversification Strategy:
It is crucial to diversify capital within crypto by avoiding exposure to multiple assets exhibiting the exact same pattern.
Pattern Group 1 (Inside 3-Week Failure): XRP, XLM, SUI. Choose one.
Pattern Group 2 (Inside Monthly/ETH Structure): Ethereum, LINK. Choose one.
Standalone: Bitcoin.
🔱 The Commodity Supercycle: Gold and Silver
The environment of currency devaluation makes commodities, particularly Gold and Silver, prime beneficiaries. We are in a strong mega cycle for commodities.
Gold (XAU) Outlook and Projections
Gold analysis is based on the two-month chart, focusing on the double inside two-month candle pattern, indicating extreme consolidation. Historical analysis of this pattern since 1987 shows that breakouts yield at least a 15% to 18% return.
Current Status: Sitting at a 12% return.
Target 1: $4,000 (16% return).
Target 2 (Max Range): $4,085 (18% return).
Recent positioning in this consolidation (around 3345) yielded 134% returns on gold option calls, which were closed around 3700. However, the analysis suggests gold is not done and should reach at least 4100 before any significant pullback.
Analyzing Overbought Conditions and Riding the Bubble
The 3-month Relative Strength Index (RSI) is reaching extreme overbought levels. However, the RSI can remain overbought for extended periods during strong expansions. Historical rallies show the quarterly RSI can push to 93 or 95 before a pullback.
Gold tracks liquidity, and with liquidity being flushed into the system, gold will keep expanding. It is possible we are only in the middle of the expansion (e.g., RSI at 87), with several more quarters of upside while remaining overbought.
Strategy for Vertical Trends:
Do not try to front-run the top. It is far more profitable to long the bubble than to wait to short the burst. Missing out on the expansion (e.g., historical 70% rallies while overbought) means missing significant wealth creation.
Trail Invalidation Levels: Keep marking out previous quarterly lows. As long as these lows are not taken out, the bull run continues. Move the stop loss higher with each new quarterly expansion.
Exit Signal: Only exit when the nearest invalidation level (quarterly low) is broken. This will be the first warning sign that the vertical trend is in trouble.
Given the expectation of more liquidity, gold should keep performing well for the next 4-8 months.
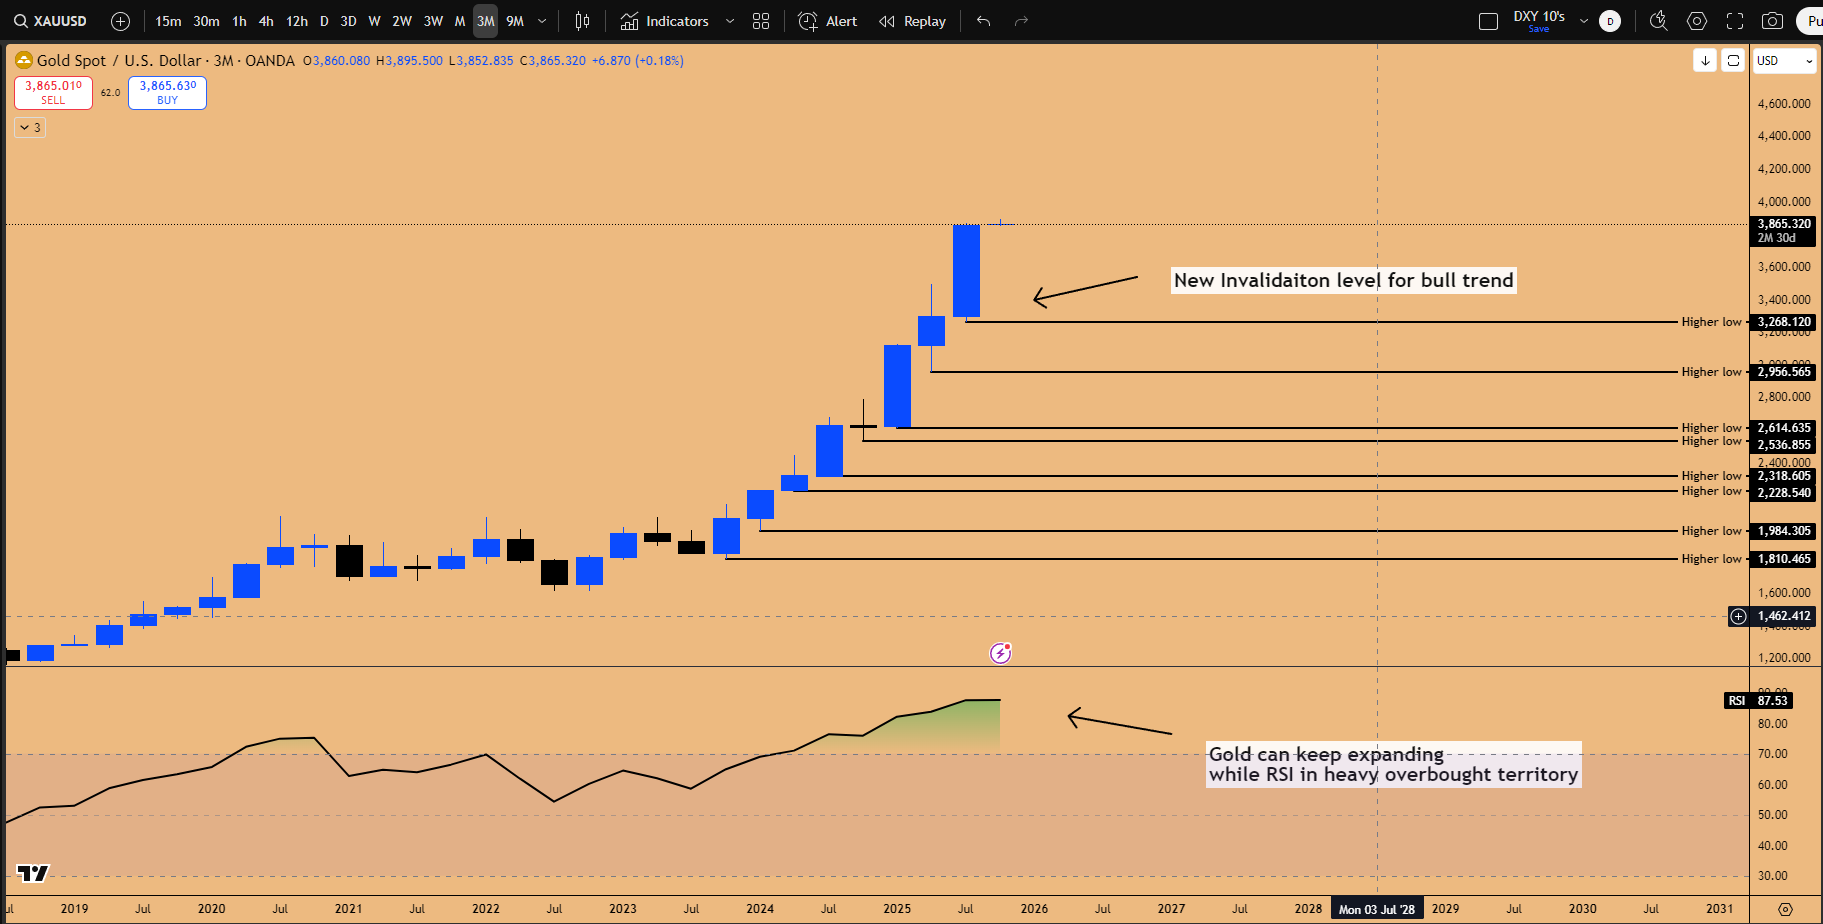
Figure 11: Gold Quarterly outlook, blow off top acceleration underway
Silver (XAG) and the Generational Breakout
Silver is currently attacking a generational high at $48. This represents a breakout from a consolidation dating back to 1980—45 years of consolidation. It is highly probable that this high will be taken out.
Strategy for Silver:
The market is currently in a verticality phase. The preferred strategy is to wait for a pullback when the new quarter opens to form the bottom wick.
Pullback Target Zone: The nearest daily support zone where it broke out from an inside daily candle, located at 44.4623 to 44.320.
Entry: If the price dips into this area, it is a dip-buying opportunity for re-entry.
Upside Target: New all-time highs, taking out 49.7634.
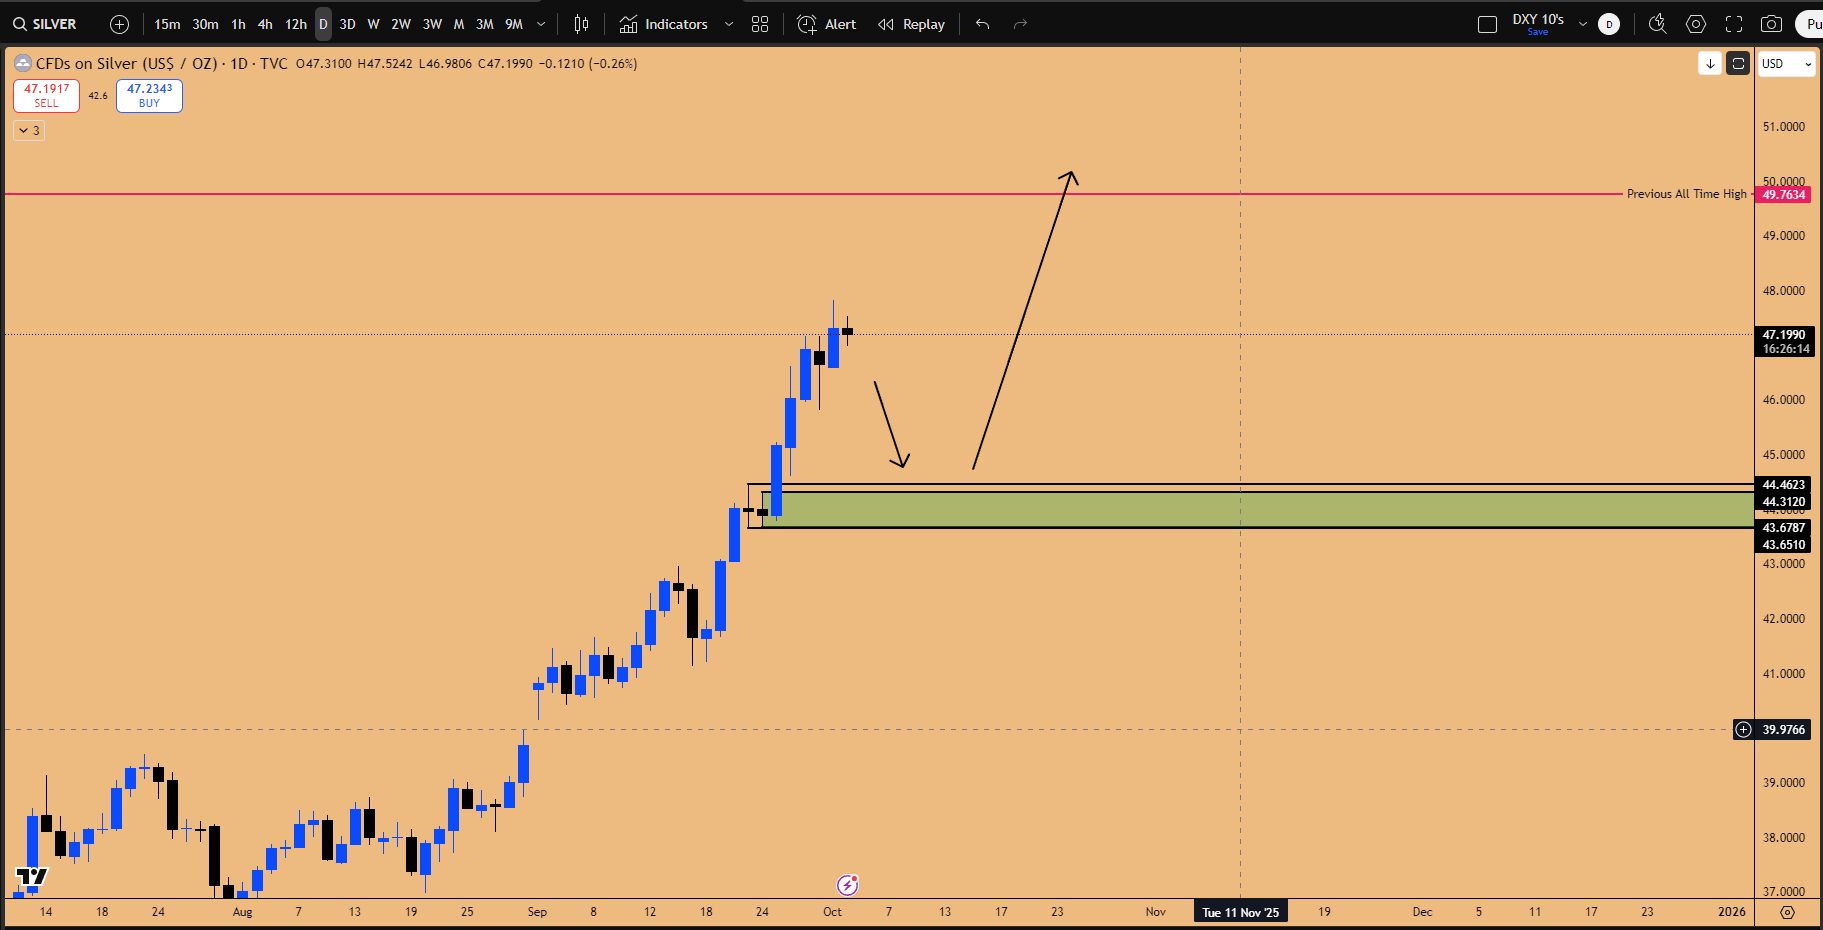
Figure 12: Silver Long setup to utilize if there is a pullback to daily support zone
Utilizing Commodity ETFs (SLV/GLD)
The Gold-Silver ratio (XAG ticker) is going down, indicating that Silver has been outperforming Gold over the past 3-5 months.
To gain exposure, utilize commodity ETFs and their options chains: GLD (SPDR Gold Shares) for Gold and SLV (iShares Silver Trust) for Silver.
US Equities: The AI Bubble and Q4 Blowoff Top
The US equity market, particularly NASDAQ and the S&P 500, is positioned for a strong Q4, driven by the AI narrative, strong earnings expectations, and favorable seasonality. The failure of the typical September pullback is a significant bullish signal.
Q4 Seasonality and the Blow-off Top Scenario
The month of September generally provides a seasonal pullback. However, this year, bearish seasonality has had no effect. When the market does not pull back during a seasonally weak period, it is an ultra bullish signal.
This suggests that the October earnings season is likely to be a blow-off top scenario, where the market accelerates significantly. This mirrors the pattern seen in July 2023, where the market rallied in a straight line following the March 2023 SVB crisis bottom into the earnings season, executed a blow-off top, and then underwent a pullback. The current positioning is aimed at capturing this blow-off top phase in October.
Microsoft (MSFT): The NASDAQ Driver
Microsoft is the single most important stock for the broader market, as NASDAQ’s behavior is dictated by MSFT. A detailed comparison shows a tight correlation: the 2021 top, the 2022 downturn, and the November 2022 bottom all align perfectly between MSFT and NASDAQ.
Current Divergence and Catch-Up:
Currently, NASDAQ is trading 4% above its July 2025 high, while Microsoft has not yet made a new all-time high. Based on cross-market correlation and the bullish setup in MSFT, Microsoft is expected to catch up to NASDAQ. This is favored over NASDAQ collapsing, due to strong Q4 seasonal tailwinds: rate cuts, upcoming earnings report on October 27th, and high consumer spending during the US holiday season.
🌳 Microsoft’s AI Walled Garden: Azure AI studio, Fabric, and Data Gravity
The fundamental reason for Microsoft’s strength is the rapid acceleration of revenue, particularly in the Intelligent Cloud segment (Azure services). This acceleration is driven by ChatGPT, which is hosted alongside other AI models ( Grok, Claude, Mistral AI and Llama etc.) on Azure AI studio. The expectation is for at least a 20% growth in cloud revenue, reaching about $120 billion in the upcoming report.
Microsoft’s AI strategy is brilliant, centered around Microsoft Fabric, launched two years ago. They are creating a “walled garden,” similar to the iOS framework, for any company wanting to use AI systems.
Microsoft’s advantage lies in its integrated tech stack. As the FY2025 report notes, AI creates ‘data gravity.’ To leverage AI, enterprises must consolidate data near the models, driving the adoption of Microsoft Fabric
The Role of Microsoft Fabric and Customer Stickiness
To utilize AI, data must be organized, cleaned, and governed. Microsoft Fabric is a unified analytics platform that integrates data warehousing, data engineering, real-time analytics, and business intelligence (Power BI) into a single environment, built on a unified data lake (OneLake).
This creates a powerful flywheel effect:
The AI Hook: Enterprises are drawn to Azure for access to leading models.
Data Migration: To use these models, they migrate data to Azure. Unified One Lake consolidates enterprise data in one location to be accessed by Azure AI Studio models.
Fabric Adoption: They adopt Fabric to manage the data for AI readiness.
Stickiness: Once the data estate is centralized in Fabric, data gravity takes hold. The enterprise naturally adopts other integrated Microsoft services (Security, Dynamics). The cost and complexity of leaving the ecosystem become prohibitive, leading to high customer retention (stickiness).
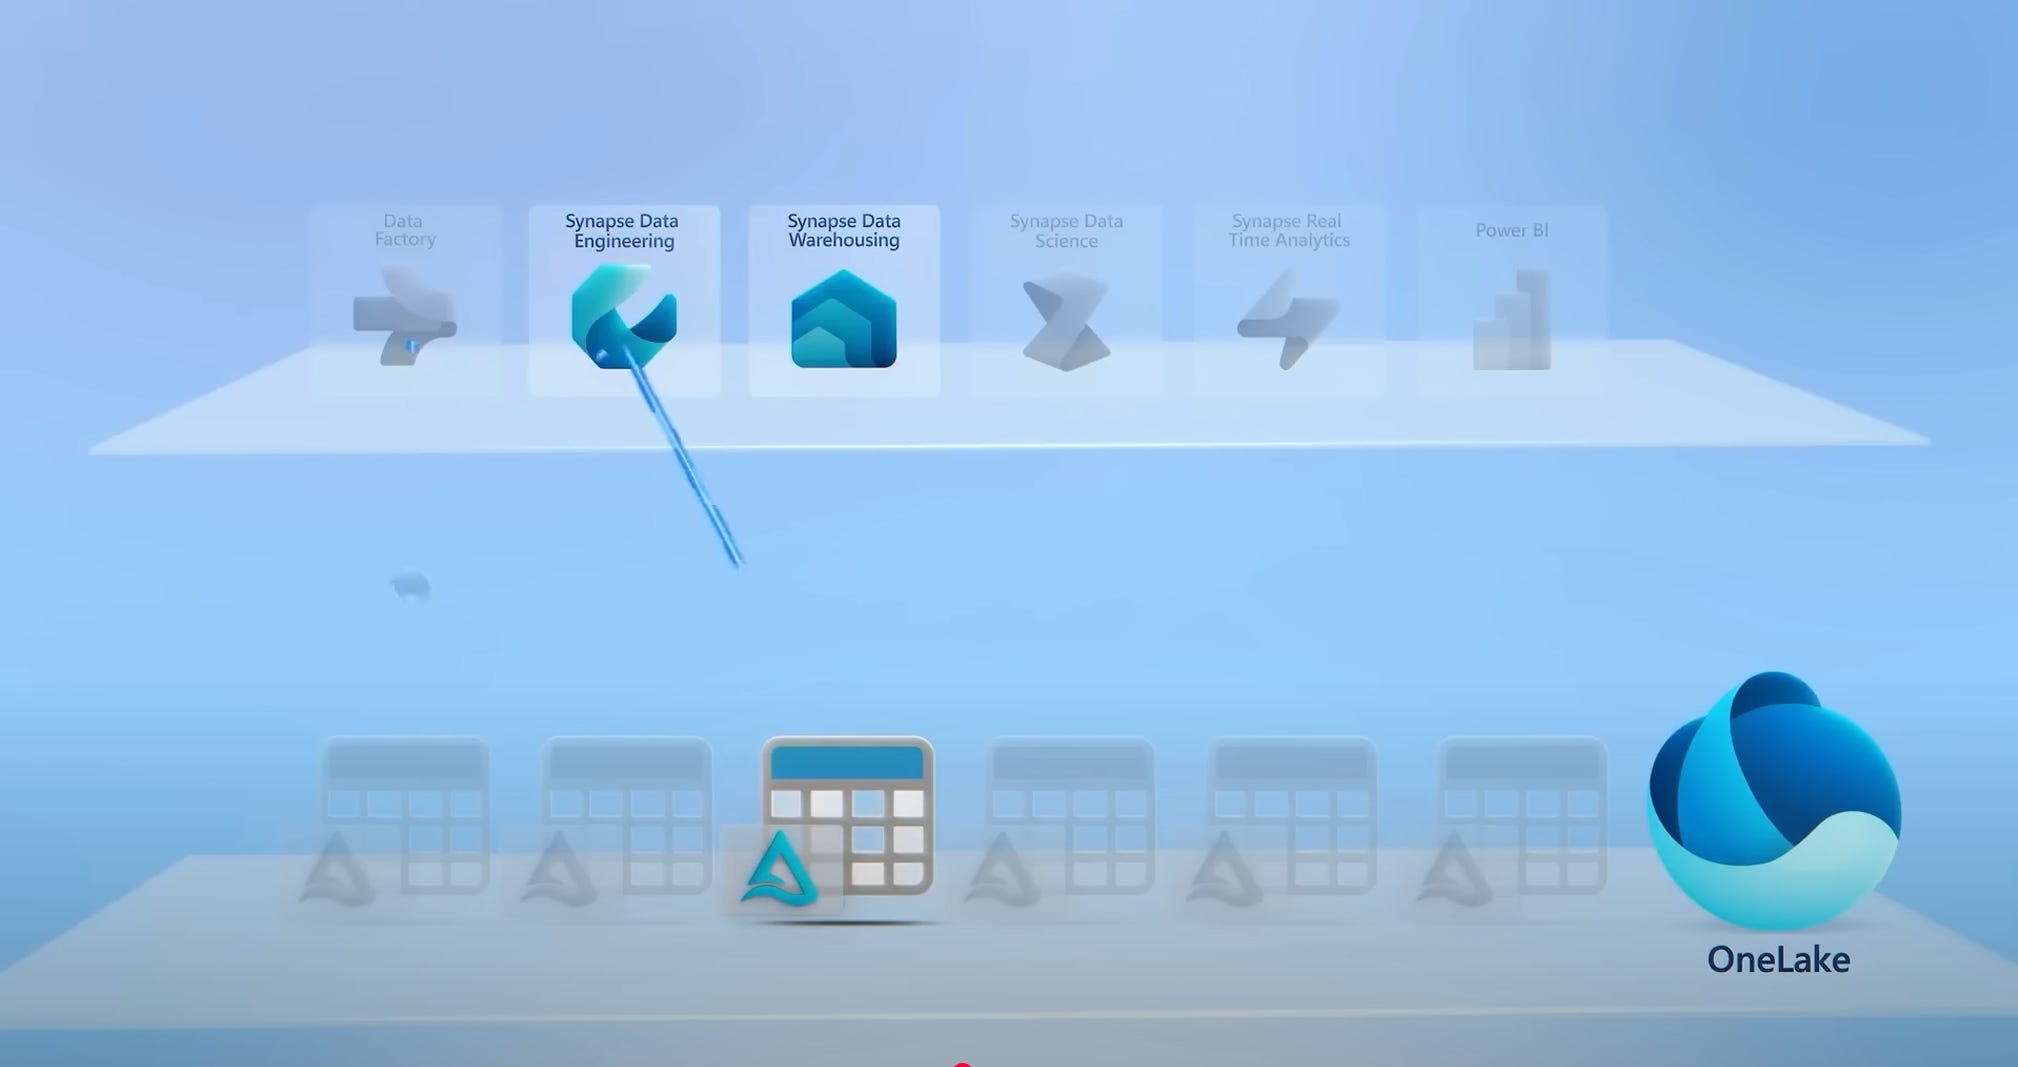
Figure 13: Entire organization having a single “OneDrive” but for all its corporate data (e.g. sales figures, website logs, or sensor data) that’s OneLake
Microsoft’s AI Business Model: The “Toll Road and the Tools”
Microsoft isn’t just selling AI models; they are building an indispensable, multi-layered ecosystem to capitalize on every aspect of the AI boom. Their business model can be broken down into two core pillars:
Becoming the “Switzerland of AI” Infrastructure (The Toll Road) This is their primary and most defensible strategy. Microsoft understands that while specific AI models may rise and fall in popularity, the one constant is the need for massive computational power. Their goal is to make Azure the default “toll road” where enterprises must go to run their AI workloads.
How they do it:
Model Agnosticism: While their partnership with OpenAI is deep, Azure’s AI Foundry isn’t exclusive. As noted earlier, they host models from Meta (Llama), xAI (Grok), Mistral, and others. This makes them a neutral platform. No matter which model an enterprise chooses, Microsoft collects the revenue for the underlying compute, storage, and networking.
Data Gravity: As we discussed, by pulling enterprise data into Microsoft Fabric and OneLake, they make Azure the most logical, cheapest, and fastest place to run AI. The data’s gravity holds the compute workloads in place.
Optimized Hardware: They are investing heavily in their own custom AI chips (like Maia) and partnering with NVIDIA to offer the best-in-class infrastructure, ensuring they are the most performant place to train and run models.
Selling High-Margin AI-Infused Software (The Tools) While the infrastructure play is about volume, this pillar is about high-margin, direct software revenue. Microsoft is embedding AI into its entire software portfolio, products that millions of enterprises already pay for.
How they do it:
Microsoft 365 Copilot: This is the flagship example. They are charging a significant per-user, per-month fee (e.g., $30) to add powerful AI capabilities into the tools employees use every day: Word, Excel, Teams, and Outlook. This is almost pure profit built on top of their existing Office monopoly.
Dynamics 365 and Security Copilot: They are replicating this model across their business applications and security platforms, turning their entire software suite into a premium, AI-powered offering.
In short, Microsoft wins whether you use their AI tools or someone else’s on their platform. They get you with either the software subscription or the consumption-based Azure revenue.
MSFT Outlook and Technical Strategy
This walled garden ensures sticky clients and future revenue streams through pay-as-you-go AI features. This is driving the AI bubble, and we are very early in this cycle, comparable to 1996-1997. The expectation is for Microsoft to undergo another 150% to 160% return over the next two years. The entire year of 2026 is expected to see super acceleration, potentially reaching $750 (another 60% upside from current levels).
Current Technical Setup and Positioning:
The current position focuses on the confirmed Inside Monthly Candle Failure. This setup mirrors the recent successful Oracle trade. Significant positions were taken using February and April expiration option calls, utilizing heavy leverage (described as 30% position size, equivalent to 100x leverage) due to high confidence.
Invalidation: The previous quarterly candle’s low (488$). If this is taken out, the position will be closed.
Target: Fibonacci extension target of $572.
Risk-Reward Ratio at entry: 7.38. This is an exceptionally high R:R for a swing long position (anything above 5 warrants heavy sizing).
Risk Management: The inside monthly failure is also an inside 3-week candle failure. As the trend progresses, stop losses should be trailed below the 3-week candle lows, which serve as key invalidation levels.
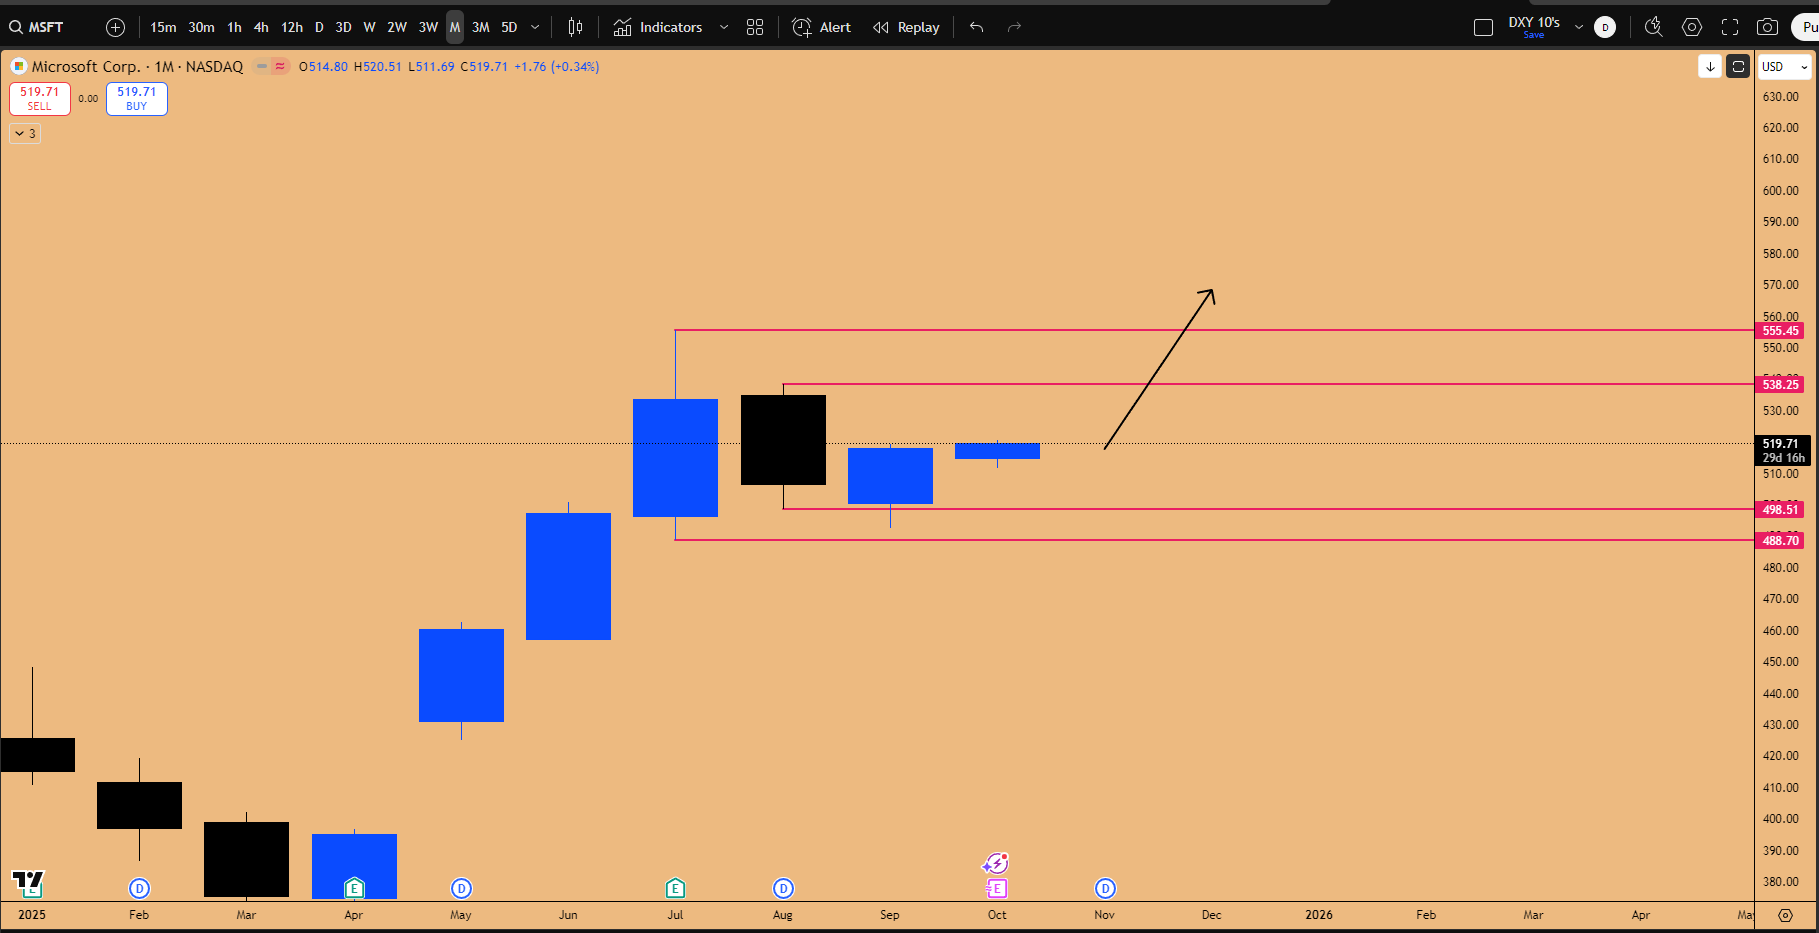
Figure 14: Inside Monthly Candle Failure targeting 572$ and beyond.
Tesla (TSLA): Q4 Seasonality and the AI Narrative
Tesla is a unique case, often overlooked, but possesses a special seasonality where it rallies significantly in the last quarter. For example, in October 2021, after three quarters of sideways movement, Tesla shot up vertically.
Technical Setup:
Tesla has closed the quarter with a staple Inside Quarterly Candle Failure (potentially a double inside quarterly candle failure). It is poised to break out of a massive consolidation, having gone sideways for two quarters. The monthly chart shows a close above the 2021 cycle high, signaling the start of a macro bullish trend breakout.
The AI Narrative:
Tesla is now being priced as an AI company, not just a car company. Future revenue is expected from AI products, including self-driving, robots, and the integration of Grok AI (xAI) into Tesla vehicles (reportedly already infused in new cars).
Targets and Strategy:
Target 1: $565.63 (1.272 Fib extension).
Target 2: $658 (1.618 Fib extension).
Potential Return: 48% return to the first target.
Long-Term (2026): Potential rally to $1,000.
Strategy: Buy physical stock and hold for the entirety of 2026. Options are not recommended due to high volatility and time decay.
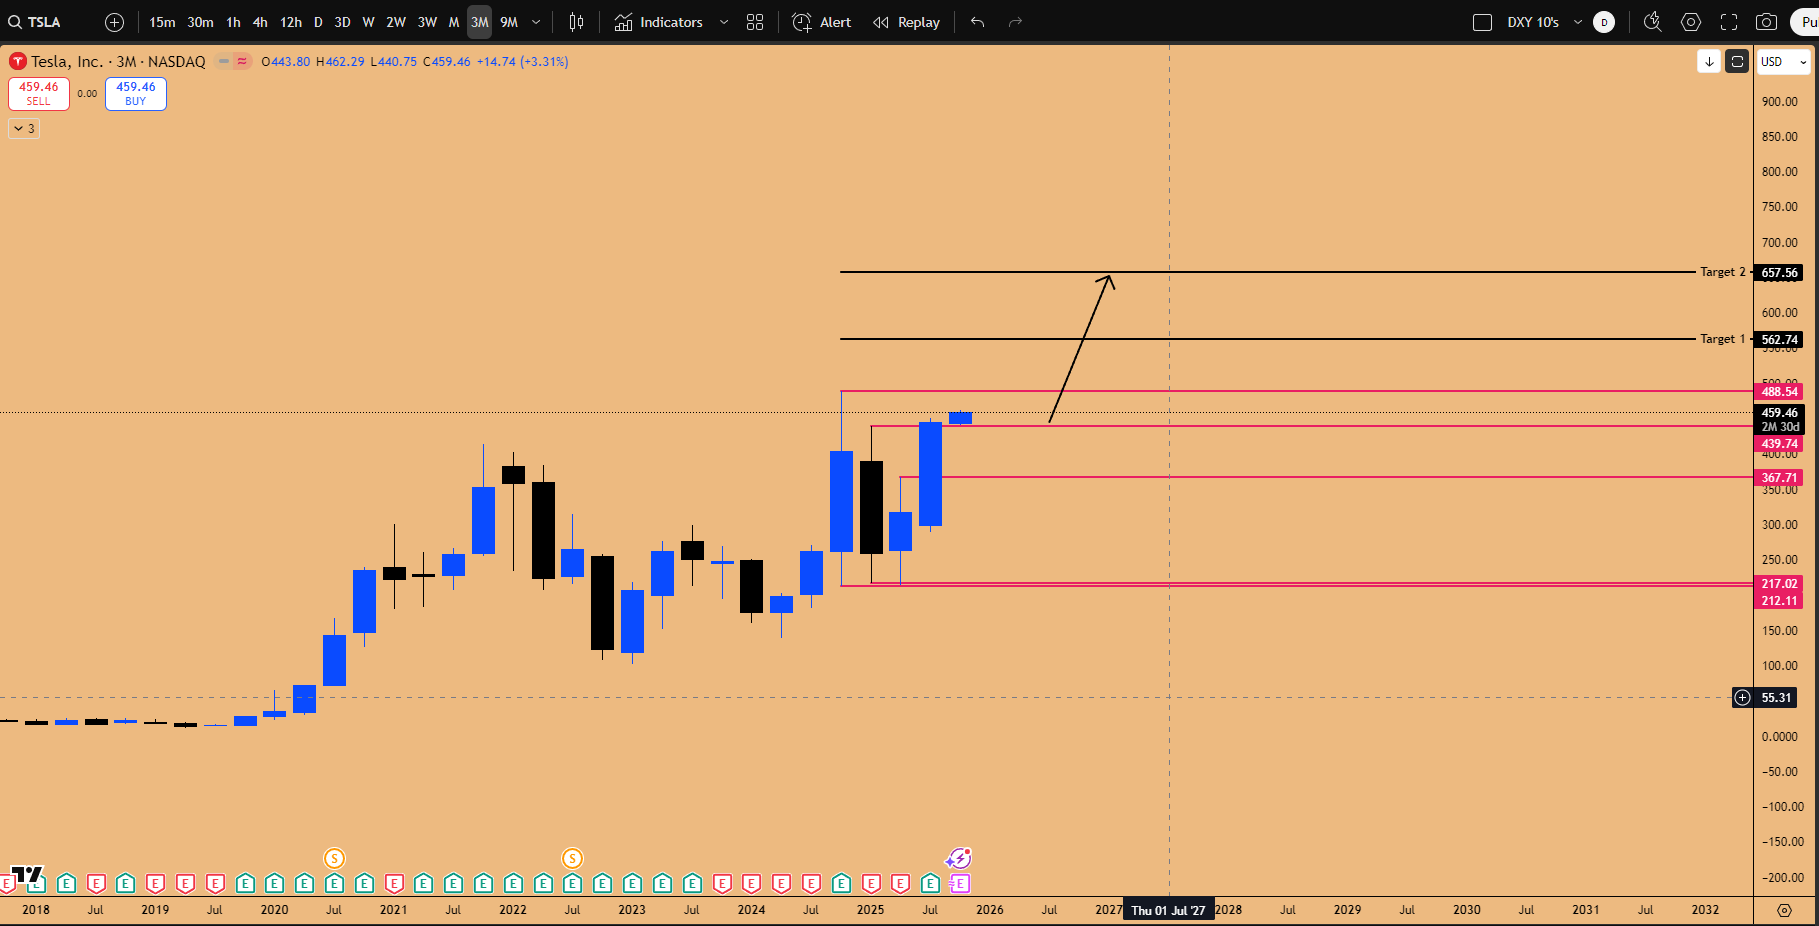
Figure 15: Inside Quarterly Candle Failure Breakout in motion. Targeting 657$.
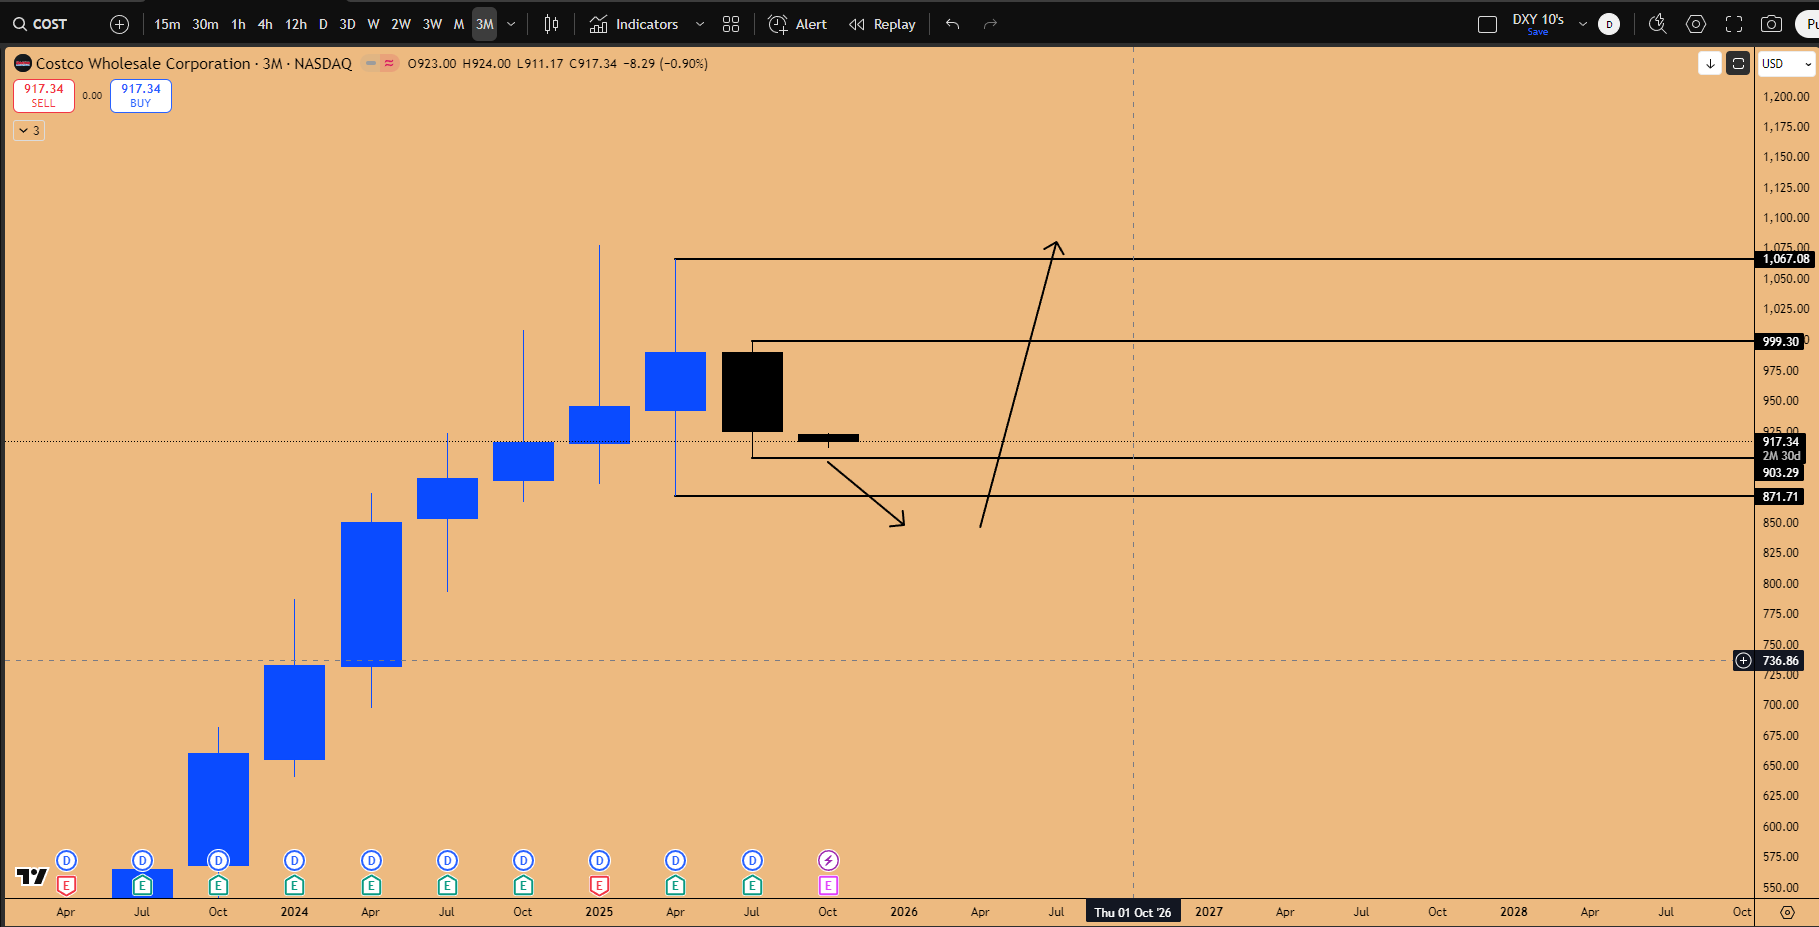
Analyzing Costco (COST) and Inflation
Costco presents a lucrative pattern: the Inside Quarterly Candle.
Strategy: Wait for the price to take out the low at $871, then start positioning long via option calls (6 months out expiration), targeting new all-time highs.
Thesis: Costco benefits directly from currency devaluation and inflation. As goods get more expensive for consumers, Costco sees higher revenue, driving the stock price higher. It is a safe bet for 2026.
Pullback Analysis: Historical pullbacks in Costco average around 20% to 22%. The current pullback is sitting at 19%. A strong support zone sits at $858.
Index Flows: Costco is ranked #12 in the NASDAQ 100 index weight, meaning it benefits from passive investment flows when NASDAQ rises. The current bearish quarter in Costco while NASDAQ rallied suggests money rotation, making this pullback a buying opportunity.

Figure 16: Inside 3-month pattern in formation. Downside liquidity sweep would create a massive long opportunity
Apple (AAPL) Strategy and Seasonality
Apple executed the previously identified setup—the double inside two-month candle—rocketing to new all-time highs. The move was supported by a record buyback program ($150 billion war chest).
Apple’s AI Strategy:
While perceived as slow in AI, Apple is developing its products for its loyal user base, expected in the first half of 2026. Apple’s strategy involves copying and improving existing technology. They did this with Intel’s hardware and are now doing it with AI via the Chat-GPT partnership. They will study the technology and then launch an in-house AI system exclusive to iOS users. This new model is expected to be housed on-device rather than the cloud, emphasizing privacy as a key marketing selling point.
Technicals and Seasonality:
Technicals: Double quarterly bullish engulfing, suggesting further expansion.
Seasonality: Apple performs very well in Q4 (November/December) due to high consumer spending during the holidays (Thanksgiving, Christmas, Black Friday) on iPhones, iPads, and MacBooks as gifts.
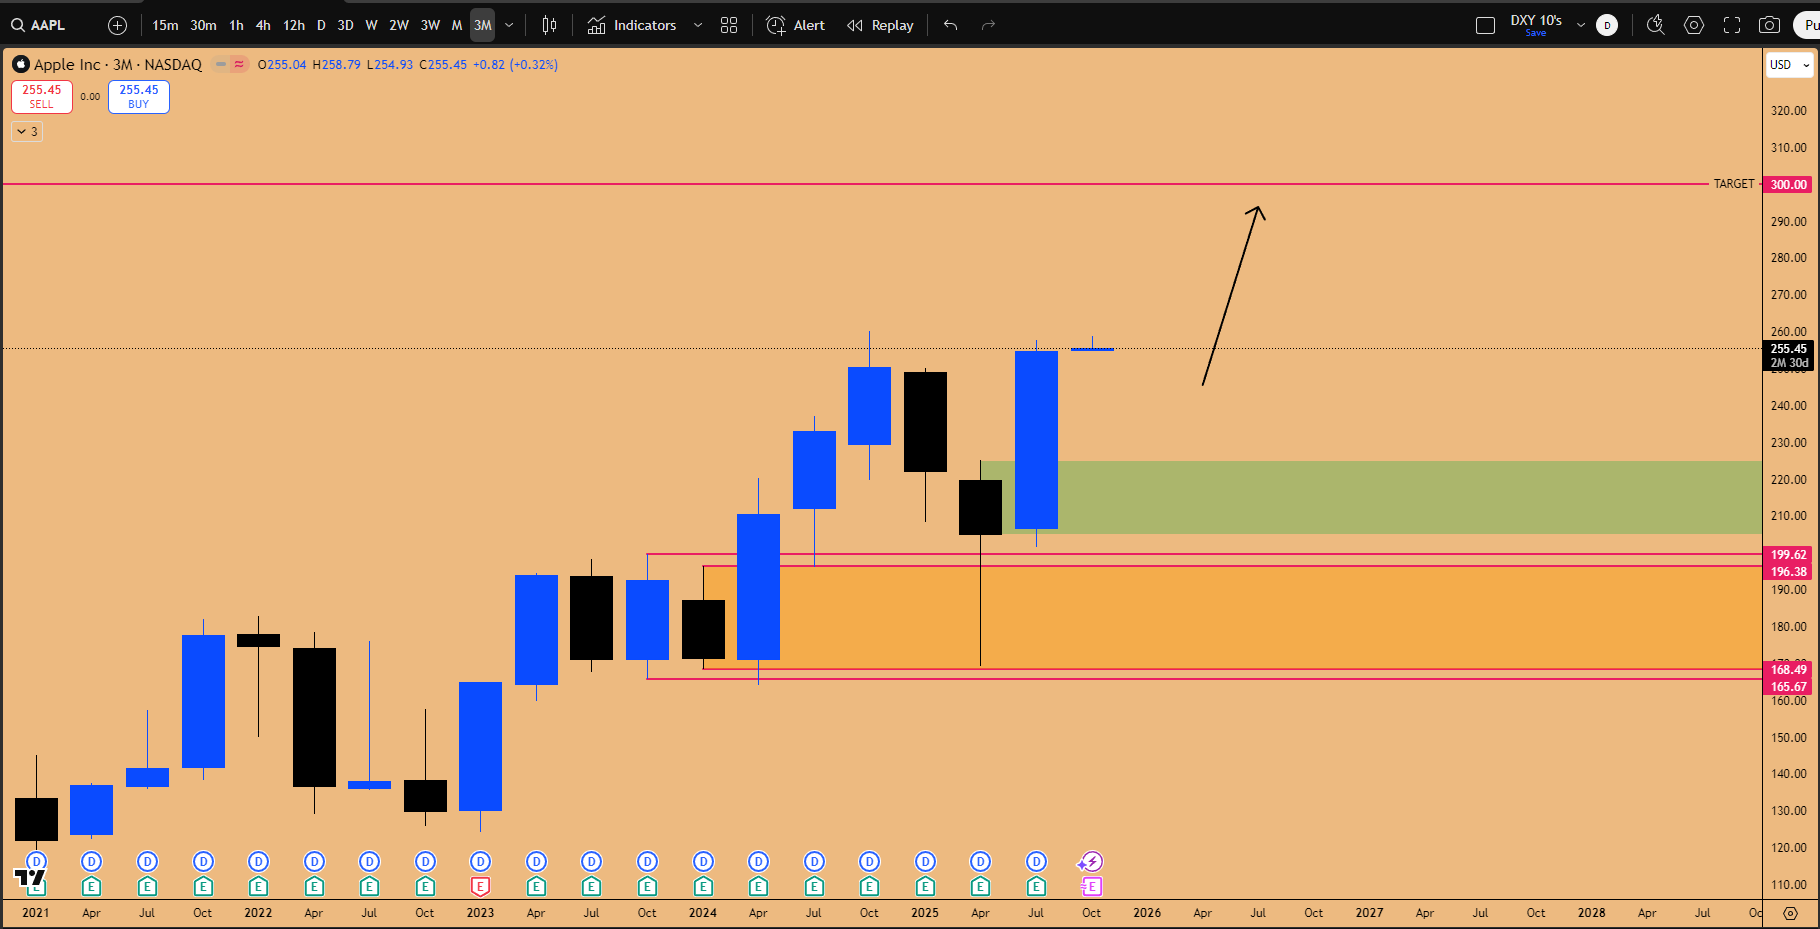
Figure 17: Expecting further expansion to 300$ in the coming quarter(s).
Netflix (NFLX) Setup and Other Equities
Lam Research (LRCX): This chip company shows extreme acceleration, similar to Gold. Anything that performed well this quarter should continue to do well; this chart should not be shorted.
Netflix (NFLX): The key timeframe for Netflix is the four-month chart. Since the May 2022 bottom, every four-month candle low has been defended.
Invalidation: The previous four-month low at $1,102 (cannot go below 1100).
Patterns: Inside quarterly candle and inside two-month candle patterns are in play.
Bearish Order Block: A bearish order block on the monthly chart suggests potential downside.8
Strategy: Anticipate a potential earnings gap down that takes out the inside two-month low ($1,144) but holds above the four-month low ($1,102), landing inside a bullish order block/daily support zone. This would be the drop to buy for Q1 2026 positioning (6-7 month expiration options).
Risk-Reward: 4.56.
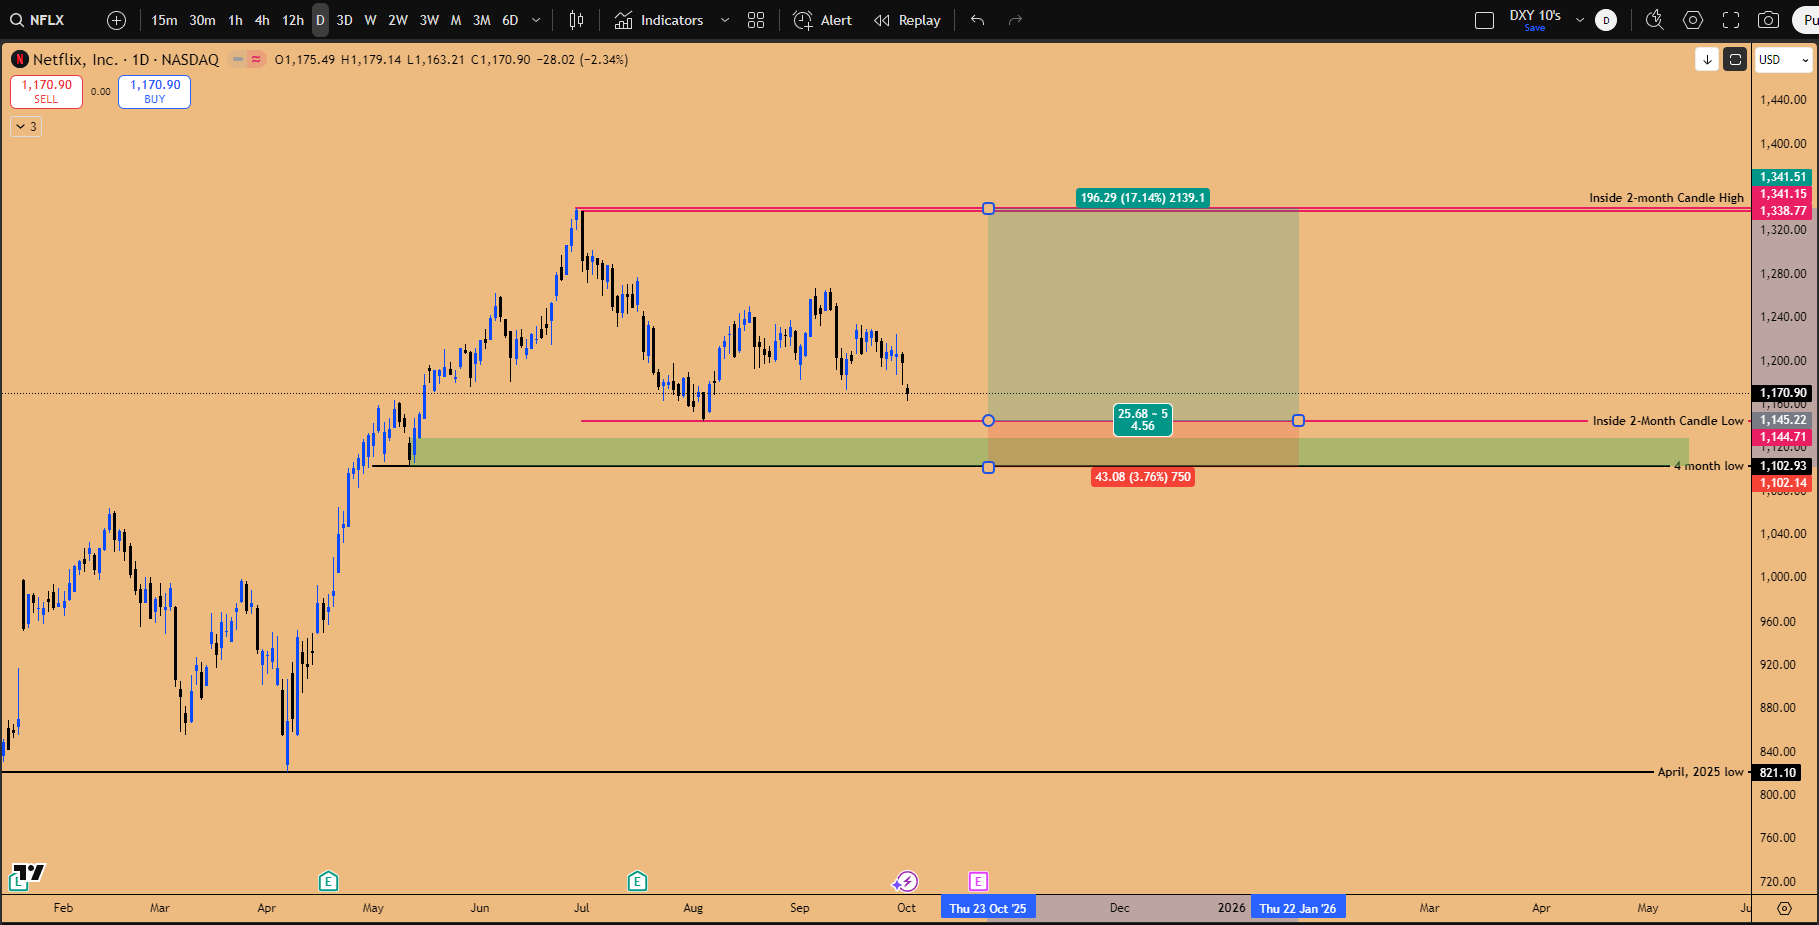
Figure 18: NFLX long setup in play for Q4, 2025.
🔭 Key Takeaways and Outlook
As we conclude this exhaustive quarterly outlook, the overarching theme is the dominance of macro liquidity and the accelerating trend of currency devaluation. This environment is creating significant tailwinds for risk-on assets, wealth preservation assets, and the burgeoning AI sector. The failure of bearish seasonality in September signals extreme underlying strength heading into Q4 2025.
The key opportunities lie in the catch-up trades and macro breakouts:
Bitcoin is expected to rally strongly in Q4, driven by the NASDAQ correlation and institutional flows via IBIT, provided the $105,100 quarterly low holds.
Ethereum presents a high-probability breakout from a 3.5-year range, targeting $7,000, supported by BNB’s leading performance and the Inside Monthly Candle setup (RR 4.63).
Microsoft remains the cornerstone of the equity rally, with its AI “walled garden” strategy (Fabric/OneLake) securing long-term revenue acceleration and driving the NASDAQ toward a potential blowoff top. The MSFT setup offers an exceptional 7.38 R:R.
Gold and Silver are in a supercycle, reflecting the devaluation of fiat currencies, with Gold targeting $4,085 and Silver poised to break 45-year highs.
Tesla offers significant upside (40-50%) based on the Inside Quarterly Candle Failure and strong Q4 seasonality.
If you’re finding value in our research, we’d like to extend a personal invitation to explore the next level of market analysis within our Speculators Trading community. Our Discord server is a collaborative space dedicated to helping traders optimize capital allocation. Inside, you’ll gain access to our real-time Trading-floor commentary, high-conviction technical setups, proprietary educational resources, and strategic bi-weekly livestreams. We invite you to experience these premium resources firsthand and see how they can enhance your portfolio management. Join us with a 14-day free trial (120 USD/month after trial is over) you can cancel anytime.
As we head into the October earnings season and anticipate further monetary easing, the strategy focuses on utilizing high-timeframe technical patterns (Inside Candle Failures, 3-week supports) and managing risk through clearly defined invalidation levels (quarterly and monthly lows). The environment favors longing the bubble rather than attempting to time the top.
What’s your take on these setups and the macro environment? Share in the comments and let’s discuss strategies. Subscribe for more market breakdowns!
Disclaimer: This isn’t financial advice – just market musings from the charts. Always do your own research.
If you enjoyed this deep dive, please share it with fellow traders!
Seriously good stuff 👏
Loved it!
Thank You for sharing this knowledge 🙏