

Riding the 2025 Market Melt-Up: Strategies to Surf Bitcoin, Equities, and Beyond
Incoming Melt up on BTCUSD, COIN, NAS100, SPX500 and AAPL

Publication Date: July 7, 2025
This comprehensive analysis, derived from the Weekly Livestream aired on July 6, 2025, provides an in-depth examination of current market dynamics, trading strategies, and cross-asset correlations tailored for hedge fund managers and other financially sophisticated investors. The report focuses on Bitcoin (BTC) as a primary case study, extending to Ethereum, U.S. equities, indices, forex, and gold. It emphasizes proprietary technical patterns, such as the monthly open strategy and the rainbow pattern, alongside macroeconomic catalysts like U.S. policy developments, seasonality trends, and the recently passed Invest in America Act. By integrating cross-market correlations, this report offers actionable insights for strategic capital allocation, risk management, and portfolio optimization in a dynamic market environment characterized by a potential melt-up phase.
🔍 Introduction to Market Context
The onset of July 2025 marks a critical inflection point for global financial markets, driven by the new monthly and quarterly opens that set the tone for price action across multiple asset classes. These opens, representing the starting price of a new trading period, are pivotal for traders as they often dictate short-term momentum and institutional behavior. This report centers on Bitcoin, a leading cryptocurrency increasingly correlated with traditional markets, while extending the analysis to Ethereum, U.S. equities (e.g., Apple, Nvidia), indices (S&P 500, Nasdaq, Dow Jones, Nikkei), forex (USD/JPY, EUR/USD, GBP/USD), and gold. The discussion integrates technical analysis with macroeconomic factors, including U.S. policy shifts under President Trump, bullish seasonality in July, and legislative developments like the GENIUS Act and Invest in America Act, which are injecting liquidity and reshaping market dynamics. Cross-market correlations, particularly between Bitcoin and Nasdaq, guide strategic decisions, ensuring investors capitalize on opportunities while managing risks in a potentially euphoric market environment.
🧠 Educational Segment : Bitcoin Price Action and Monthly Open Strategy
Understanding the Monthly Open Strategy
The monthly open strategy is a technical trading framework that leverages the opening price of a new monthly candle visualized as a yellow dotted line on a daily chart to assess market direction. This level acts as a critical support or resistance zone, helping traders determine whether the market is establishing a bullish or bearish bias early in the month. When prices move downward immediately after the monthly open, it often signals that the market is forming the lower wick of the monthly candle, potentially setting the month’s low. Traders aim to identify this low to enter long positions and capture subsequent upside momentum. The strategy relies on timeframes, such as weekly or two-week charts, to pinpoint high-probability entry triggers, often confirmed by patterns like the inside candle or Swing Failure Pattern (SFP).
Key Mechanics:
Opens Indicator: A tool that marks the monthly open on the daily chart, providing a reference for price behavior.
Price Behavior: Early downside action suggests the market is carving the monthly low, often driven by institutional liquidity sweeps (e.g., stop-loss hunting), followed by a reversal.
Entry Triggers: Patterns like the inside two-week candle (where the current candle’s range is contained within the prior candle’s) or a daily SFP (a reversal pattern where price briefly breaches a key level before reversing) confirm entry points.
Institutional Context: Large players, such as market makers or institutional investors, often manipulate price to clear stop losses before reversing, making the monthly open a focal point for such activity.
This strategy is particularly effective in volatile markets like cryptocurrencies, where institutional participation is increasing, and it offers a structured approach to navigating short-term price fluctuations.
➡️ Applying the Strategy to Bitcoin
Historical Case Study: April 2025
The monthly open strategy’s efficacy was evident in Bitcoin’s price action during April 2025, providing a clear example of its application:
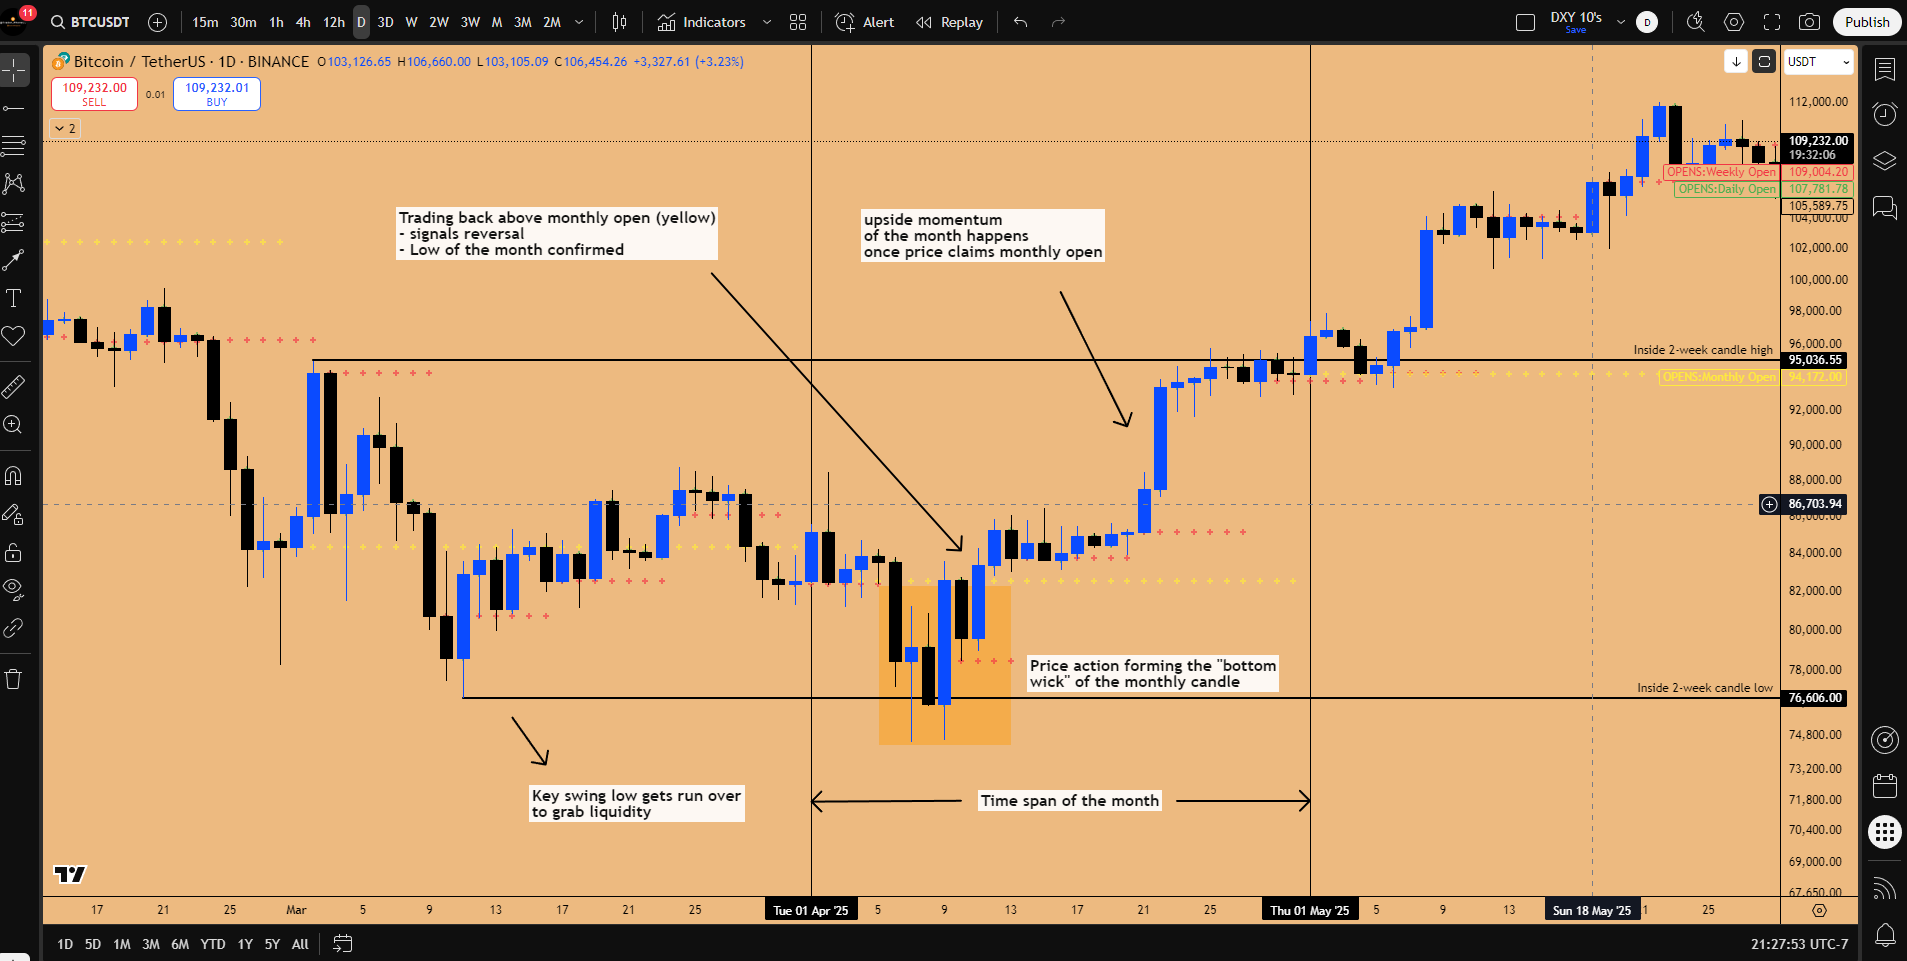
Monthly Open and Initial Action: The April candle opened at $82,537 on April 1st, 2025 . Bitcoin initially failed to break the high of an inside two-week candle, instead moving lower in a significant flush, targeting downside liquidity of $76,606 (stop losses below key levels).
Hourly Timeframe Dynamics: On hourly charts, prices tested the closely aligned monthly and weekly opens, consolidating sideways before collapsing to a low of $76,600. This formed a Daily SFP (swing failure pattern), where price briefly breached the low before reversing, signaling a potential long entry.
Reversal Confirmation: The SFP indicated the downside move likely formed the monthly candle’s lower wick. A subsequent bullish engulfing candle a large upward candle that engulfs the prior candle’s range established a daily bullish order block (a consolidation zone signaling institutional buying). This confirmed a bottom, targeting $94,422, the high of the inside two-week candle.
Institutional Behavior: Institutional investors swept long positions by driving prices below the monthly open, clearing stop losses, then reversed the market upward. The break above $82,537 confirmed the monthly bottom, as prices expanded upward.
Outcome and Trade Execution: By April 9, Bitcoin spent the first week forming the low, then consolidated sideways before breaking out to hit $94,422 by month-end. A long entry at the SFP, with a stop loss below the bullish order block, offered a risk-free trade with a high-probability target.

Figure 1: BTCUSD long setup triggered by reclaiming Monthly open, Carving the low of the Month.
This case illustrates how the monthly open strategy leverages institutional dynamics to identify high-probability setups, achieving a 90-100% strike rate when combined with patterns like the inside two-week candle failure and a break above the monthly open. The strategy’s success lies in its ability to align technical signals with institutional liquidity management.
₿ Current Bitcoin Price Action (July 2025)
As of July 6, 2025, Bitcoin trades above the June monthly open of $107,164, supported by a robust technical setup and macroeconomic catalysts. Key observations include:
Support Zone: A bullish engulfing candle has formed a strong daily support zone at $107,164, reinforcing bullish momentum. This level is critical, as a break below $105,301 would invalidate the bullish thesis, potentially driving prices to $98,278. However, the speaker considers this bearish scenario unlikely given current market strength.
Resistance Testing: Bitcoin is testing a high-timeframe support/resistance (SR) level at $108,353, which has been tested multiple times since December 2024. Repeated tests weaken resistance, increasing the likelihood of a breakout, especially as institutional interest in cryptocurrencies grows.
Seasonality and Cross-Market Correlation: July is historically a bullish month for equities, particularly the Nasdaq, which has gained 8% in the past month while Bitcoin remained sideways. Bitcoin’s price action is closely correlated with Nasdaq, suggesting that a Nasdaq rally to 24,000 (7-8% upside) will drive Bitcoin toward its upside targets. This correlation reflects Bitcoin’s maturation as a mainstream asset, moving in tandem with risk-on markets.
Upside Targets: The primary targets are:
$115,000: A minor target achievable within one to two weeks, driven by short-term momentum.
$118,776: The realistic target for July, aligning with 1.272 fib extension target zone.
$130,000: A long-term target, deemed unfeasible for July due to time constraints and potential resistances along the way.
A breakout to $118,000 may face heavy resistance, potentially leading to a pullback to $98,000 or $93,000 in August or September if Nasdaq tops out, reflecting potential profit-taking or broader market corrections going into August.
Technical Patterns: Bitcoin is looking to breakout from inside two-week and Inside monthly candle, indicating consolidation followed by a breakout. As long as prices remain above $107,000, the bullish setup holds, with the breakout likely post-holiday weekend.
Trade Setup: A long position above the monthly and weekly opens offers a favorable risk-reward ratio:
Target $118,000: 2.9 risk-reward ratio, capturing the primary upside.
Target $115,000: 1.89 risk-reward ratio, suitable for shorter-term trades.
Stop Loss: Below $105,000, below which the bullish thesis is invalidated, protecting against significant downside.

Figure 2: Bitcoin’s Long setup for Month of July, 2025.

Strategic Implications: Bitcoin’s current setup favors long positions, leveraging the monthly open strategy and Nasdaq’s bullish seasonality. Traders should monitor the $105,301 support and $108,837 resistance for breakout confirmation, with risk management centered on the defined stop loss. The correlation with Nasdaq underscores the importance of tracking broader equity markets to anticipate Bitcoin’s moves, particularly in a melt-up environment driven by institutional capital flows.
🌈 The Rainbow Pattern and The dance of the Heavyweights
Introducing the Rainbow Pattern
The rainbow pattern is a proprietary technical indicator developed through extensive market observation, signaling extreme price consolidation and an impending explosive move. It occurs when daily, weekly, and monthly opens align within a narrow price range, creating a visually distinct “rainbow” of stacked levels (e.g., daily in green, weekly in red, monthly in yellow). This compression reflects institutional accumulation, where large players build positions during low volatility, preparing for a significant breakout. The pattern has a 70% probability of breaking to the upside, though downside moves are possible, depending on broader market conditions and technical signals.
Key Characteristics:
Alignment: Daily, weekly, and monthly opens converge tightly, often within a few percentage points, indicating minimal price movement.
Consolidation: Reflects a period of extreme market compression, typically driven by institutional accumulation or profit-taking.
Breakout Signal: A move above the nearest swing high triggers a long position, while a break below the nearest swing low signals a short. The breakout often leads to rapid price expansion due to accumulated momentum.
Challenges: The pattern is difficult to back-test, as S/R levels fade into the chart after expansion, requiring real-time identification. Traders must train their eyes to spot these levels as they form, using tools like the opens indicator.

Figure 3: Rainbow pattern in formation on BTCUSD

Figure 4: Explosive Breakout registered in BTCUSD shortly after spotting Rainbow Pattern


The rainbow pattern’s potency lies in its ability to highlight moments of market indecision that precede significant moves, making it a powerful tool for anticipating institutional-driven breakouts.
🕰️ Historical Example: Nasdaq’s dance around Rainbow Pattern (November 2024)
In November 2024, Nasdaq’s rainbow pattern during the U.S. presidential election provided a clear historical precedent, illustrating its predictive power:
Context: Following a crash from 20,600 to 19,900, Nasdaq entered extreme consolidation for three to four days, with daily, weekly, and monthly opens tightly stacked. This occurred amid uncertainty surrounding the election outcome, as markets awaited clarity on policy implications.
Breakout: On November 5, 2024, post-election, Nasdaq broke above the stacked opens and after breaching the nearest swing high, triggering a long signal. A long entry with a stop loss below the monthly open captured the explosive upside, as markets reacted positively to the election results and anticipated pro-growth policies.
Performance: The position performed strongly through November, with a brief flush (temporary downside) around November 15, followed by a recovery as the weekly open held as support. By December 2, 2024, Nasdaq reached new all-time highs, demonstrating the pattern’s ability to forecast significant moves.
Insight: The rainbow pattern’s effectiveness is most apparent in real-time, as the stacked levels blend into the chart when zoomed out. This underscores the need for active monitoring and quick decision-making to capitalize on the breakout.

Figure 5: Rainbow Pattern spotted in NAS100 ahead of US presidential election on November 5th, 2024.
Figure 6: Staggering 800 point rally triggered (4% rally) from Rainbow Pattern


This example highlights how the rainbow pattern can signal high-probability trades in volatile, news-driven environments, particularly when aligned with macroeconomic catalysts.
✨ Rainbow Pattern in Bitcoin and Ethereum (July 2025)
Bitcoin
Bitcoin’s current price action in July 2025 exhibits a clear rainbow pattern, with multiple SR levels converging:
Support Levels: The pattern includes the weekly open, daily open, monthly open ($107,164), and the prior month’s open ($104,646), all clustered around $105,000-$107,164. Prices tested these levels, bounced upward, and broke above, signaling strong institutional accumulation during this consolidation phase.
Momentum Catalyst: Market momentum typically surges at the start of a new month or quarter, as institutions reposition after consolidating in the final weeks of a quarterly candle, often forming an upper wick. This dynamic aligns with the rainbow pattern’s breakout potential, as the compression releases pent-up energy.
Outlook: Following the U.S. holiday weekend (July 4, 2025), Bitcoin is poised for a strong move, likely targeting $115,000 within one to two weeks and $118,000 by month-end. The Nasdaq’s bullish seasonality, driven by historical July strength, reinforces this outlook, as Bitcoin’s correlation with equities amplifies its upside potential.

Figure 7: Weaker version of Rainbow pattern spotted in BTCUSD for July, 2025
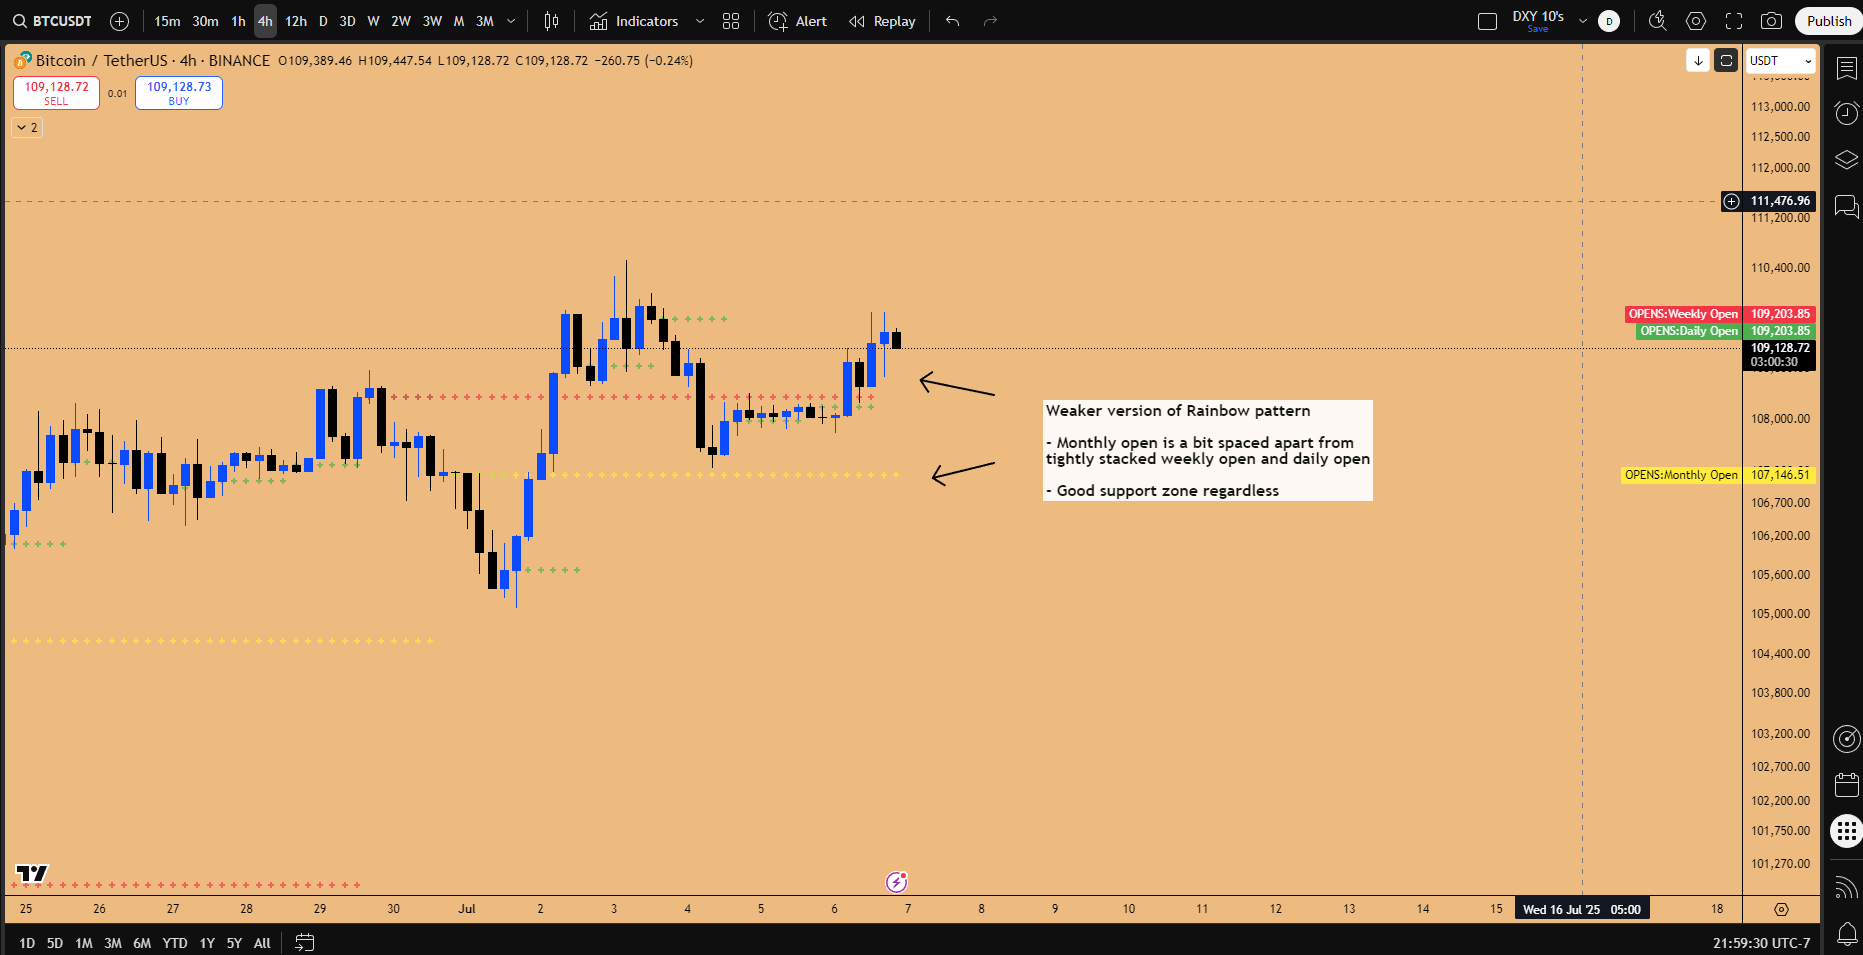
Contextual Detail: The rainbow pattern’s formation in Bitcoin reflects a maturing market, where institutional participation mirrors that of equities. The $105,000-$107,164 zone has been tested multiple times, indicating robust support, as institutions defend these levels to accumulate positions. The post-holiday volume surge, combined with Nasdaq’s momentum, positions Bitcoin for a breakout, making it a high-priority trade for July.
Ethereum
Ethereum mirrors Bitcoin’s setup, with a rainbow pattern and additional technical confirmation:
Levels: The monthly open ($2,485), weekly open ($2,500), and prior month’s open ($2,529) congest price action, forming a tight range. A bullish order block—a consolidation zone signaling institutional buying—has formed just below these levels, reinforcing the bullish bias. Invalidation for Long position at 2430$ swing low.
Price Action: Ethereum recently swept downside liquidity (taking out stop losses below key levels), then expanded upward, forming the bullish order block. This indicates a squeeze higher, as long as prices remain above the SR levels, with institutions likely accumulating during the consolidation.
Strategic Consideration: While Ethereum presents a viable long opportunity, our portfolio is heavily allocated to equities, limiting additional crypto exposure. This highlights the importance of portfolio risk management, ensuring diversification across asset classes to avoid over-leveraging in correlated markets.

Figure 8: Rainbow Pattern Spotted in ETHUSD, firing Long trigger

Contextual Detail: Ethereum’s rainbow pattern is particularly significant given its role as a leading altcoin, but its upside is contingent on Bitcoin’s performance, as the broader crypto market often follows Bitcoin’s lead. The bullish order block adds confluence, suggesting institutional buying at these levels, with the $2,485-$2,529 range acting as a springboard for a breakout. However, the speaker’s caution reflects the need to balance crypto exposure with equities, especially in a melt-up environment where risk-on assets are highly correlated.
Strategic Implications: The rainbow pattern positions Bitcoin and Ethereum as high-probability long trades, with Bitcoin’s $118,000 target and Ethereum’s upside squeeze offering attractive returns. Traders should focus on real-time pattern recognition, using tools like the opens indicator to confirm breakouts, and manage portfolio exposure to mitigate risk from correlated assets. Monitoring Nasdaq’s performance is critical, as its bullishness directly influences crypto markets.
📊 Cross-Market Analysis and Asset Class Selection
Bitcoin’s Correlation with Nasdaq
Bitcoin’s increasing correlation with the Nasdaq reflects its evolution into a mainstream asset class, behaving more like a risk-on equity than an independent cryptocurrency:
Correlation Dynamics: July’s bullish seasonality for the Nasdaq, historically one of the strongest months for equities, drives Bitcoin’s upside. Nasdaq’s projected 7-8% gain to 24,000 aligns with Bitcoin’s targets of $115,000-$118,000, as institutional capital flows into both markets simultaneously.
Wealth Preservation: Bitcoin’s linkage to Nasdaq ensures long-term stability for holders, akin to digital gold. Its role as a store of value protects against inflation and currency devaluation, making it a core portfolio component for long-term investors.
Capital Allocation Example: On May 22nd, 2025, the speaker shifted capital from Bitcoin to Nasdaq (US equities), as Price action was indicating that Bitcoin is likely to go sideways at all-time highs. Whereas Nasdaq’s ETF QQQ was poised to capturing a 7% upside. This decision was driven by Bitcoin’s limited short-term potential compared to Nasdaq’s clearer momentum, illustrating the importance of dynamic capital allocation.

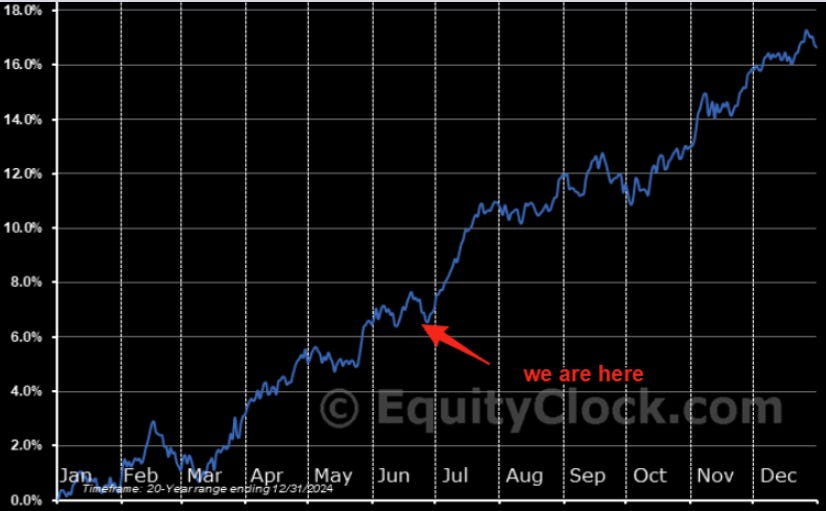
Figure 9: Seasonality index for S&P500 index, this highlights the trend S&P500 has followed at an average for past 60 years. This represents strong seasonality headwinds in the month of July and October-November.
Contextual Detail: Bitcoin’s correlation with Nasdaq has strengthened due to institutional adoption, with hedge funds and asset managers treating it as a risk-on asset alongside tech stocks. The February 2025 Nasdaq top, which triggered an exaggerated Bitcoin decline, underscores this dependency. For short-term traders, tracking Nasdaq’s technical patterns and macroeconomic catalysts (e.g., earnings, policy shifts) is essential to anticipate Bitcoin’s moves, particularly in a melt-up phase where risk-on sentiment dominates.
Capital Allocation Across Asset Classes
Strategic capital allocation is critical in a dynamic market environment to maximize risk-adjusted returns:
Equities Outperformance: From May to July 2025, U.S. equities outperformed cryptocurrencies, which traded sideways. For example, Nvidia gained 22% since May 13, 2025, compared to Bitcoin’s flat performance. This prompted us to reallocate capital from crypto to equities, capitalizing on stronger technical setups in stocks like Nvidia, Apple, and Amazon.
Leverage Comparison: Equities offer leveraged returns comparable to crypto. For instance, a 10% move in Ethereum with 10x leverage yields 100% return, similar to leveraged equity options where Option Calls or Option puts offer similar leverage opportunities . However, crypto’s current upside depends on equities’ performance, as Bitcoin and Ethereum await Nasdaq’s lead to break out.
(Risk Disclaimer: This is not an incentive to use leverage in any shape or form, do your own due diligence before entering an investment as there is risk involved in every Investment)Cross-Market Correlations: Money flows dynamically across asset classes, from Nasdaq to its constituents (Microsoft, Apple, Amazon, Meta). Nasdaq’s 8% gain over the past month, while Bitcoin remained flat, illustrates this flow, with Bitcoin “waiting” for Nasdaq to catalyze its next move. Understanding these correlations allows investors to prioritize assets with the highest upside potential, eventually providing the “Best Bang for the Buck”.
Contextual Detail: The speaker’s shift to equities reflects a broader market trend where institutional capital chases momentum in risk-on assets. The sideways action in crypto from May to July 2025 was driven by a lack of technical catalysts, while equities benefited from strong earnings expectations and policy support. For hedge fund managers, this underscores the need for active portfolio management, reallocating capital to assets with clear technical and fundamental drivers, such as equities during a bullish season.
Apple and Tariff Impacts
Apple’s performance is a focal point due to its sensitivity to U.S.-China trade dynamics and its significant weighting in major indices like the Nasdaq and S&P 500:
Current Position: A leap option call position, entered during sideways consolidation, is up 23-25% since entry during April, 2025 crash. The position includes a 250 strike option expiring in December 2025 or March 2026, offering a potential 200% return if Apple reaches 250. This reflects a low-risk, high-reward setup compared to crypto’s volatility. Details of this setup were discussed in our special edition covering US-Equities.
Tariff Impact: In April 2025, Apple dropped from 225 to 207 due to President Trump’s tariffs on China, a major supplier. A potential U.S.-China trade deal, expected around July 9, 2025, could reverse this decline, filling the price inefficiency (gap) at 225, representing a 6% upside from current levels.
Technical Setup: Apple is breaking out on a triple inside weekly candle—a pattern where three consecutive weekly candles are contained within the prior candle’s range—indicating strong bullish momentum. The SR level at current prices, tested four times, supports this breakout, mirroring a 2013 scenario where Apple gained 38% over 126 days post-consolidation.
Earnings Catalyst: Apple’s earnings on July 31, 2025, are a significant driver, likely amplifying the breakout. Positive earnings, combined with tariff resolution, could push Apple to new highs, positively impacting Nasdaq due to its heavy weighting.
Contextual Detail: Apple’s sensitivity to tariffs stems from its reliance on Chinese manufacturing, making trade policy a critical driver. The July 9 tariff deadline is a key event, as Trump’s pro-market stance suggests he will highlight favorable trade deals to boost equities. The triple inside weekly candle, a rare and powerful pattern, indicates institutional accumulation, with the four S/R level tests signaling weakening resistance. For hedge fund managers, Apple represents a stable, high-return opportunity compared to crypto’s volatility, with its upside directly influencing broader indices.
Strategic Implications: Investors should prioritize long positions in Apple, leveraging the tariff resolution and earnings catalysts to capture the 6% upside to $225 and potential further gains. The position’s stability and Nasdaq impact make it a cornerstone of a risk-on portfolio, complementing Bitcoin’s exposure.

Figure 10: Triple Inside 3-week Candle breakout in progress on AAPL
(IMPORTANT NOTE: There are risks associated with investing in securities.
This is by no means a financial advice, the information discussed is purely for educational purposes)
Click here to find in-depth Analysis on US-Equities
⚖️ Coinbase and Stablecoin Adoption
Impact of the GENIUS Act
The GENIUS Act, passed in 2025, has catalyzed a significant rally in Coinbase by enabling mainstream adoption of stablecoins, revolutionizing transaction efficiency:
Cost Efficiency: Stablecoin transactions via Coinbase cost 1% in fees, compared to 3-4% for traditional platforms like PayPal. For example, a $1,000 international transfer via PayPal yields $950 after fees and FX conversion, while Coinbase delivers $990 instantly (1% fee), with no FX costs. This efficiency makes stablecoins a compelling alternative for businesses and consumers.
Industry Disruption: Coinbase’s blockchain technology threatens global financial payments banking industry, challenging institutions like VISA, MASTERCARD, JP Morgan, Goldman Sachs, CitiGroup and American Express which control a global annual transaction of 20.6 trillion$. These banks must integrate blockchain or risk obsolescence, as businesses adopt Coinbase’s secure, efficient, and low-cost solutions for local and international transactions.
Market Impact: Coinbase’s inside quarterly candle failure—a pattern where the current quarter’s candle fails to break the prior quarter’s high or low—signals further upside. This rally supports Bitcoin and crypto equities like MicroStrategy (MSTR), as capital flows into the crypto ecosystem.
Altcoin Implications: Stablecoins’ integration undermines altcoins’ transactional use case, as businesses prioritize low-fee, stable solutions like USDC (issued by Coinbase’s subsidiary Circle). Weak altcoins face a potential 90% loss in a Bitcoin bear market (40-50% drop), tied to U.S. indices’ performance. However, Binance Coin (BNB) may survive by innovating, potentially integrating stablecoin-like functionality.
Contextual Detail: The GENIUS Act positions Coinbase as a leader in blockchain adoption, disrupting traditional banking by offering faster, cheaper transactions. The 1% fee structure and instant processing appeal to businesses seeking to reduce costs, particularly for international payments. For hedge fund managers, Coinbase’s rally reflects a structural shift in financial infrastructure, with stablecoins capturing capital that might otherwise flow to altcoins. The inside quarterly candle failure, a high-probability technical signal, suggests Coinbase will continue to outperform, driving correlated assets like Bitcoin and MSTR.

Figure 11: Inside Quarterly Candle Failure suggesting strong support zone in formation on COIN for sustained rally going into 2026.
💡 Bitcoin and JPMorgan Correlation
An unexpected correlation between Bitcoin and JPMorgan since January 2023 provides valuable trading insights:
Performance Comparison: Since January 2023, JPMorgan has risen 265%, outperforming Mag 7 stocks like Meta (209%), Microsoft (150%), and Apple (140%). Bitcoin, however, surged 568%, closely mirroring JPMorgan’s price action despite CEO Jamie Dimon’s public skepticism of cryptocurrencies.
Pattern Alignment: Both assets formed inside two-week candle failures in November 2022, reflecting their linkage to Nasdaq and broader U.S. equities. For example, JPMorgan’s six-month rally from November 2022 to May 2023 aligned with Bitcoin’s, followed by synchronized downturns in February 2025. Currently, JPMorgan’s up candle signals Bitcoin’s imminent expansion, supported by the rainbow pattern.
Long-Term Outlook: Bitcoin’s projected $1 million price by 2028 represents an 8x return, potentially reaching a $16 trillion market cap. This compares favorably to JPMorgan’s expected 100-150% growth, as Bitcoin’s smaller $2 trillion market cap (versus gold or S&P 500) offers greater growth potential. The speaker anticipates Bitcoin as the crypto market’s index, akin to the S&P 500 for equities.
Contextual Detail: The Bitcoin-JPMorgan correlation is surprising given Dimon’s criticism, but it reflects institutional capital flows into risk-on assets. Both assets respond to similar macroeconomic drivers, such as Federal Reserve policy and equity market sentiment. For hedge fund managers, JPMorgan’s price action serves as a leading indicator for Bitcoin, particularly in a melt-up phase where risk-on assets rally together. The $1 million target underscores Bitcoin’s long-term potential as a store of value, with its market cap still modest compared to traditional assets.
Strategic Implications: Use JPMorgan’s technical patterns (e.g., up candles, rainbow patterns) to time Bitcoin longs, leveraging their correlation to capture upside in a melt-up environment. Long-term investors should view Bitcoin as a high-growth asset, while short-term traders can use JPMorgan’s signals to enhance timing.

Figure 12: Comparing the returns of BTCUSD and JP Morgan since January 2023 bottom. BTCUSD outperformed the largest financial institution by a record number
📈 Broader Market Analysis
S&P 500 and Market Trends
The S&P 500’s recent performance, marked by ten consecutive bullish daily candles, signals robust momentum, resembling post-COVID (2020) and post-2018 crash recoveries:
Historical Patterns: Post-crash recoveries typically feature four to five bullish monthly candles before a 7-8% flush, often mistaken for a recession. The current market, on its third bullish candle, suggests further upside before euphoria-driven corrections. For example, the 2020 recovery saw five up candles, while 2018 had four, with down months providing ideal long reload points.
Seasonality and Policy: July’s strong seasonality, driven by historical equity gains, is amplified by the Invest in America Act, signed into law on July 4, 2025. The Act allocates $1,000 S&P 500 accounts for children born from July 4, 2025, injecting $70 billion by July 4, 2026. This liquidity, akin to post-COVID stimulus, supports a melt-up phase, with the S&P 500 up 6% year-to-date and targeting 18-20% by year-end, aligning with Trump’s pro-market agenda.
Trade Setup: A long position initiated at 5943 in June 2025, based on seasonality, continues to perform well. Shorting the market is risky, as technical patterns and liquidity inflows discourage bearish bets.
Contextual Detail: The S&P 500’s rally reflects a combination of technical strength, policy support, and investor psychology. The ten-day streak, while impressive, is not a topping signal, as historical recoveries show sustained upside before corrections. The Invest in America Act’s $70 billion injection, distributed to top constituents like Apple and Nvidia, ensures long-term buying pressure, as these accounts are held for 18 years. Trump’s focus on a strong economy for the 2026 midterms further reduces the likelihood of market disruptions, making July a prime period for risk-on strategies.
Nasdaq and Technical Patterns
Nasdaq’s technical setup supports continued upside, driven by a melt-up environment:
Inside Daily Candle Failure: A recent inside daily candle failure—where the current daily candle’s range is contained within the prior’s, followed by a breakout—signals bullish continuation. Friday’s downside (July 4, 2025) is irrelevant due to U.S. holiday closure, but a potential Monday drop to 22,617 could test the monthly open, offering a long entry. A break below 22,374 would target 21,908, though strong two-week candle support makes this unlikely.
Earnings and Volatility: Key earnings include JPMorgan (July 15), Nasdaq (July 17), Microsoft/Google (July 29), Amazon/Apple (July 31), and Tesla (late July). The FOMC meeting, coinciding with late-July earnings, may trigger volatility, but upside persists until then. For example, a prior long entry, triggered by an hourly SFP within an inside 12-hour candle, saw immediate upside, with the current pullback attributed to the two-week candle’s closing wick.
Melt-Up Target: Nasdaq’s 7-8% upside targets 23,855 (1.272 Fibonacci extension) to 24,000, driven by algorithmic buying at all-time highs and vol control funds increasing equity exposure. The VIX’s inside quarterly candle failure, targeting downside liquidity, supports S&P 500 and Nasdaq gains due to their inverse correlation.
Contextual Detail: Nasdaq’s rally is fueled by institutional momentum, with all-time highs triggering forced buying from algorithms and funds. The VIX’s decline, reflecting low volatility, encourages risk-on exposure, while earnings season amplifies momentum in tech-heavy constituents. The potential stop run at 22,617 reflects institutional tactics to shake out weak hands before resuming upside, a common pattern at new candle opens. For hedge fund managers, Nasdaq’s technical and fundamental drivers make it a core portfolio component, with careful stop-loss management to avoid premature exits.

Figure 13: NAS100USD upside target for July, 2025.
Dow Jones and Nikkei
Dow Jones: An inside two-month candle failure signals a 2.6% upside to all-time highs, with a 3:1 risk-reward ratio. A rainbow pattern, with aligned daily, weekly, and monthly opens, triggered a long when prices broke the nearest high. The target is near, with no expected retest of the monthly open, implying broad index gains.
Nikkei: An inside quarterly candle failure suggests 8.5% upside, correlating with Nasdaq and the SMH semiconductor ETF (Nvidia, TSM, AMD). Nikkei’s downside wick formation signals bullish potential, with entry at the new two-week candle open. Its correlation with SMH, driven by Nvidia’s global influence, reinforces the upside thesis.
Contextual Detail: The Dow Jones and Nikkei benefit from global risk-on sentiment, with the Dow’s conservative weighting complementing Nasdaq’s tech-driven gains. Nikkei’s correlation with SMH reflects the semiconductor sector’s dominance, as Nvidia’s all-time highs signal broader tech strength. For global portfolios, these indices offer diversified exposure, with Nikkei’s 8.5% upside aligning with Nasdaq’s targets.
For in depth Analysis on Global Indices (S&P500, NAS100, US30, Nikkei, DAX), Checkout our Quarterly Outlook publication.
USD/JPY and Forex
USD/JPY’s technical and fundamental setup supports broader market trends:
Double Inside Monthly Candle: This pattern, where two consecutive monthly candles are contained within the prior’s range, signals a high-probability breakout. Downside liquidity triggers a long, while upside liquidity with a daily SFP signals a short. An upside move lifts Nikkei, reflecting their correlation.
USD Hedging: USD devaluation reduces portfolio returns (e.g., 50% to 43%). Short-term SPY option calls, yielding 100-150% on a smaller position size, boosts the portfolio incrementally, offsetting the 7% loss. Alternatives include gold and Bitcoin longs.
Contextual Detail: USD/JPY’s upside aligns with Nikkei’s due to Japan’s export-driven economy, benefiting from a weaker yen. USD weakness, driven by expansive U.S. policies, supports EUR/USD and GBP/USD gains, but requires strategic currency selection. Hedging via SPY options leverages the S&P 500’s strength, ensuring purchasing power preservation in a devaluation environment.

Figure 15: Double Inside Monthly Candle in play for USDJPY. Projected pathway to 152 before further downside resumption.
🧈 Gold Analysis
Gold’s technical setup offers a hedge against USD devaluation:
Inside Two-Month Candle Failure: Gold targets a 3,120 liquidity low, within a 2970-3050 support zone. A break below 3123 triggers long positions, as the pattern favors a reversal post-liquidity sweep.
Outlook: Gold is expected to outperform into year-end, particularly in the last two quarters, as a safe-haven asset amid USD weakness and geopolitical uncertainties.
Contextual Detail: Gold’s role as a hedge is critical in a USD devaluation environment, with the 2970-3050 zone representing a high-probability reversal point. The inside two-month candle failure reflects institutional accumulation, as investors position for a safe-haven rally. For hedge fund managers, gold complements risk-on assets, balancing portfolio volatility.
Strategic Implications: Long gold post-3,120 for year-end outperformance, avoiding shorts due to the pattern’s bullish bias.
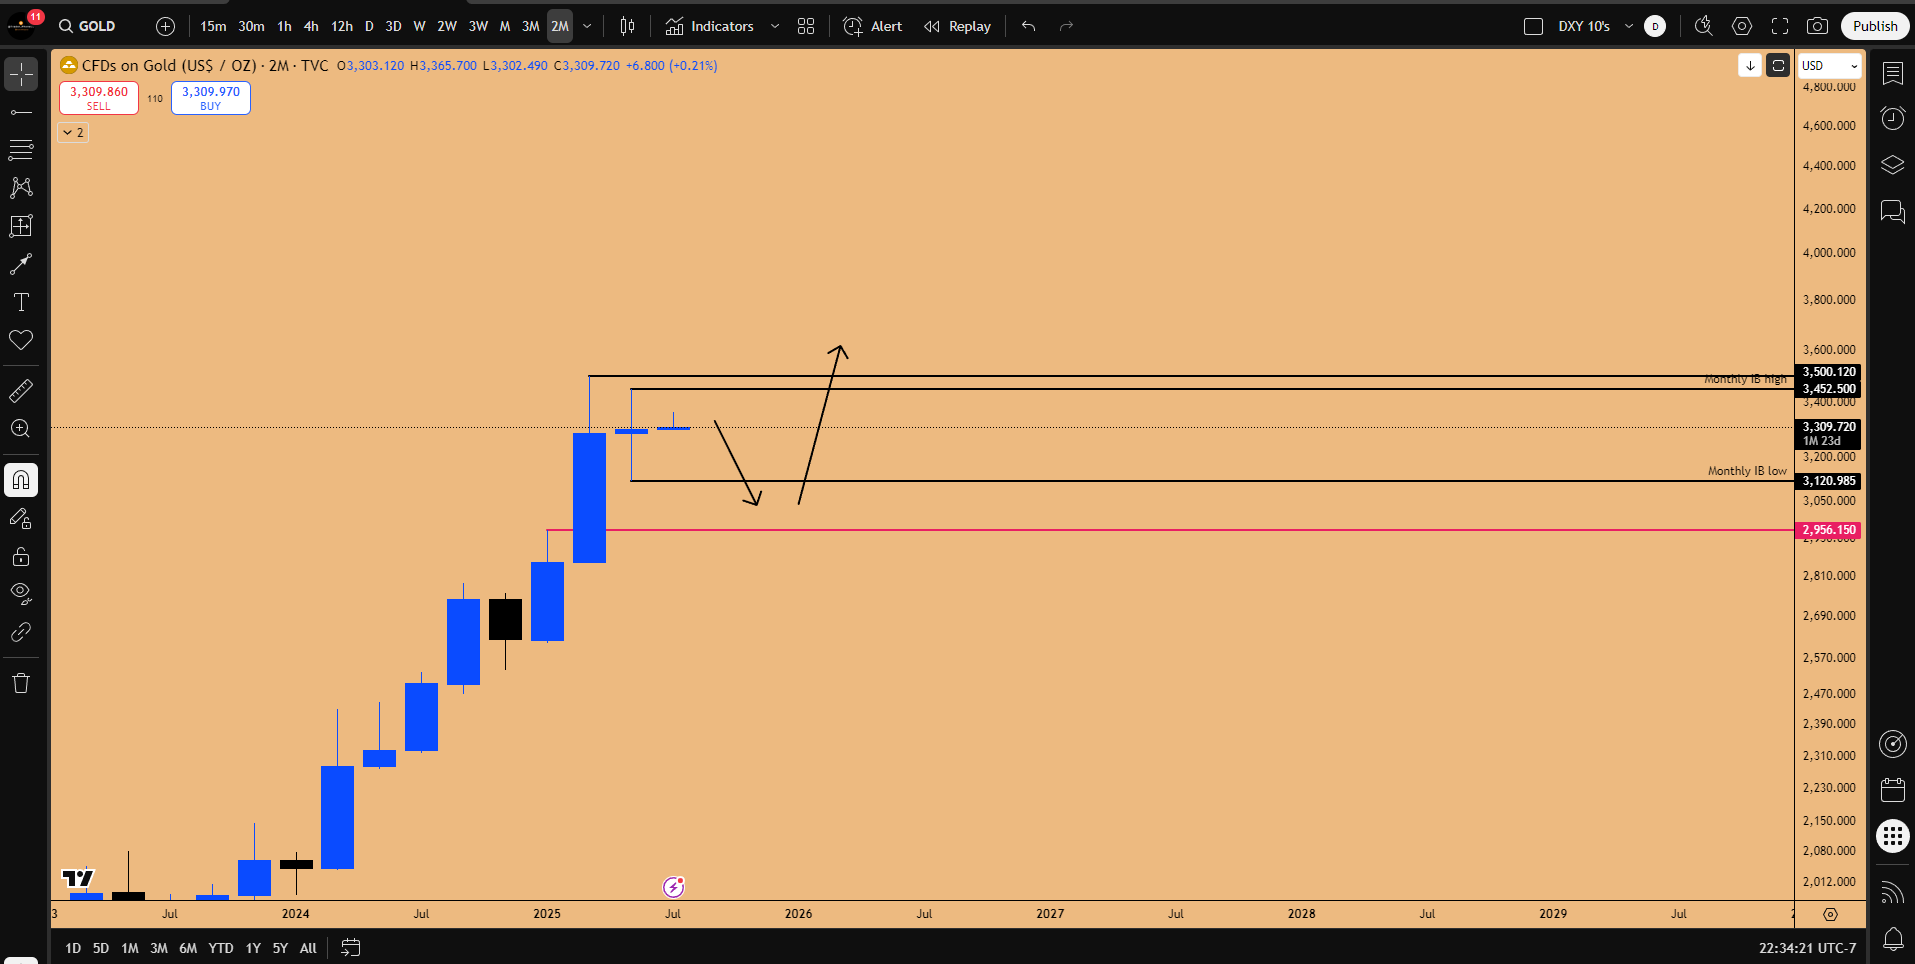
Figure 16: Inside 2-month candle pattern in play on GOLD
🎯 Conclusion and Strategic Recommendations
July 2025’s melt-up environment, driven by technical patterns, policy support, and liquidity injections, demands active portfolio management:
Cryptocurrencies: Long Bitcoin above $107,000 (target: $118,000, stop: $105,000) and Coinbase, leveraging Nasdaq correlation and the GENIUS Act. Exercise caution with altcoins, favoring Bitcoin’s digital gold status.
Equities: Prioritize Apple (Near term target: $225), Amazon (Final target: $242), and Google (gap fill target : 207$), capitalizing on tariff resolutions (July 9) and earnings (July 29-31). Nasdaq and S&P 500 target 7-8% upside (23,855-24,000 and potential 20% year to date return, respectively).
Forex and Gold: Hedge USD devaluation via EUR/USD, GBP/USD, and gold longs post-3,120, complementing risk-on positions.
Risk Management: Define exits for existing long positions (e.g., Nasdaq Exit: 23,855), trail stop losses, and consider SPY option calls to ride the risk-on trend (S&P500 ETF) to offset USD devaluation, ensuring portfolio resilience.
The Invest in America Act’s $70 billion, Trump’s pro-market policies, and technical signals (rainbow, monthly open) drive bullishness. Investors must avoid fading the melt-up, focus on high-upside setups, and prepare for late-July volatility from earnings and FOMC meeting, positioning portfolios for outsized returns in a dynamic market.
Good job guys