


Dear Fellow Trader,
This is a Risk Map. It is a guide to understanding where we are, what the key risks are, what is poised to move, and when to reassess our positions.
Today we’ll do it on one market only: EURJPY. It is where a risk-off shock tends to show up fastest and hardest.
The setup: the S&P has tanked, and risk is off
The S&P 500 has tanked. Friday’s close was 6,910.39, 11.9% below the 6 October high of 7,844.5. Risk is off.
The barometers on the map have already broken:
SPY/TLT (stocks over long bonds) peaked at 10.12 on 6 October. Friday it closed at 8.47, 16% lower. When this ratio breaks down, people go for the exits. They are doing that now.
VIX/VIX3M (front-month over three-month volatility) has spiked through 1.10. Friday: VIX 35.89, VIX3M 30.94, a ratio of 1.16, with VIX above VIX3M. That is panic, not a quiet dip.
This is the kind of environment where EURJPY can move hard. The rest of this post is the teaching: the mechanism, and how big those moves have been.
The engine: real yields and the S&P 500
The engine behind these macro moves can often be found in US real yields: the return on a 10-year US bond after accounting for inflation.
Put real yields next to the S&P 500 and you get a very clean read:
Real yields DOWN, S&P 500 UP: Classic risk-on. Dollar down.
Real yields UP, S&P 500 DOWN / choppy: Classic risk-off. Dollar bid.
Real yields DOWN, S&P 500 DOWN: Flight to bonds AND flight from stocks. Yen up, EURJPY down, often dramatically.
The third row is the one that hits EURJPY hardest. Falling yields (money hiding in bonds) plus a falling stock market (money leaving risk) is rocket fuel for the Japanese yen.
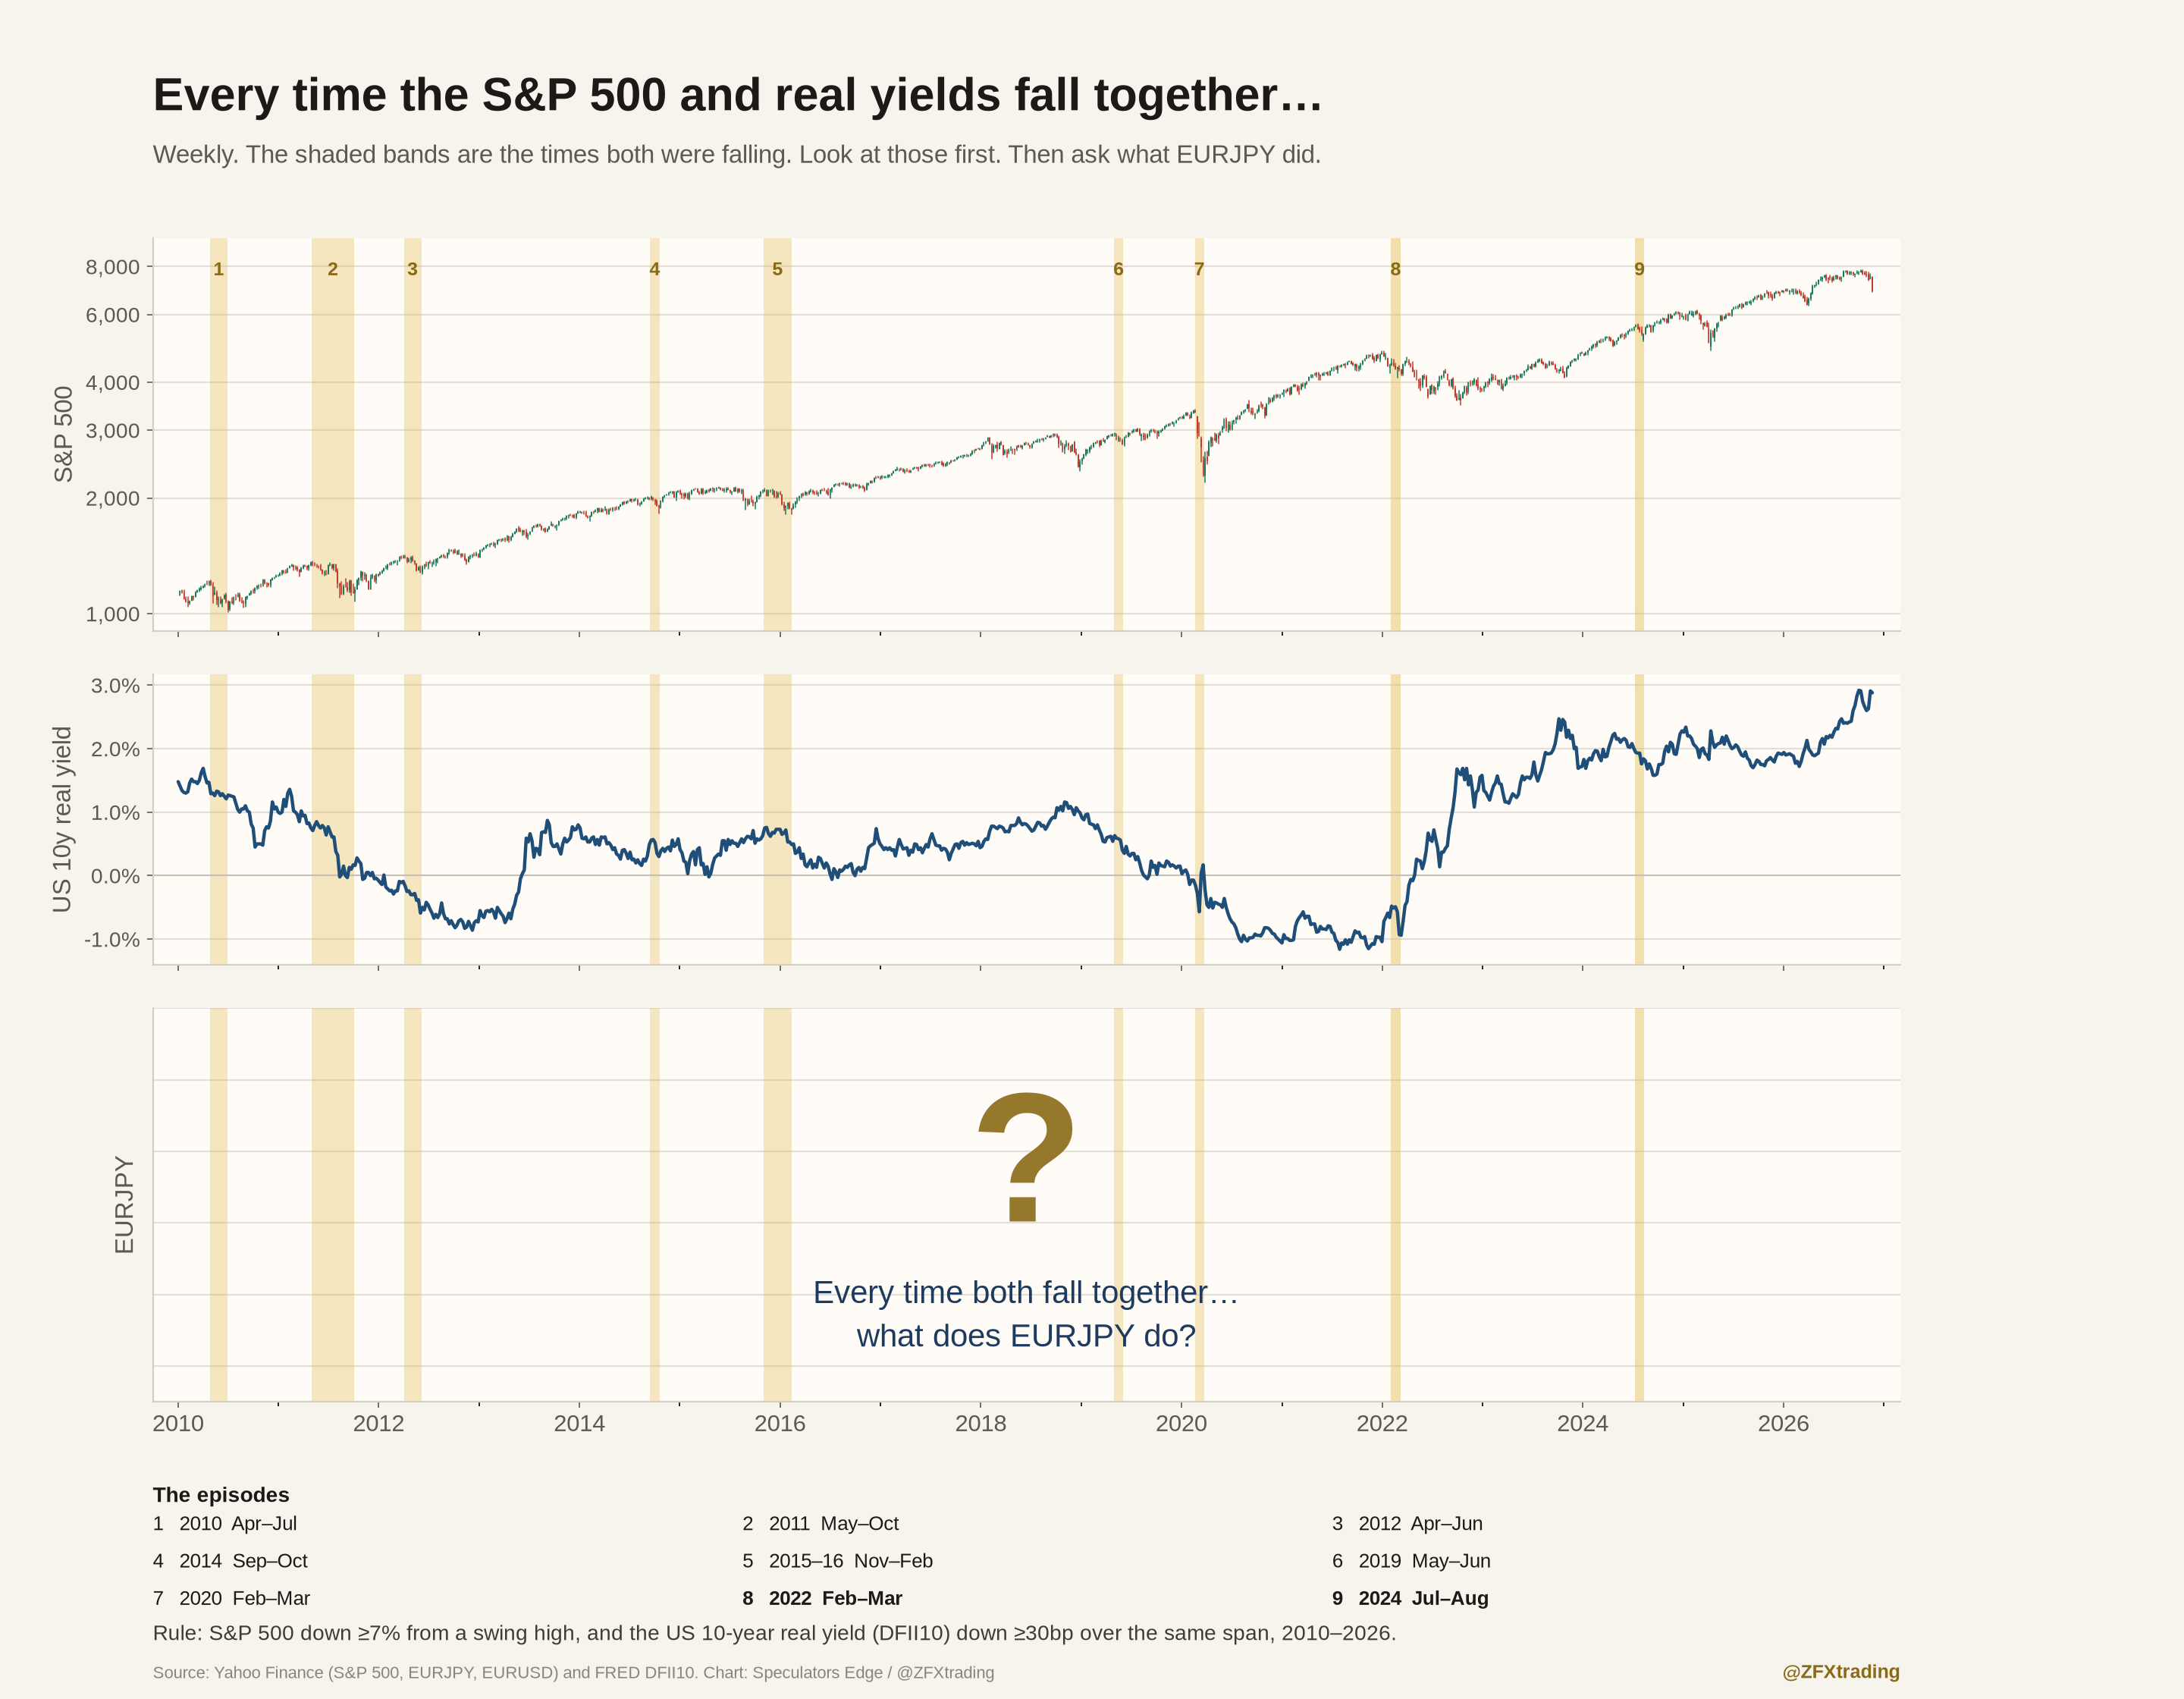
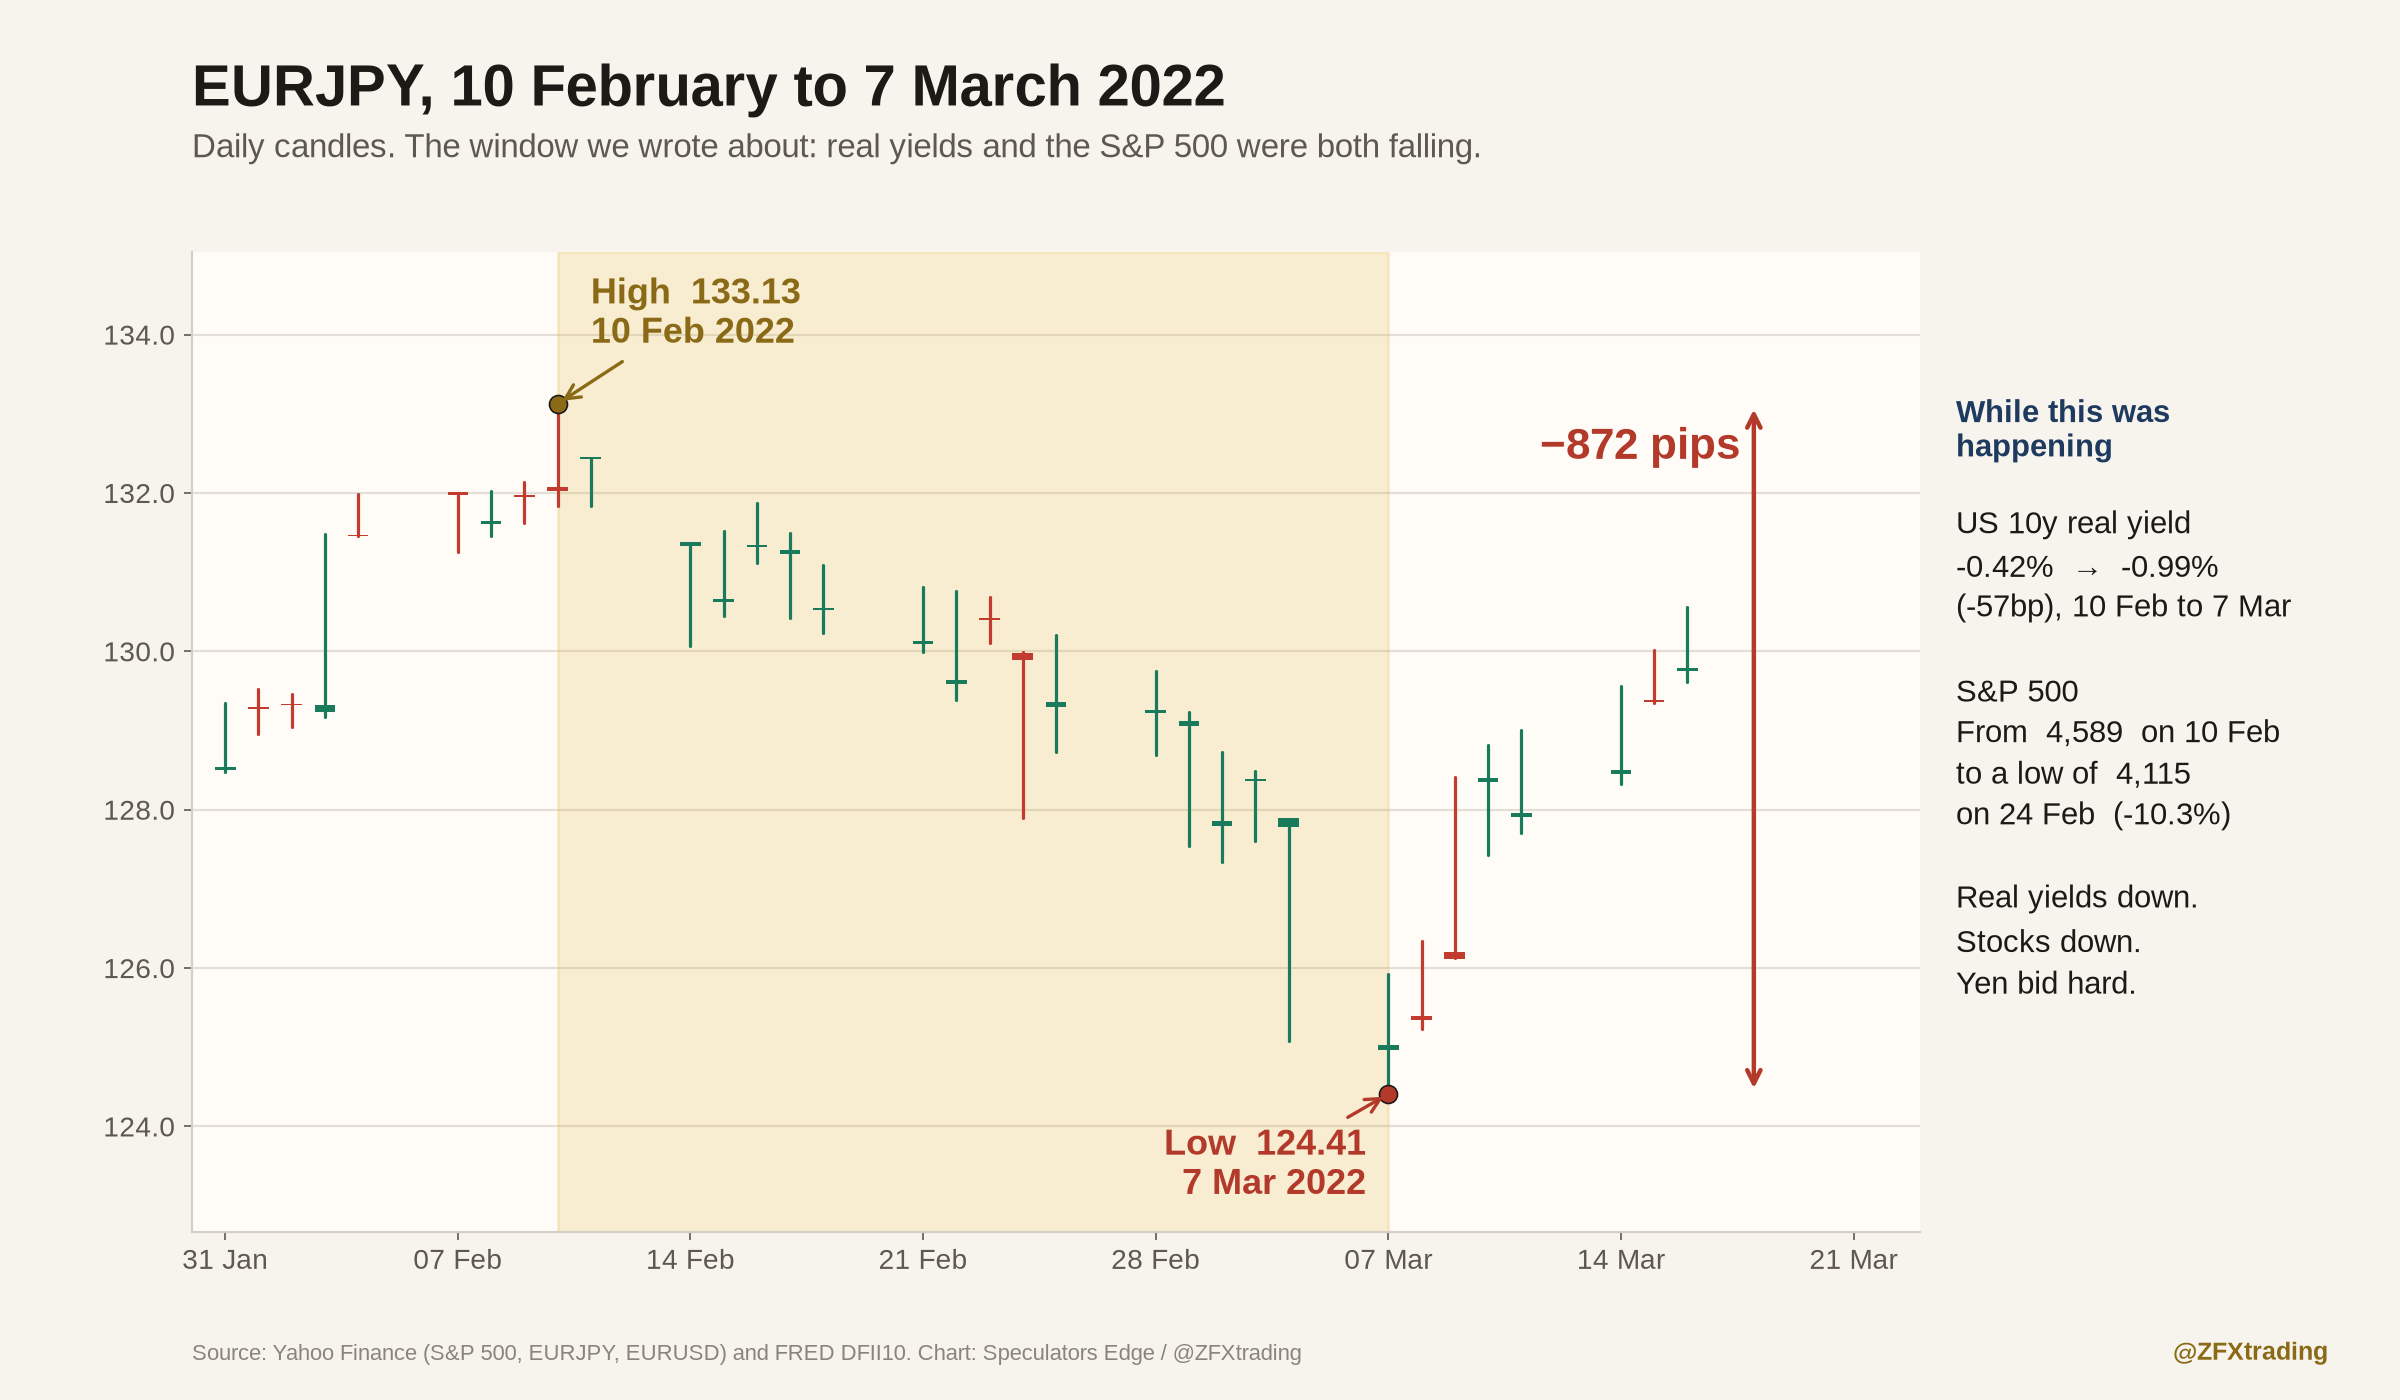
We’ve measured it. Nine times since 2010, when the S&P 500 fell at least 7% and real yields fell with it, EURJPY dropped. The moves ran from 443 pips to 2,101 pips. From February into March 2022, EURJPY lost 872 pips. In July and August 2024 it lost 2,098 pips. That is how big EURJPY can move in a situation like the one we are in now.
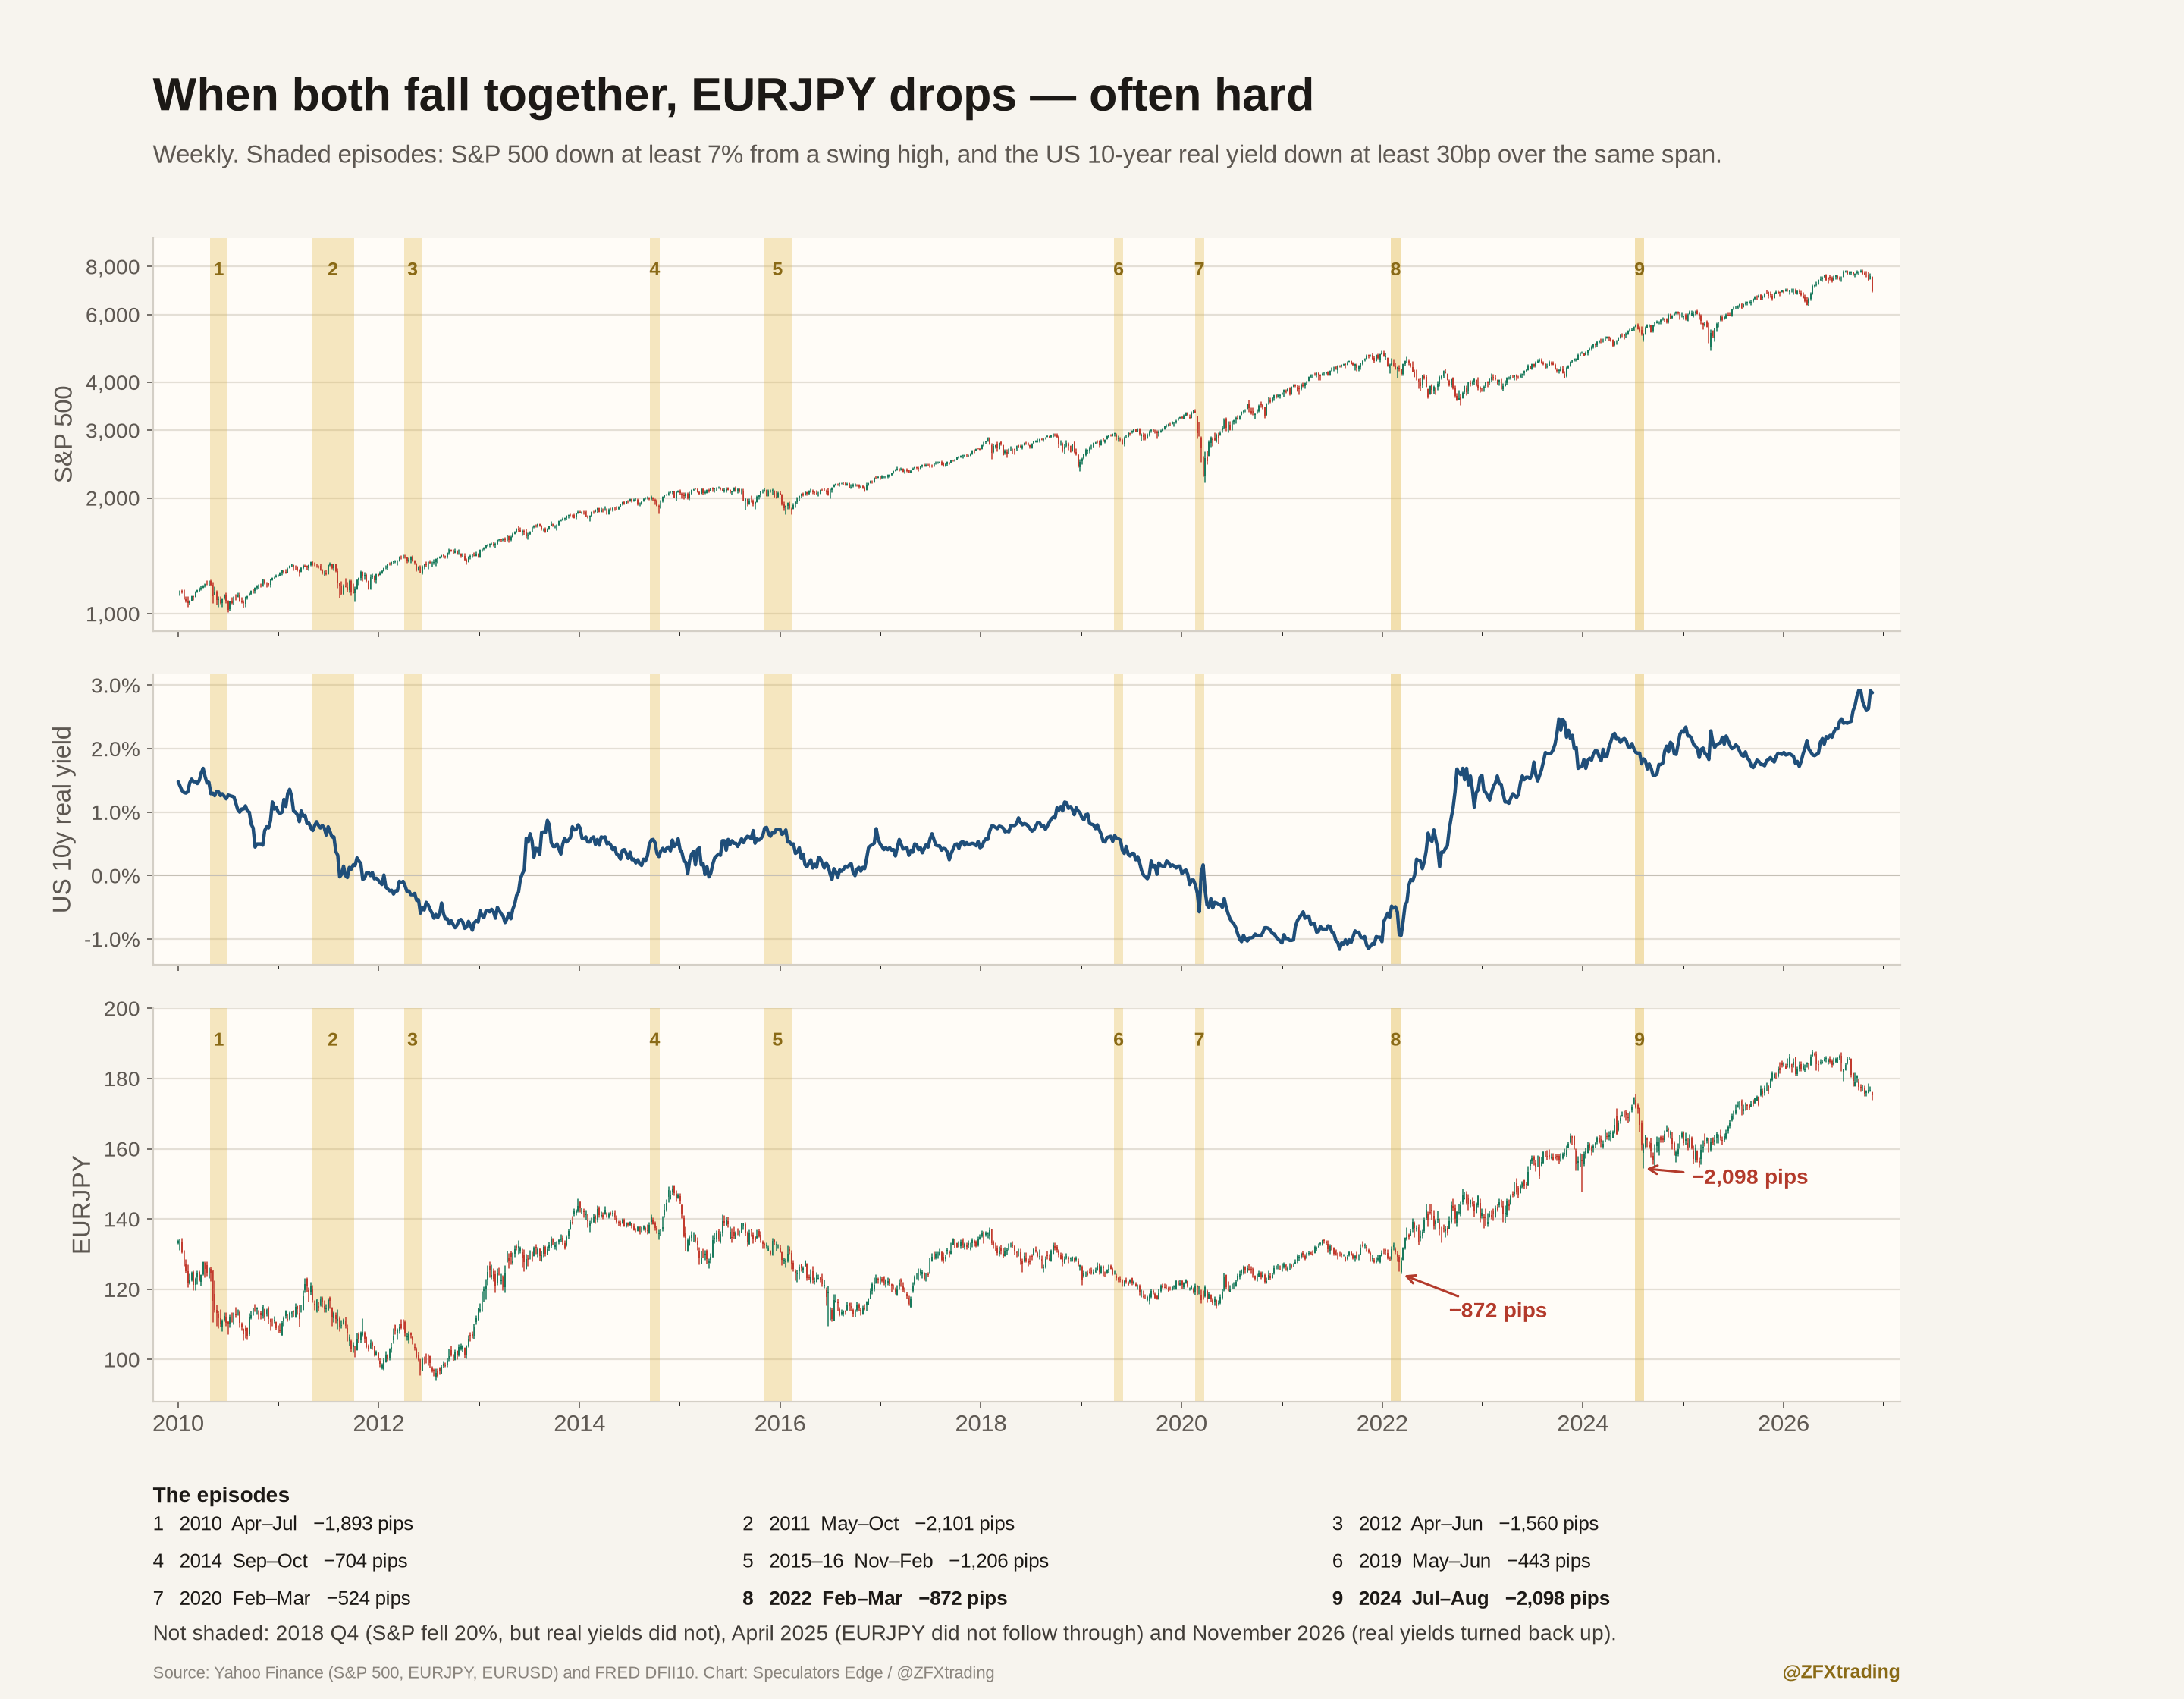
One caveat, stated plainly: in April 2025 the S&P and real yields both fell, and EURJPY did not follow through.
We should also be straight about the other half of the engine, right now. Stocks have rolled. Real yields have not. The US 10-year real yield (DFII10) printed 2.60% on 30 October and 2.88% on 19 November, the latest figure. It dipped, then turned back up. We will not claim both halves are falling. The stock half is. The yield half is not, yet. That is the piece to watch.
The dates that matter
The window runs from now through the December central bank meetings:
Fri 4 Dec, 13:30 UK: US jobs report (November)
Wed 9 Dec, 19:00 UK: Fed decision, which closes the current six-week cycle
Thu 10 Dec, 13:30 UK: US CPI (November)
Thu 17 Dec, 13:15 UK: ECB decision (the EUR side)
Fri 18 Dec: Bank of Japan decision (the JPY side)
Our view on EURJPY
We expect EURJPY to continue to trade heavy into December. Friday it closed at 175.17, after a low of 174.00. Every one of those dates is a chance for the narrative to arrive. When real yields and stocks fall together, the yen doesn’t drift higher, it gets bid hard.
What would change our mind: the S&P 500 making new highs while real yields rise. Then the yen trade stays shelved, and there’s no point fighting it.
Scorecard: how the last three posts played out
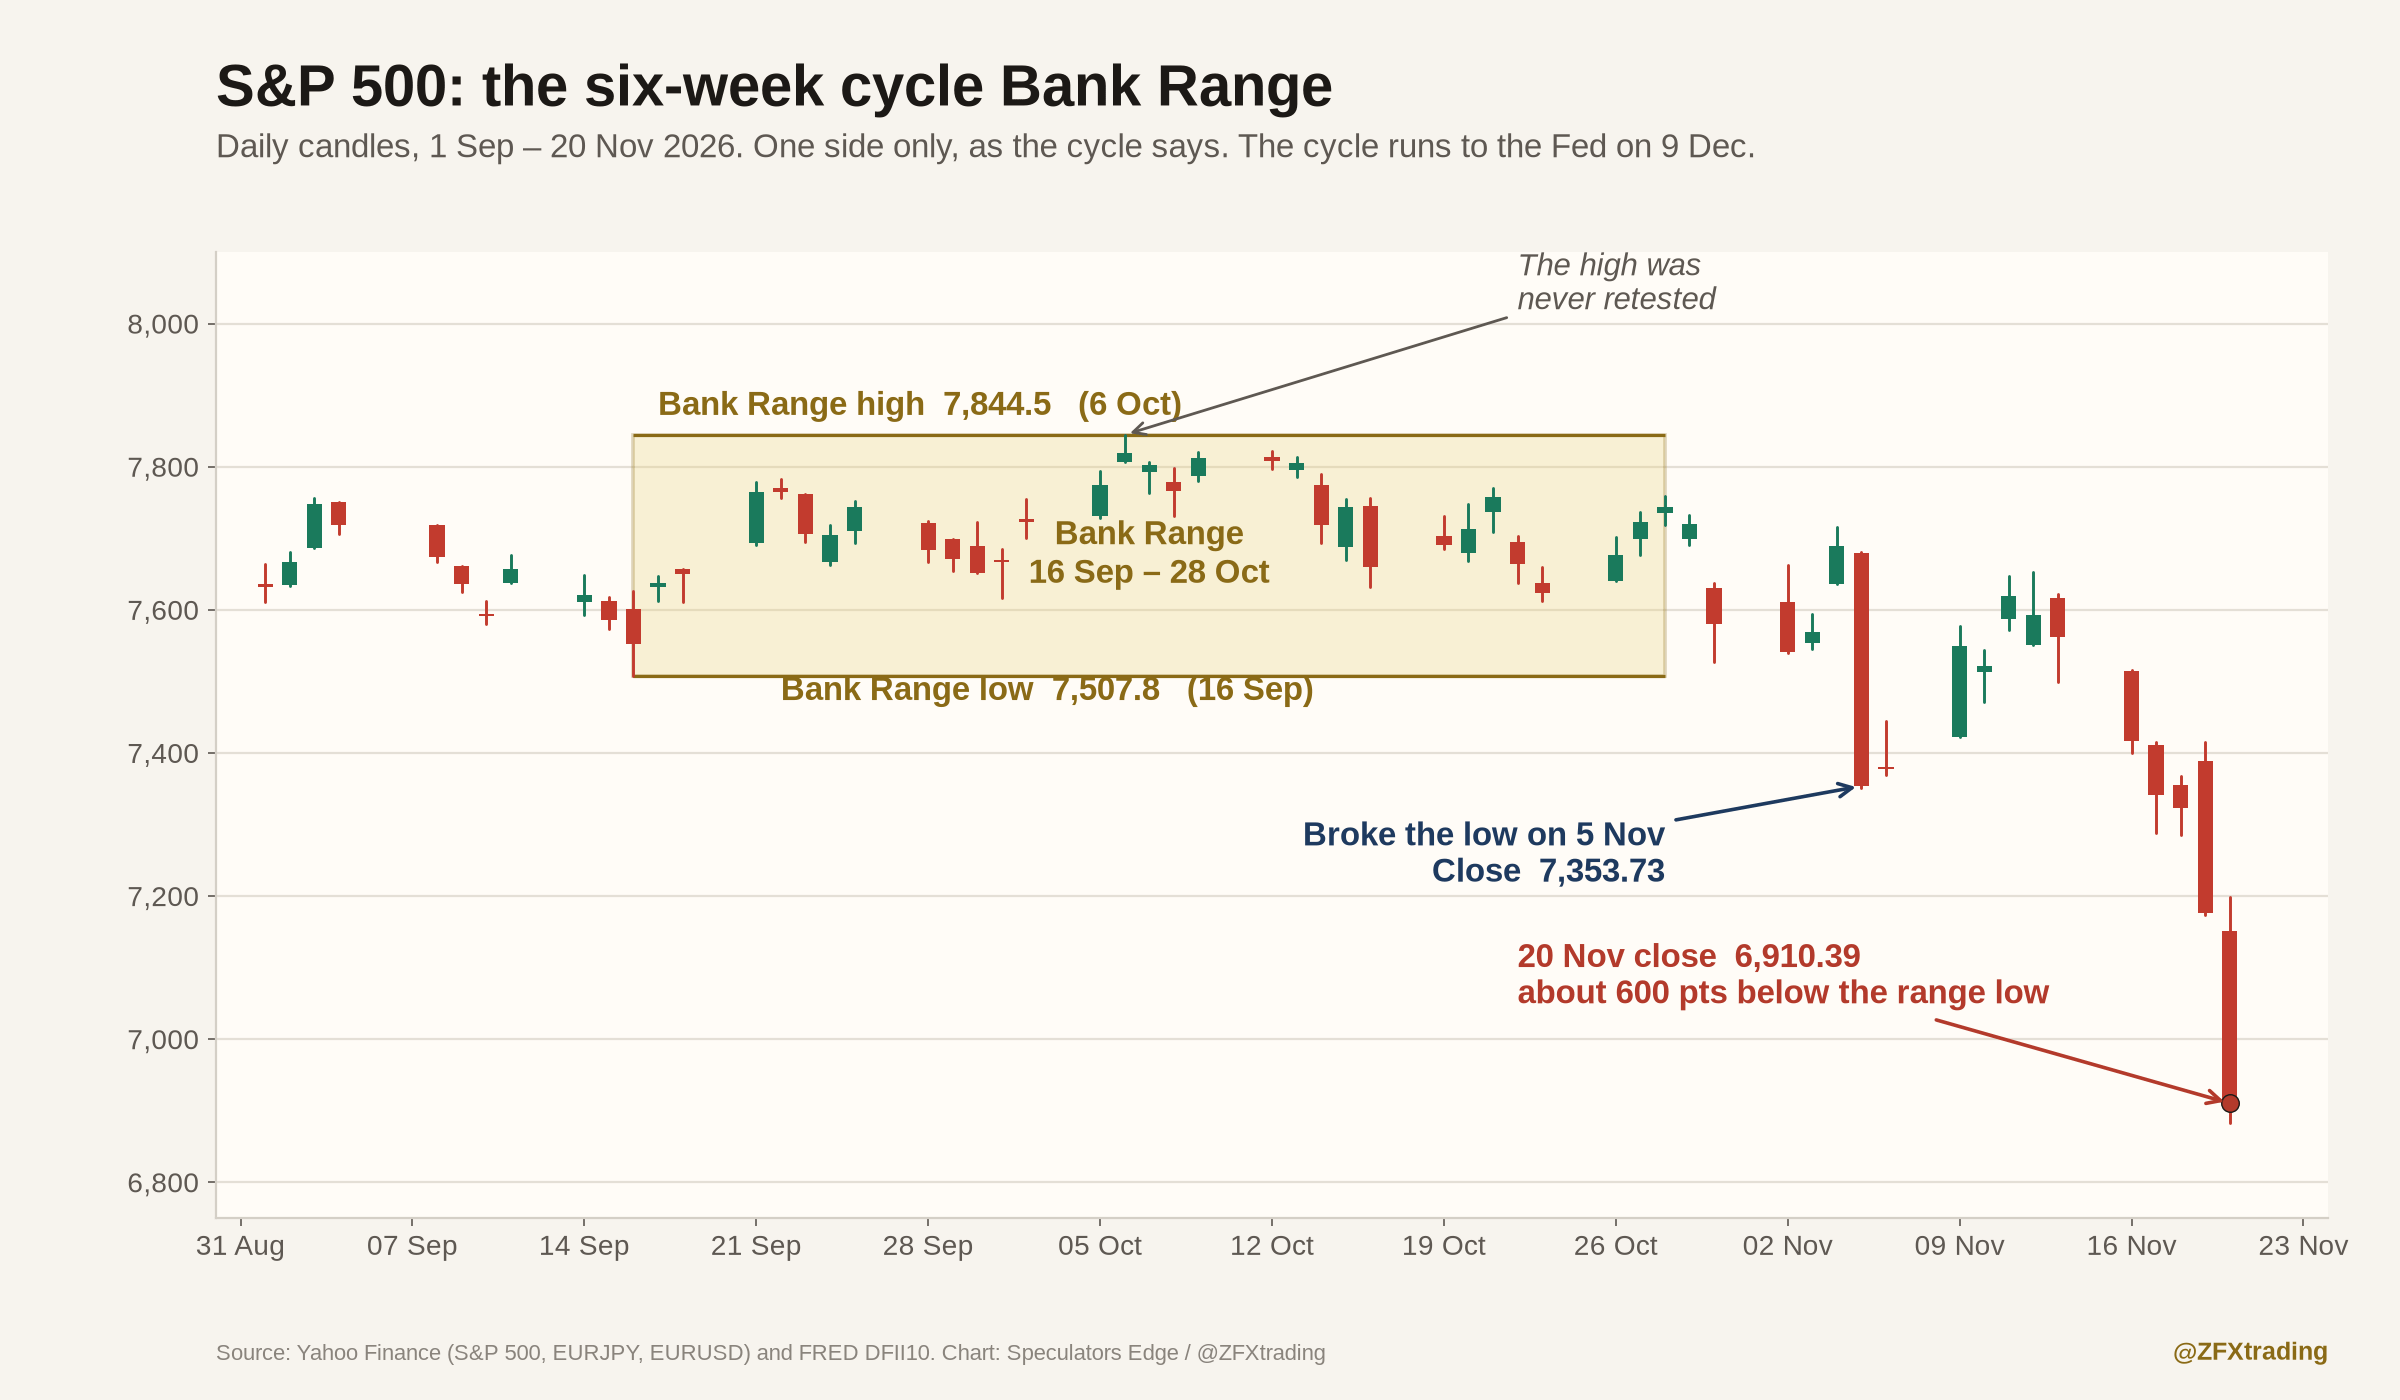
Six-Week Cycle (2 Nov): the S&P 500 Bank Range ran 7,507.8 to 7,844.5. The S&P broke the low on 5 Nov and has not been near the high since. One side only, as the cycle says. Friday’s close was 6,910.39, about 600 points below the range low, with the cycle running to the Fed on 9 Dec.
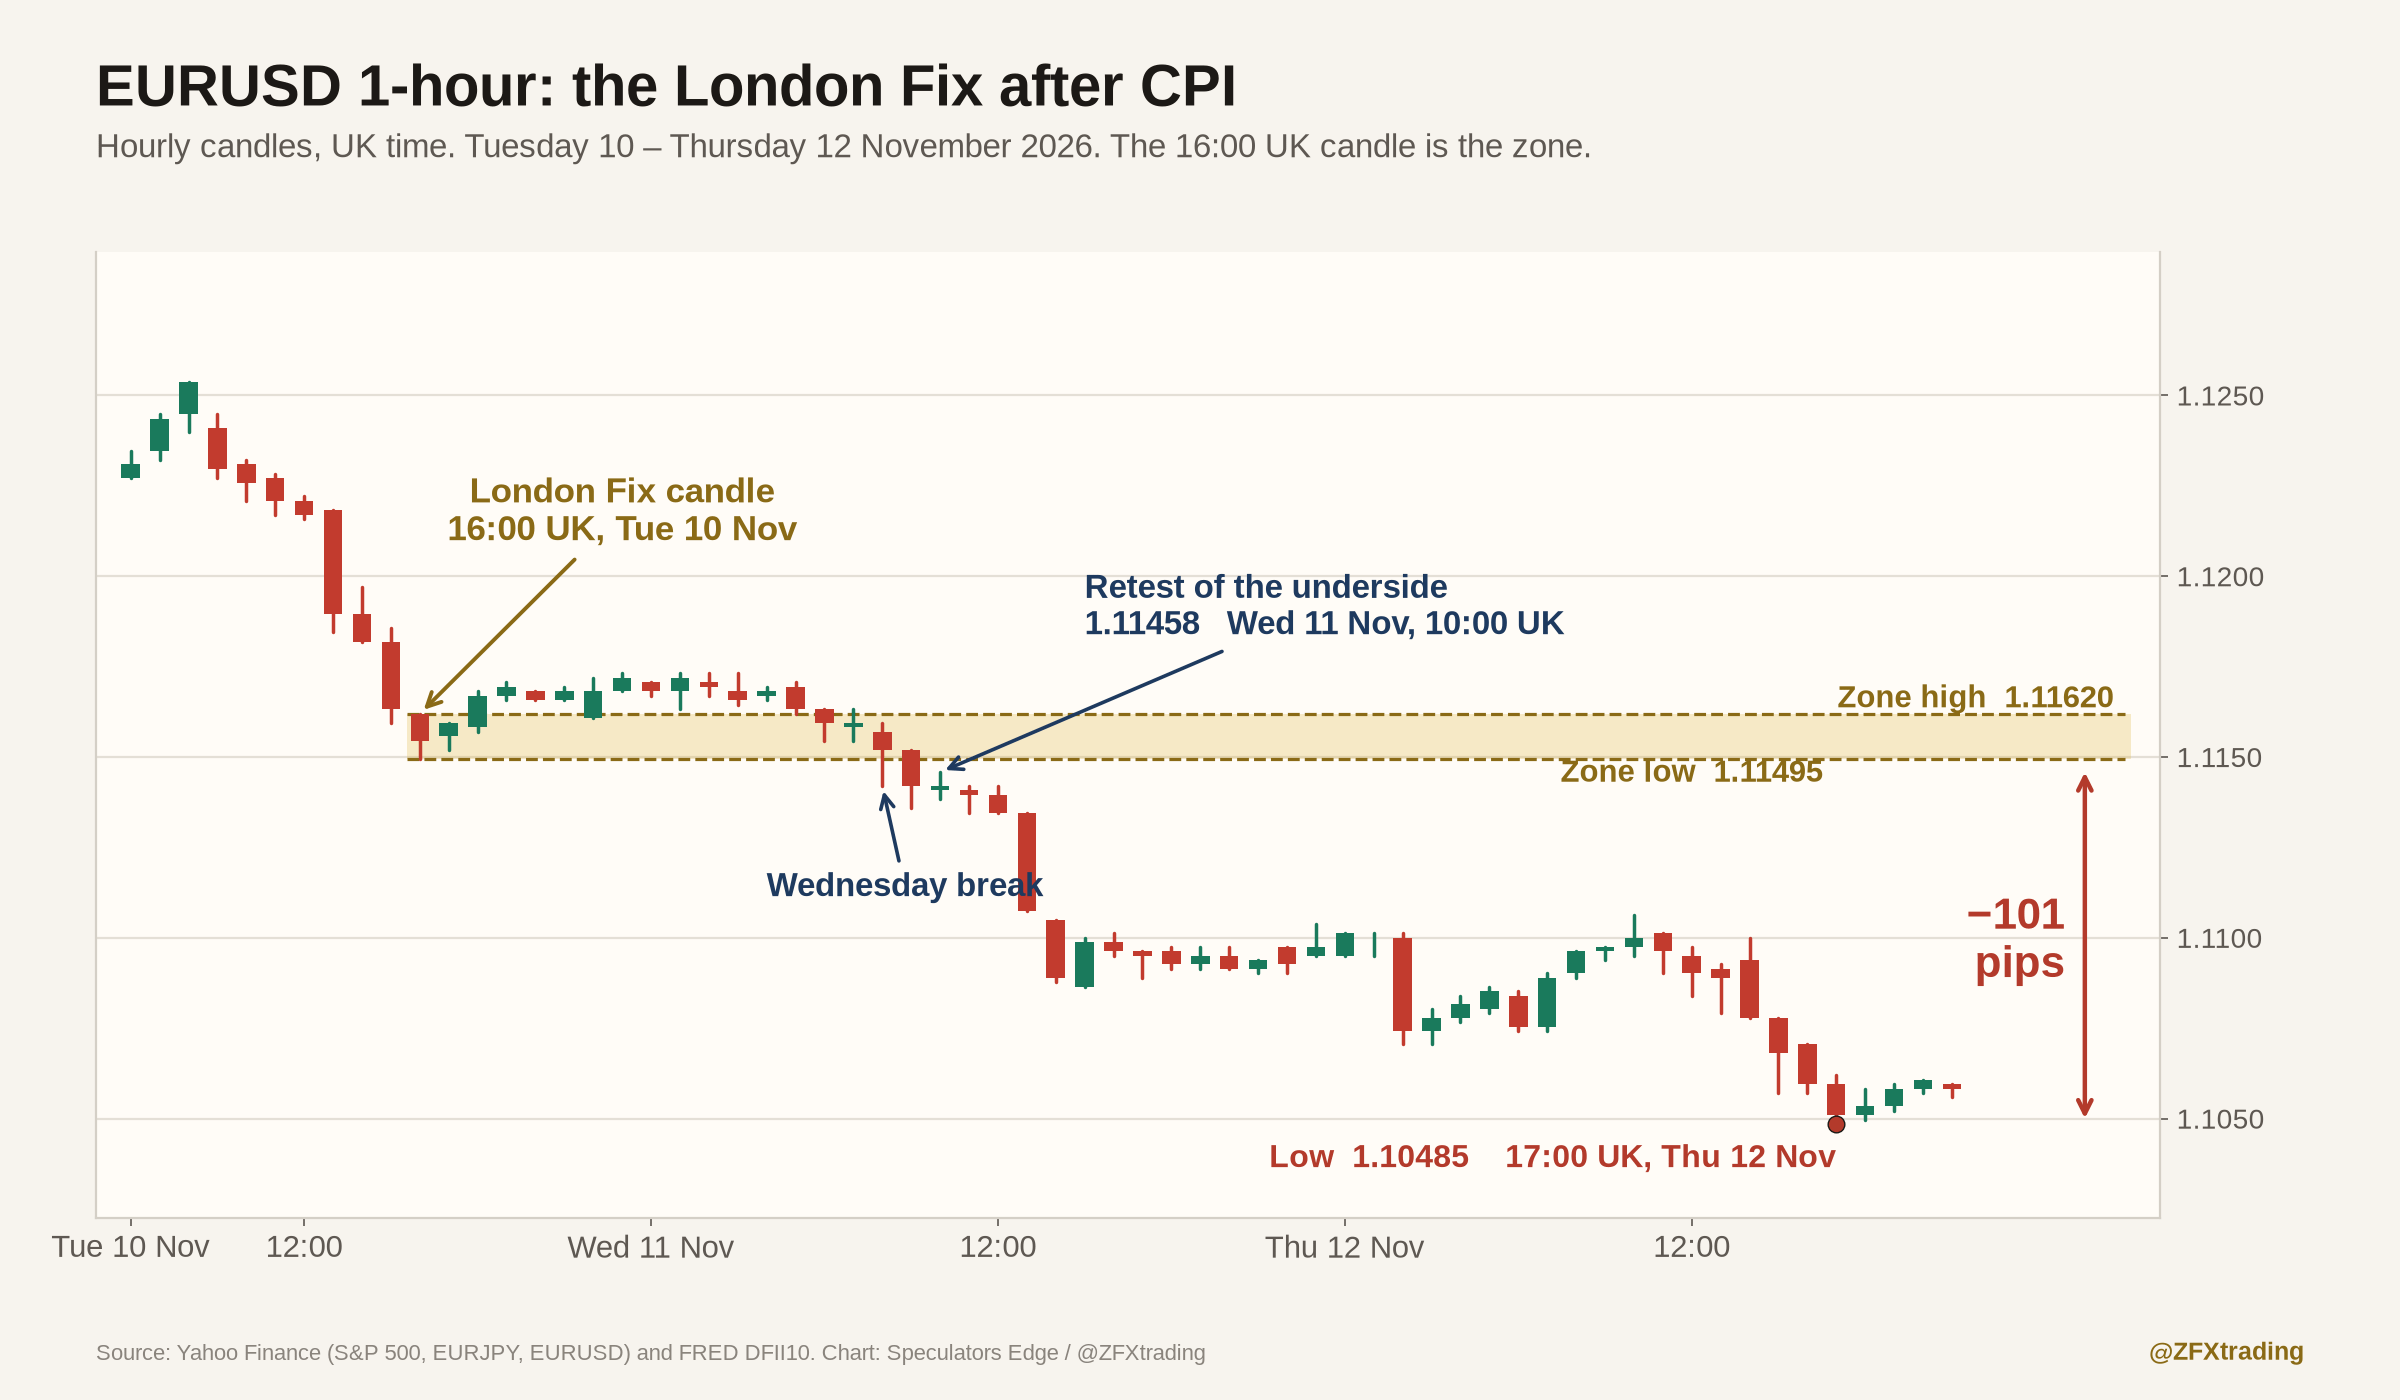
London Fix on CPI day (10 Nov): it held. EURUSD broke below the 16:00 candle on Wednesday, tapped its underside at 1.11458 and fell 101 pips to 1.10485 by Thursday. GBPUSD fell 91.
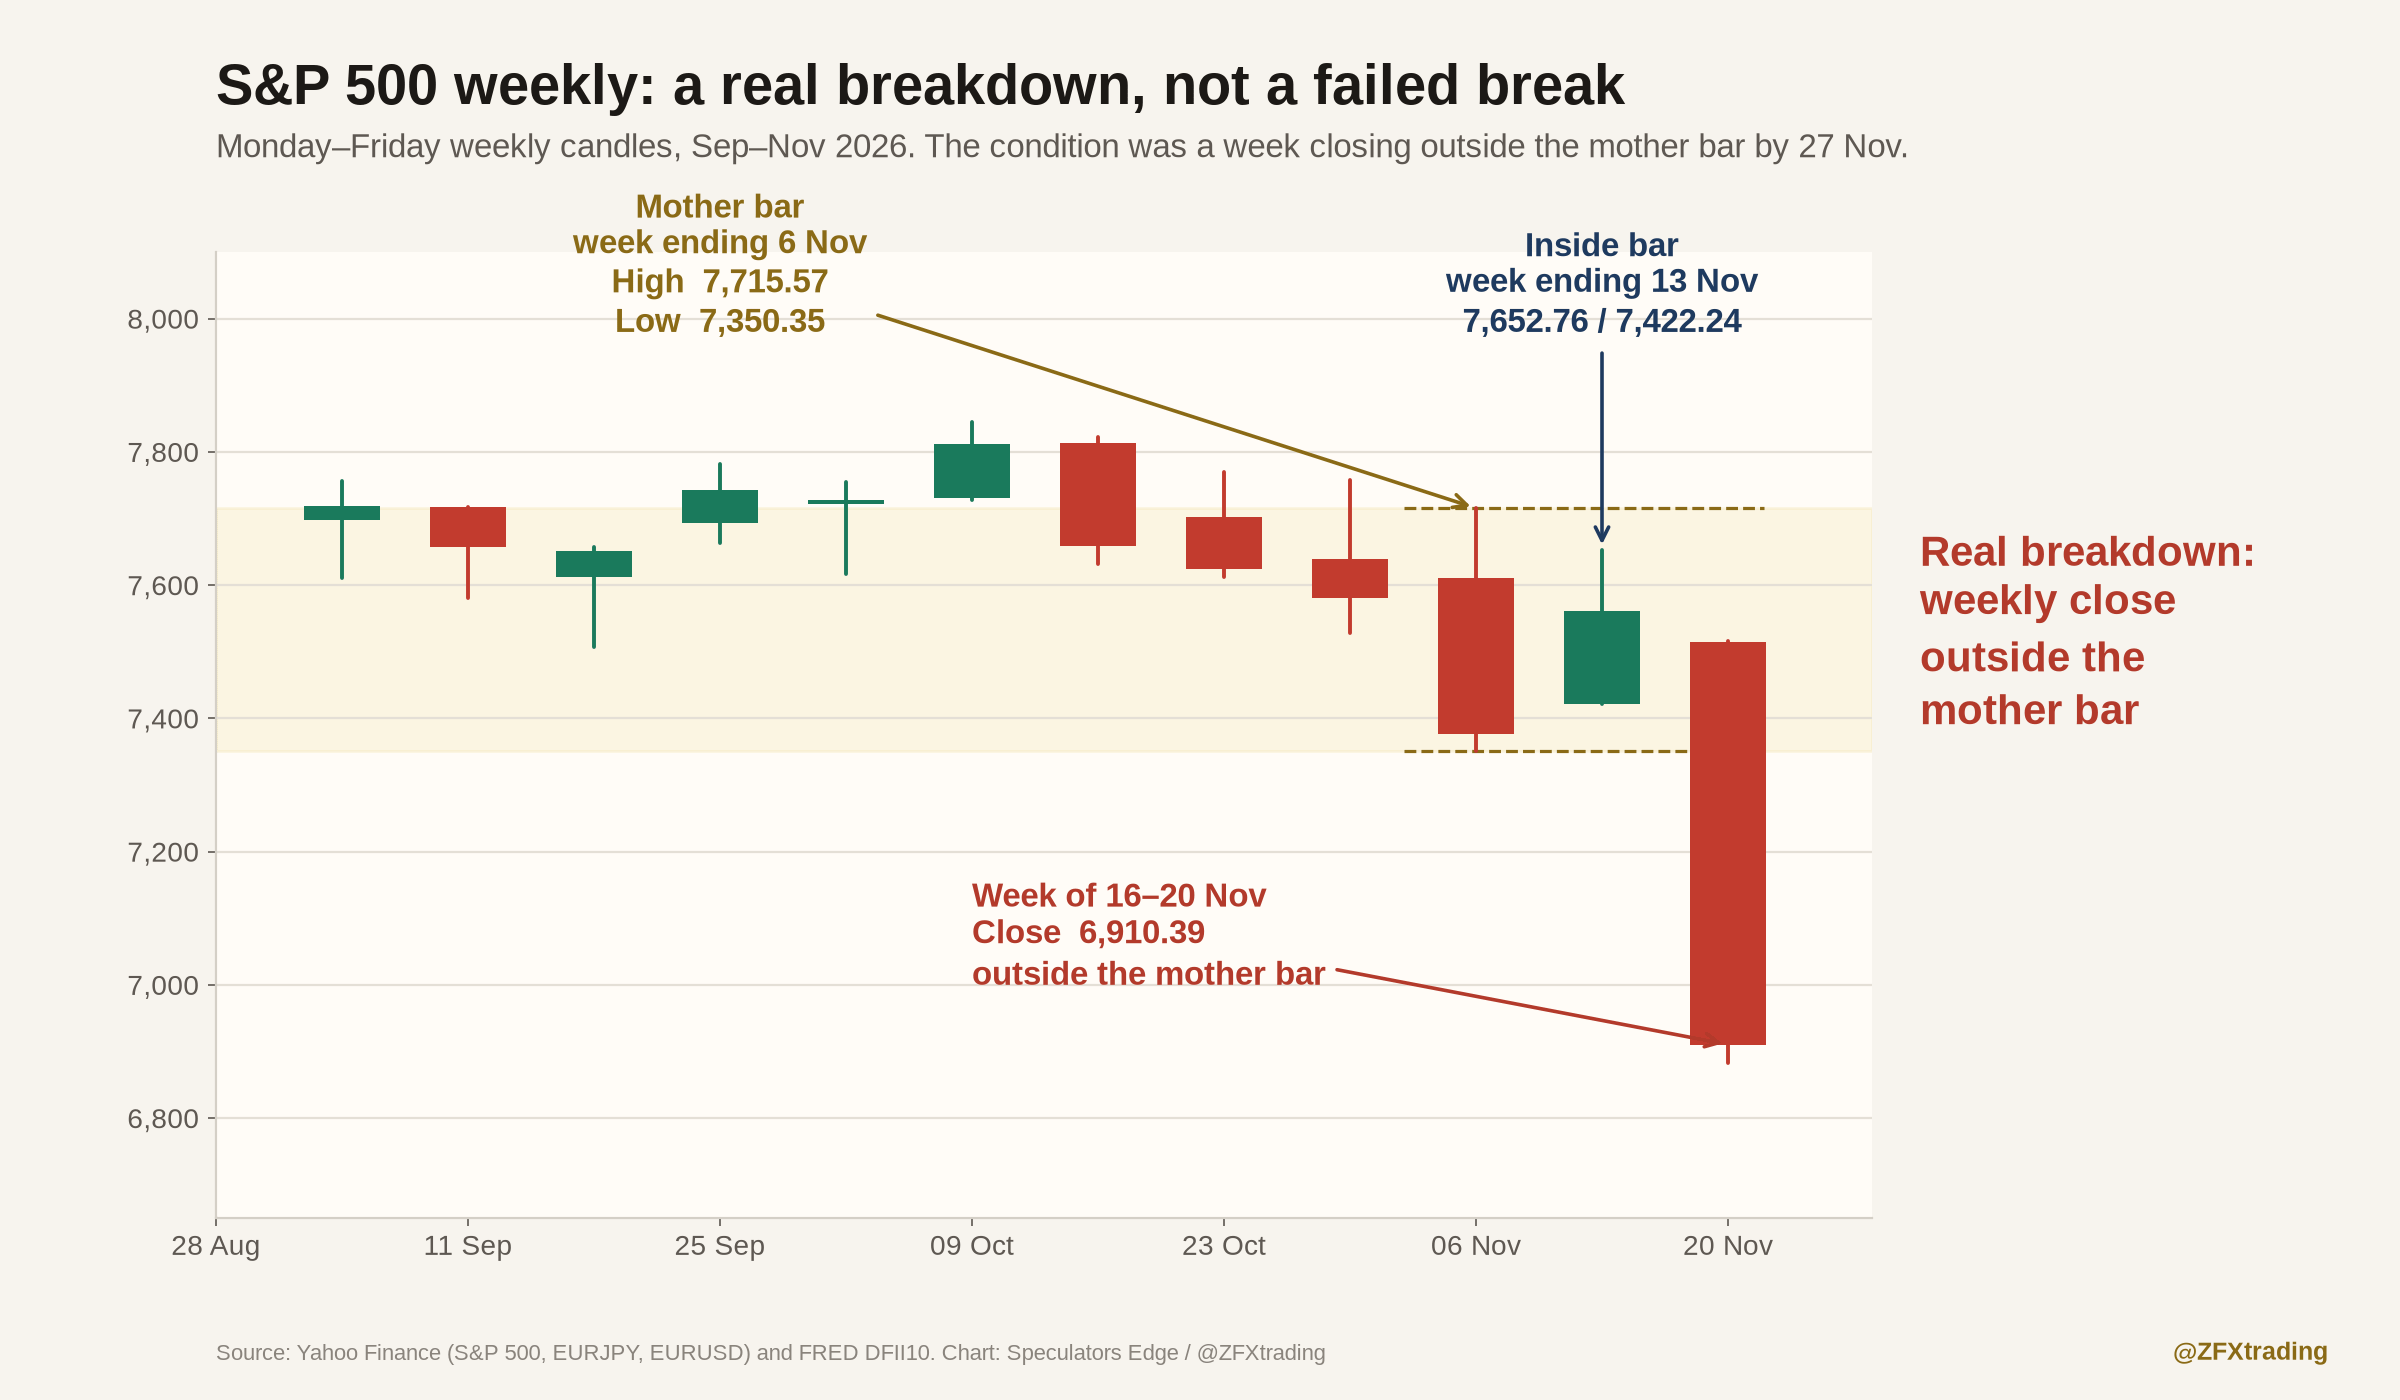
S&P 500 weekly inside bar (15 Nov): the week of 16–20 Nov broke below the inside bar and the mother bar low at 7,350.35, and closed outside it at 6,910.39. That was a real breakdown, not a failed break, so the condition we set (a week closing outside the mother bar by 27 Nov) was met on the downside.
Three posts, three conditions met. The S&P has already turned. That is one half of the engine above.
S&P 500, SPY, TLT, VIX, VIX3M, EURJPY, EURUSD and GBPUSD from Yahoo Finance, latest daily close 20 Nov 2026 (hourly for the London Fix). US 10-year real yield from FRED DFII10, latest 19 Nov 2026. SPY/TLT uses adjusted closes. A futures chart will differ slightly. Checked 22 Nov 2026.
The last item on any map: you
Many traders think the goal is to remove emotion. That is wrong. Without emotion, you cannot make any decisions.
The skill is to reappraise it. Feel anxious and want to buy a dip that keeps dipping? Use that anxiety as a signal that the market may not have bottomed yet. Feel super greedy in a winner? Recognise the market may be overextended, and don’t let a winning trade turn into a loser.
Mark the dates. Watch whether real yields join this. Be ready.
Reply and tell us whether you think real yields start to dive from here. We read every reply.
To Your Trading Success, Miad
Education only, not investment advice. Trading carries a risk of loss, and you can lose more than you expect. Past patterns don’t guarantee future results.