

Sideways Strategy Guide: BTC Setups, ETH Ranges & Equity Reversions

✍️ Executive Summary
In this midweek livestream, we dove into the current market landscape, emphasizing that August 2025 is shaping up to be a relatively unexciting period for financial markets, making it an ideal time to focus on education, skill-sharpening, trade journaling, and even enjoying the summer outdoors before volatility ramps up in September.
The discussion centered on key setups across asset classes, starting with Bitcoin (BTCUSD), where a straightforward inside two-week candle setup highlights sideways action since May 2025, with critical support at the previous all-time high around $109,588 and a newly developed support zone at $105,100 the July monthly low. As long as Bitcoin holds above this level, the environment remains bullish on higher time frames like weekly, two-week, and monthly charts, discouraging any short positions. We explored the importance of the $107,000 S/R level as a retest point, noting how untapped daily candle lows could serve as cannon fodder for big players to target stops before hitting the core support. A break below $105,100 swing low would trigger shorts on weekly and monthly charts, potentially repricing the market toward $98,000 and $93,000, echoing past instances where breaching previous monthly lows led to one or two months of selling.
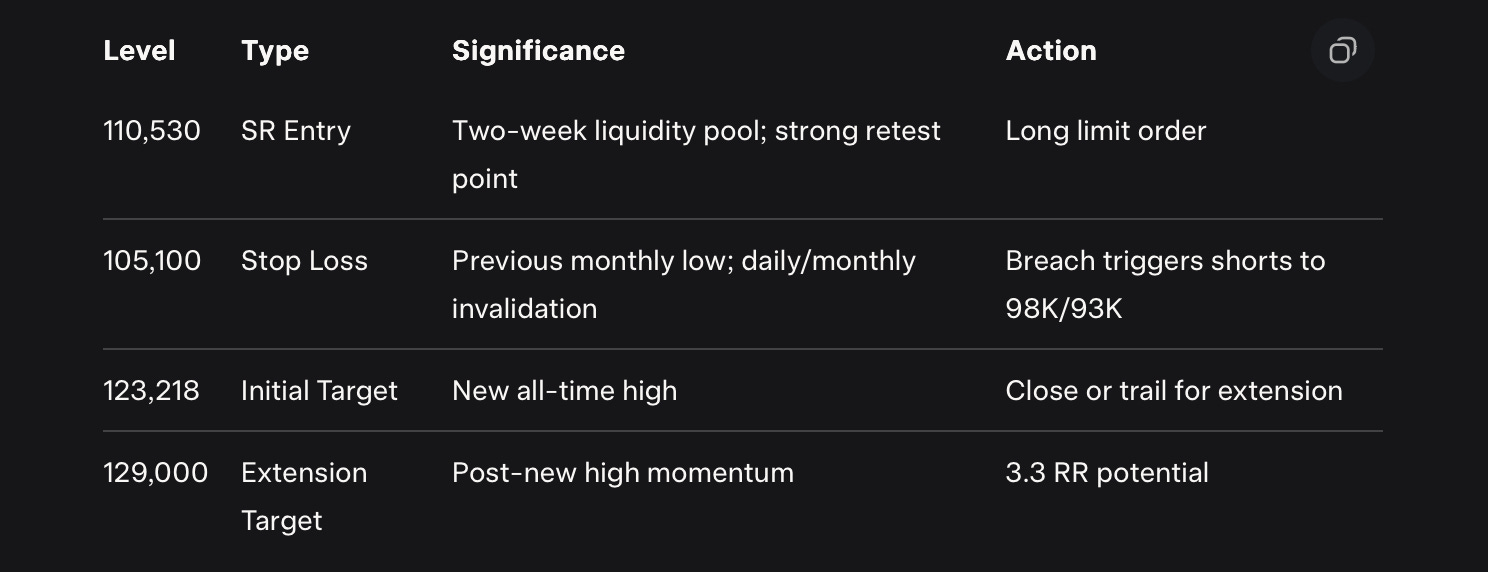
The proposed long setup at $110,530 with a stop at $105,100 targets $123,218 initially, offering a risk-reward ratio over 2.3 R/R, potentially extending to $129,000 for 3.3 R/R once new all-time highs are made.
Shifting to MicroStrategy (MSTR) as a Bitcoin proxy, concerns arise from its Inside Monthly Candle Failure after taking a major monthly high, signaling potential downside that could drag Bitcoin lower. MSTR's series of lower highs and lower lows post-uptrend, with a key higher low at $358, suggests a bearish market structure shift if breached, likely leading to bounces forming lower highs and further downside to fill open gaps, though not a full bear market just macro consolidation. Historical correlations show MSTR's moves preceding Bitcoin's, like divergences in lows (e.g., MSTR's higher low vs. Bitcoin's lower low in March) signaling rallies, or MSTR's lower highs foreshadowing Bitcoin tops despite Bitcoin's new highs.
For Ethereum, weekly resistance at last week's bearish order block around $3684, combined with overshoots from enthusiastic leveraged bounces, points to consolidation within a macro range, rejecting at the macro 25% Range level and potentially pulling back to the midpoint at $2873 for optimal spot entries into 2026. This aligns with a higher time frame triangle in formation, where multi-year consolidation tagged lower and upper trend lines, favoring patience for price to come down and retest supports over taking low probability longs at resistance. Past S/R levels at $3870 held as pain points for 1.5 years, necessitating healthy pullbacks for energy buildup before breakouts, likely in October-November.
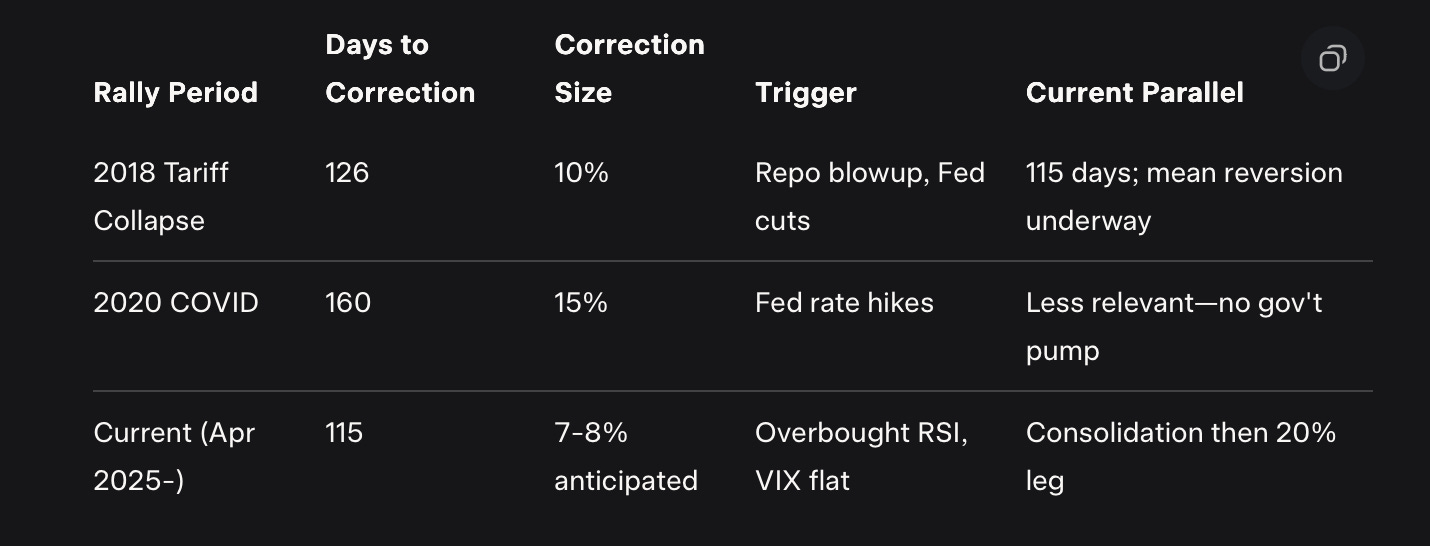
In equities, S&P 500 faces a weekly bearish order block at trend line resistance, signaling potential mean reversion after a 33% rally from April 2025 lows over 115 days, paralleling the 2018 tariff collapse rally (126 days rally before 10% correction) more than the government-fueled COVID rally (160 days rally before 15% correction). VIX flatlining suggests complacency in positioning amongst speculative trading, with gaps at 6,000 as buy zones for six-month calls positioning into 2026.
NASDAQ correlations with Microsoft (overbought weekly RSI, no pullbacks since April) and Netflix (inside two-month candle signaling pullbacks) indicate impending 10-15% corrections, as seen in 2020 when Microsoft snaps led to NASDAQ consolidations. Zero-dated call options are instrumental in driving violent short squeezes, but expiration dates cause mean reversions. Other setups include Tesla's double Inside Four-month candle for explosive breakouts to new highs amid AI integrations like self-driving and RoboTaxi.
💡 Actionable insights abound:
For Bitcoin, frame longs with precise entries at Daily S/R levels of 112k and 110k to target 3+ R/R;
Ethereum has two major S/R levels which offer strong inflection points- 3330$ (Yearly Open) and 2830$ (Major monthly S/R)
Equities demand patience for mean reversions, buying dips in AI leaders like Microsoft (10% corrections to leap calls) and Tesla (far OTM calls for 400$ strike, when stock undergoes a pullback to $270).
Risks include MSTR drags on crypto, unpriced catalysts cracking NASDAQ components, but opportunities lie in consolidations building energy for 2026 trends.
🧐 What does this mean for your portfolio? :
Are you positioned to capitalize on these setups, or will sideways August catch you unprepared?
Historical parallels like 2018's 126-day rally before 10% correction vs. current 115-day stretch — underscore the need for vigilance, as mean reversions often kickstart from overbought conditions, very rarely the market continuous in an endless straight-line upward trend.
Key Takeaways: Hold Bitcoin above 105,100 for bullish bias; watch MSTR for crypto downside signals; Ethereum to $2,800 for spot buys; S&P to 6,000 gaps as entries; NASDAQ corrections via Microsoft/Netflix proxies; buy Tesla on coiled patterns for 60-100%+ rallies.
📊 Bitcoin Trade Setup and Market Analysis
Since May 2025, Bitcoin has largely traded sideways, with initial upward momentum giving way to six weeks of consolidation before a brief uptick above All Time Highs and now a retest of key S/R levels ($110,000 and $112,000). This pinning to support underscores a lack of directional conviction until September or October, when trending environments are expected to resume for crypto broadly.
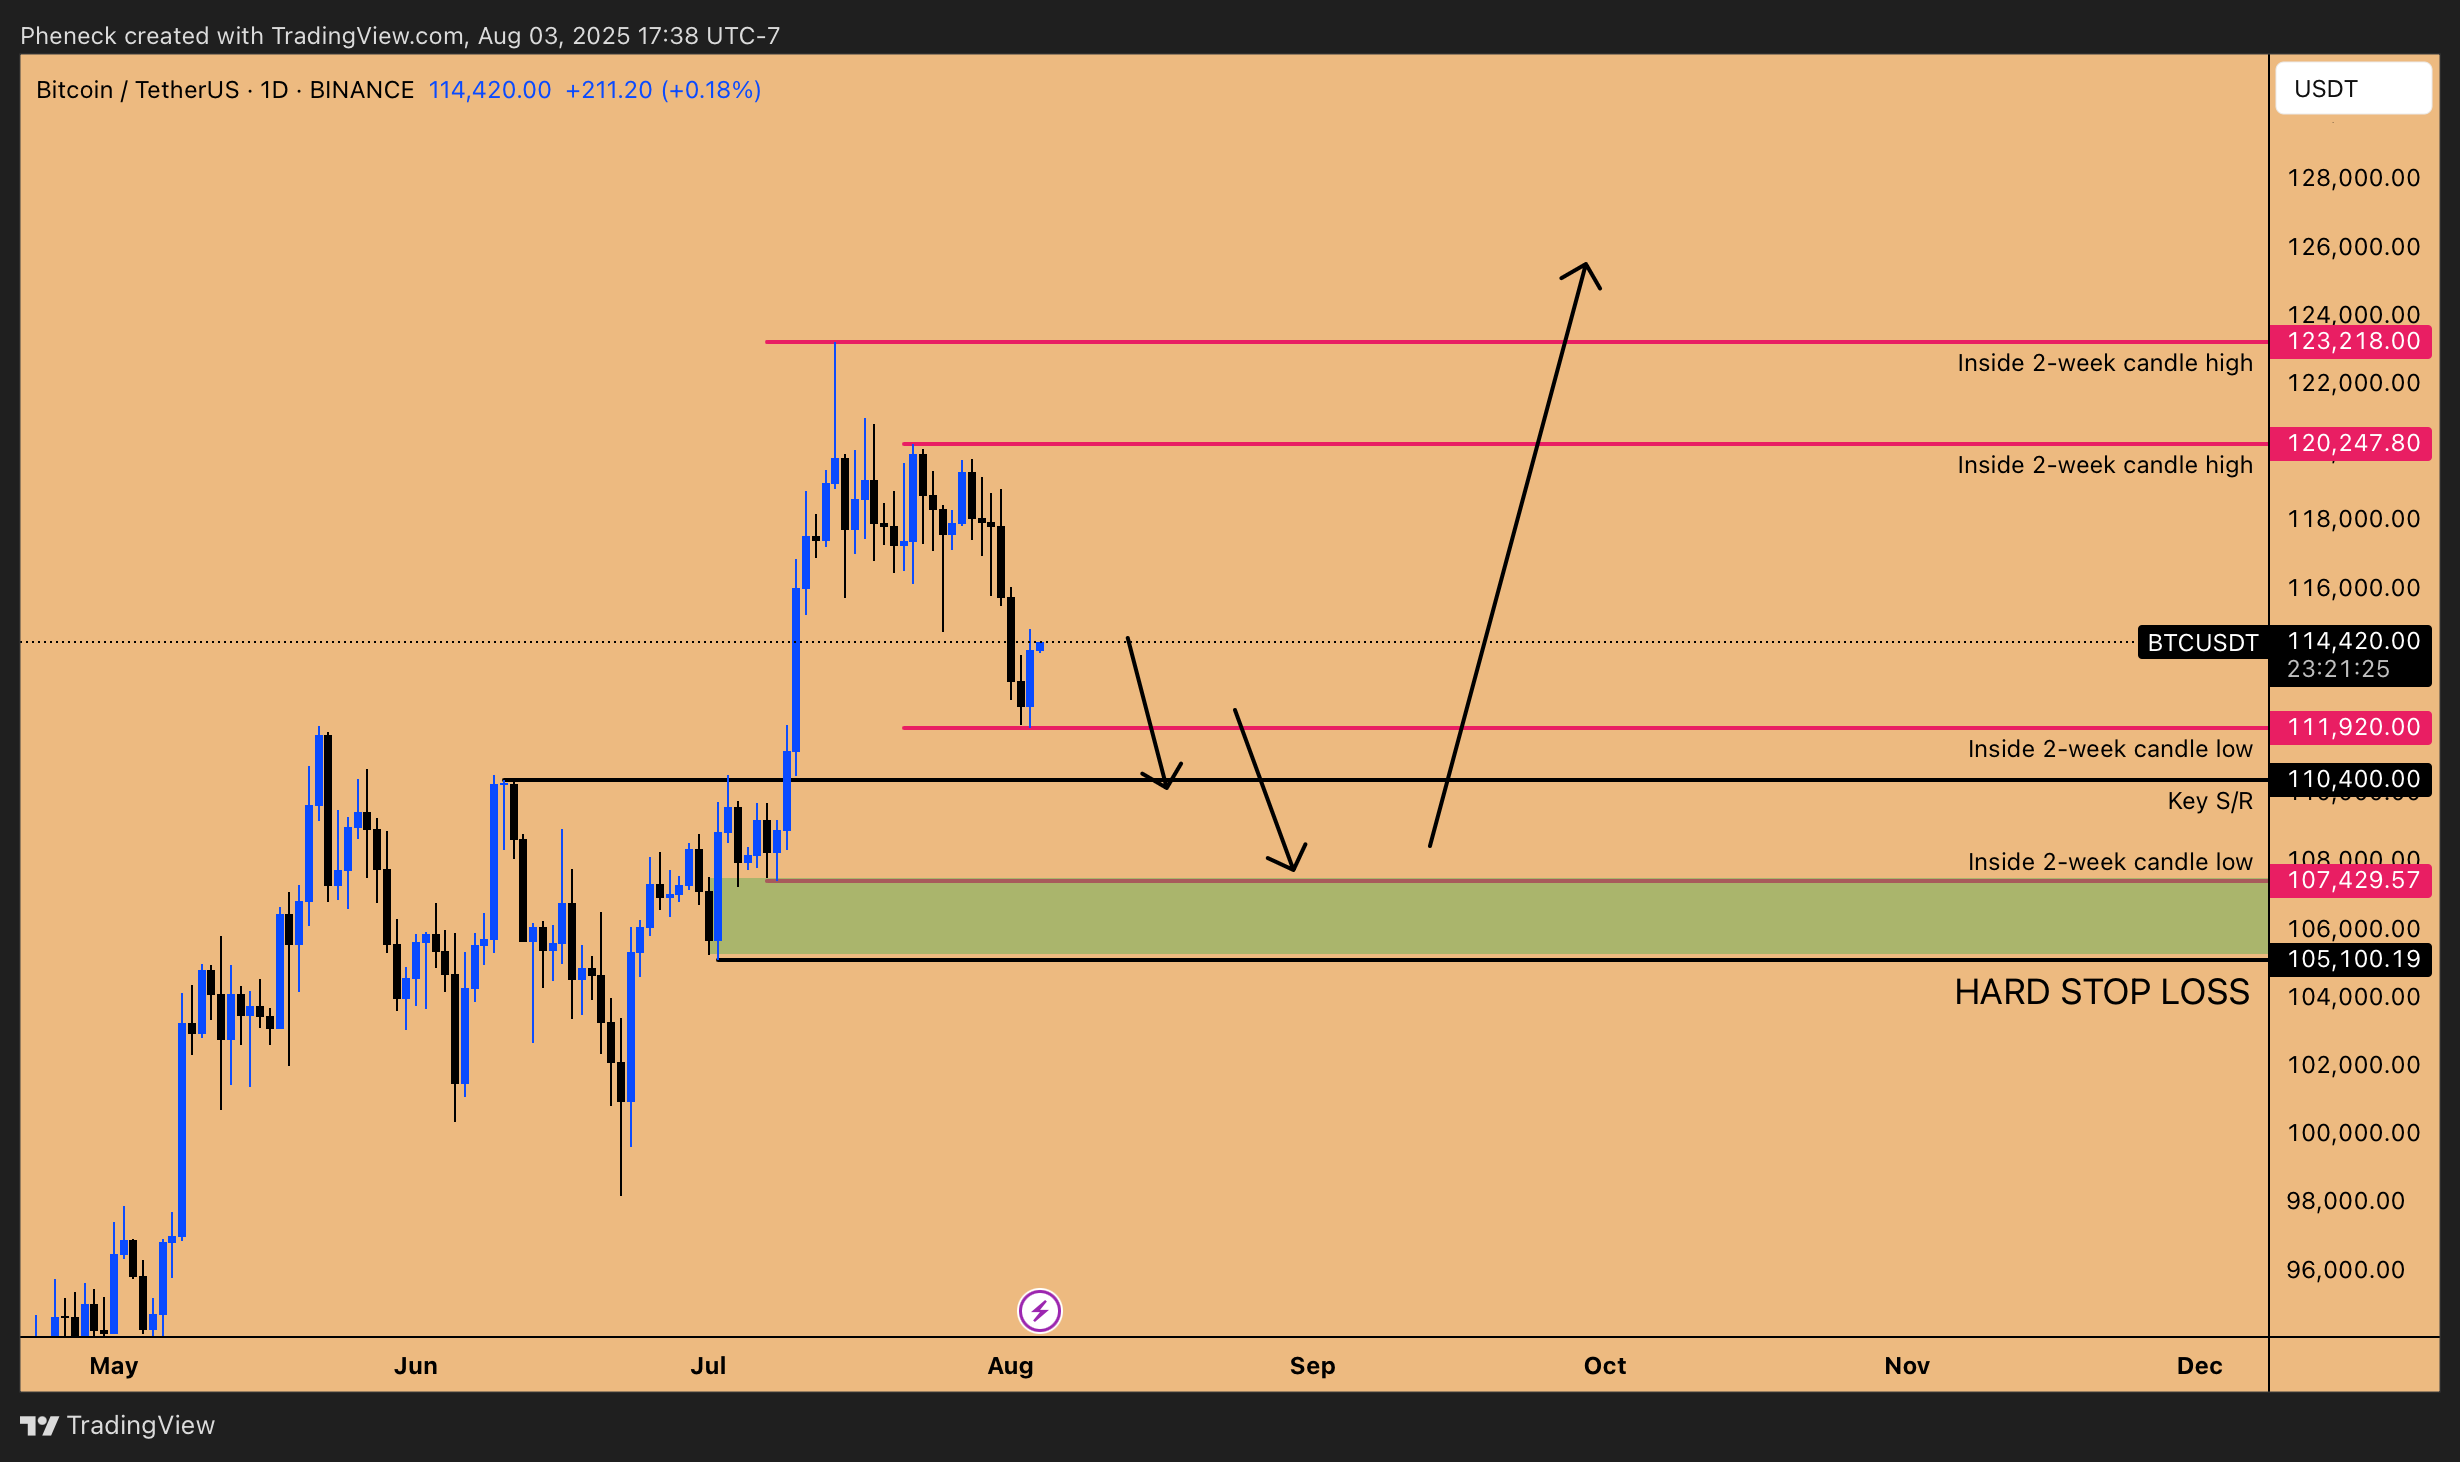
Figure 1: Inside 2-week candle setup in BTCUSD
Inside Two-Week Candle and Sideways Action
The inside two-week candle highlights Bitcoin's stagnation, trading above the previous all-time high at 109,588, which maintains a bullish outlook. From May 2025, the market appeared "amazing, with things just going higher and higher every week," but subsequent action has been predominantly sideways, including six weeks of flat trading followed by an up move and current retest. This retest hasn't involved significant time away from the level, raising concerns it could persist sideways through August into September. For traders, this means avoiding aggressive positions until clearer triggers emerge, focusing instead on education and edge refinement during this lull. What if it breaks down? The key is recognizing that as long as the newly developed support zone holds, the environment stays bullish, prohibiting shorts. This zone, visible on the two-week chart, aligns with higher time frame structures where breaches could signal macro consolidations or pullbacks.
Critical Support Zones and S/R Levels
Diving deeper, the weekly chart delineates a bullish order block from a key down candle, serving as higher time frame support. On the daily chart, this translates to a region around the July monthly open (107,000$, green zone), where a formed bullish order block must hold. Breaking this daily support would foreshadow a weekly breach, making the $107,000 SR level crucial previously defended as resistance before a massive downturn, enhancing its power on retest. However, the current dip isn't a proper retest, as daily candle lows remain untapped, creating "cannon fodder" for big players to target stops into the core support (107,000$ - 110,000$). On the monthly chart, the low of previous month at 105,000$ is of extreme importance; breaching it would trigger shorts on weekly and monthly time frames, repricing toward $98,000 and $93,000.
Past examples illustrate this: breaking previous monthly lows often led to "one or two months worth of selling to the downside," avoiding macro pullbacks requires holding 105,000 intact "it is not allowed" to breach.
The 110,000 SR level stands as a strong entry point, with a limit order already placed for long positions entry, as discussed in our Discord Community Server.
⚖️ Trade Framing and Risk-Reward
The Proposed Swing Long:
Enter at $110,530, stop at $105,100, initial target $123,218 (new all-time high), with potential extension to $129,000 for 3.3 Risk/Reward on longs.
Focus on execution first:
"We do not have to speculate on how far it is going to go. We focus more on getting the execution first, like getting in the position first." Recent timing captured the bottom bounce to top, but the new pattern demands waiting for triggers amid pullbacks. For traders, this setup offers high-probability swings in a sideways market, capitalizing on structure being respected.
Key Takeaways:
Maintain bullish bias above $105,100; no shorts entertained.
Sideways likely until October; use for edge sharpening.
Historical monthly low breaches lead to extended selling—hold this level to avoid.
MSTR as a Proxy for Bitcoin and Market Concerns
MicroStrategy (MSTR) serves as a key proxy for Bitcoin, with their movements tightly correlated major swings in crypto often stem from MSTR's direction. Recent action shows MSTR taking a major monthly high, forming an inside monthly candle failure with liquidity plays suggesting downside, which could pressure Bitcoin similarly.
Market Structure Shift on MSTR
Post-uptrend, MSTR has printed lower highs and lower lows, not ideal for bulls. From bottoms, it formed higher lows until breaches confirmed shifts: e.g., higher low breaches led to lower highs, resistance faces, and further downs. The nearest higher low at 358 is pivotal if broken, it confirms a lower high relative to the major high, setting up lower lows and bearish shifts. Anticipate bounces to lower highs, then more downside, as seen in past patterns where bullish turns required lower high breaks. On three-week and monthly charts, bearish setups emerge: resistance zones and inside monthly failures signal higher time frame shifts to the bear side.
Stops below $105,000 account for these gaps, avoiding placements within support zones vulnerable to fills. For Bitcoin, MSTR's pullback post-new highs suggests closing longs, as proxies like this don't decouple long-term Bitcoin may overshoot briefly but catches up.
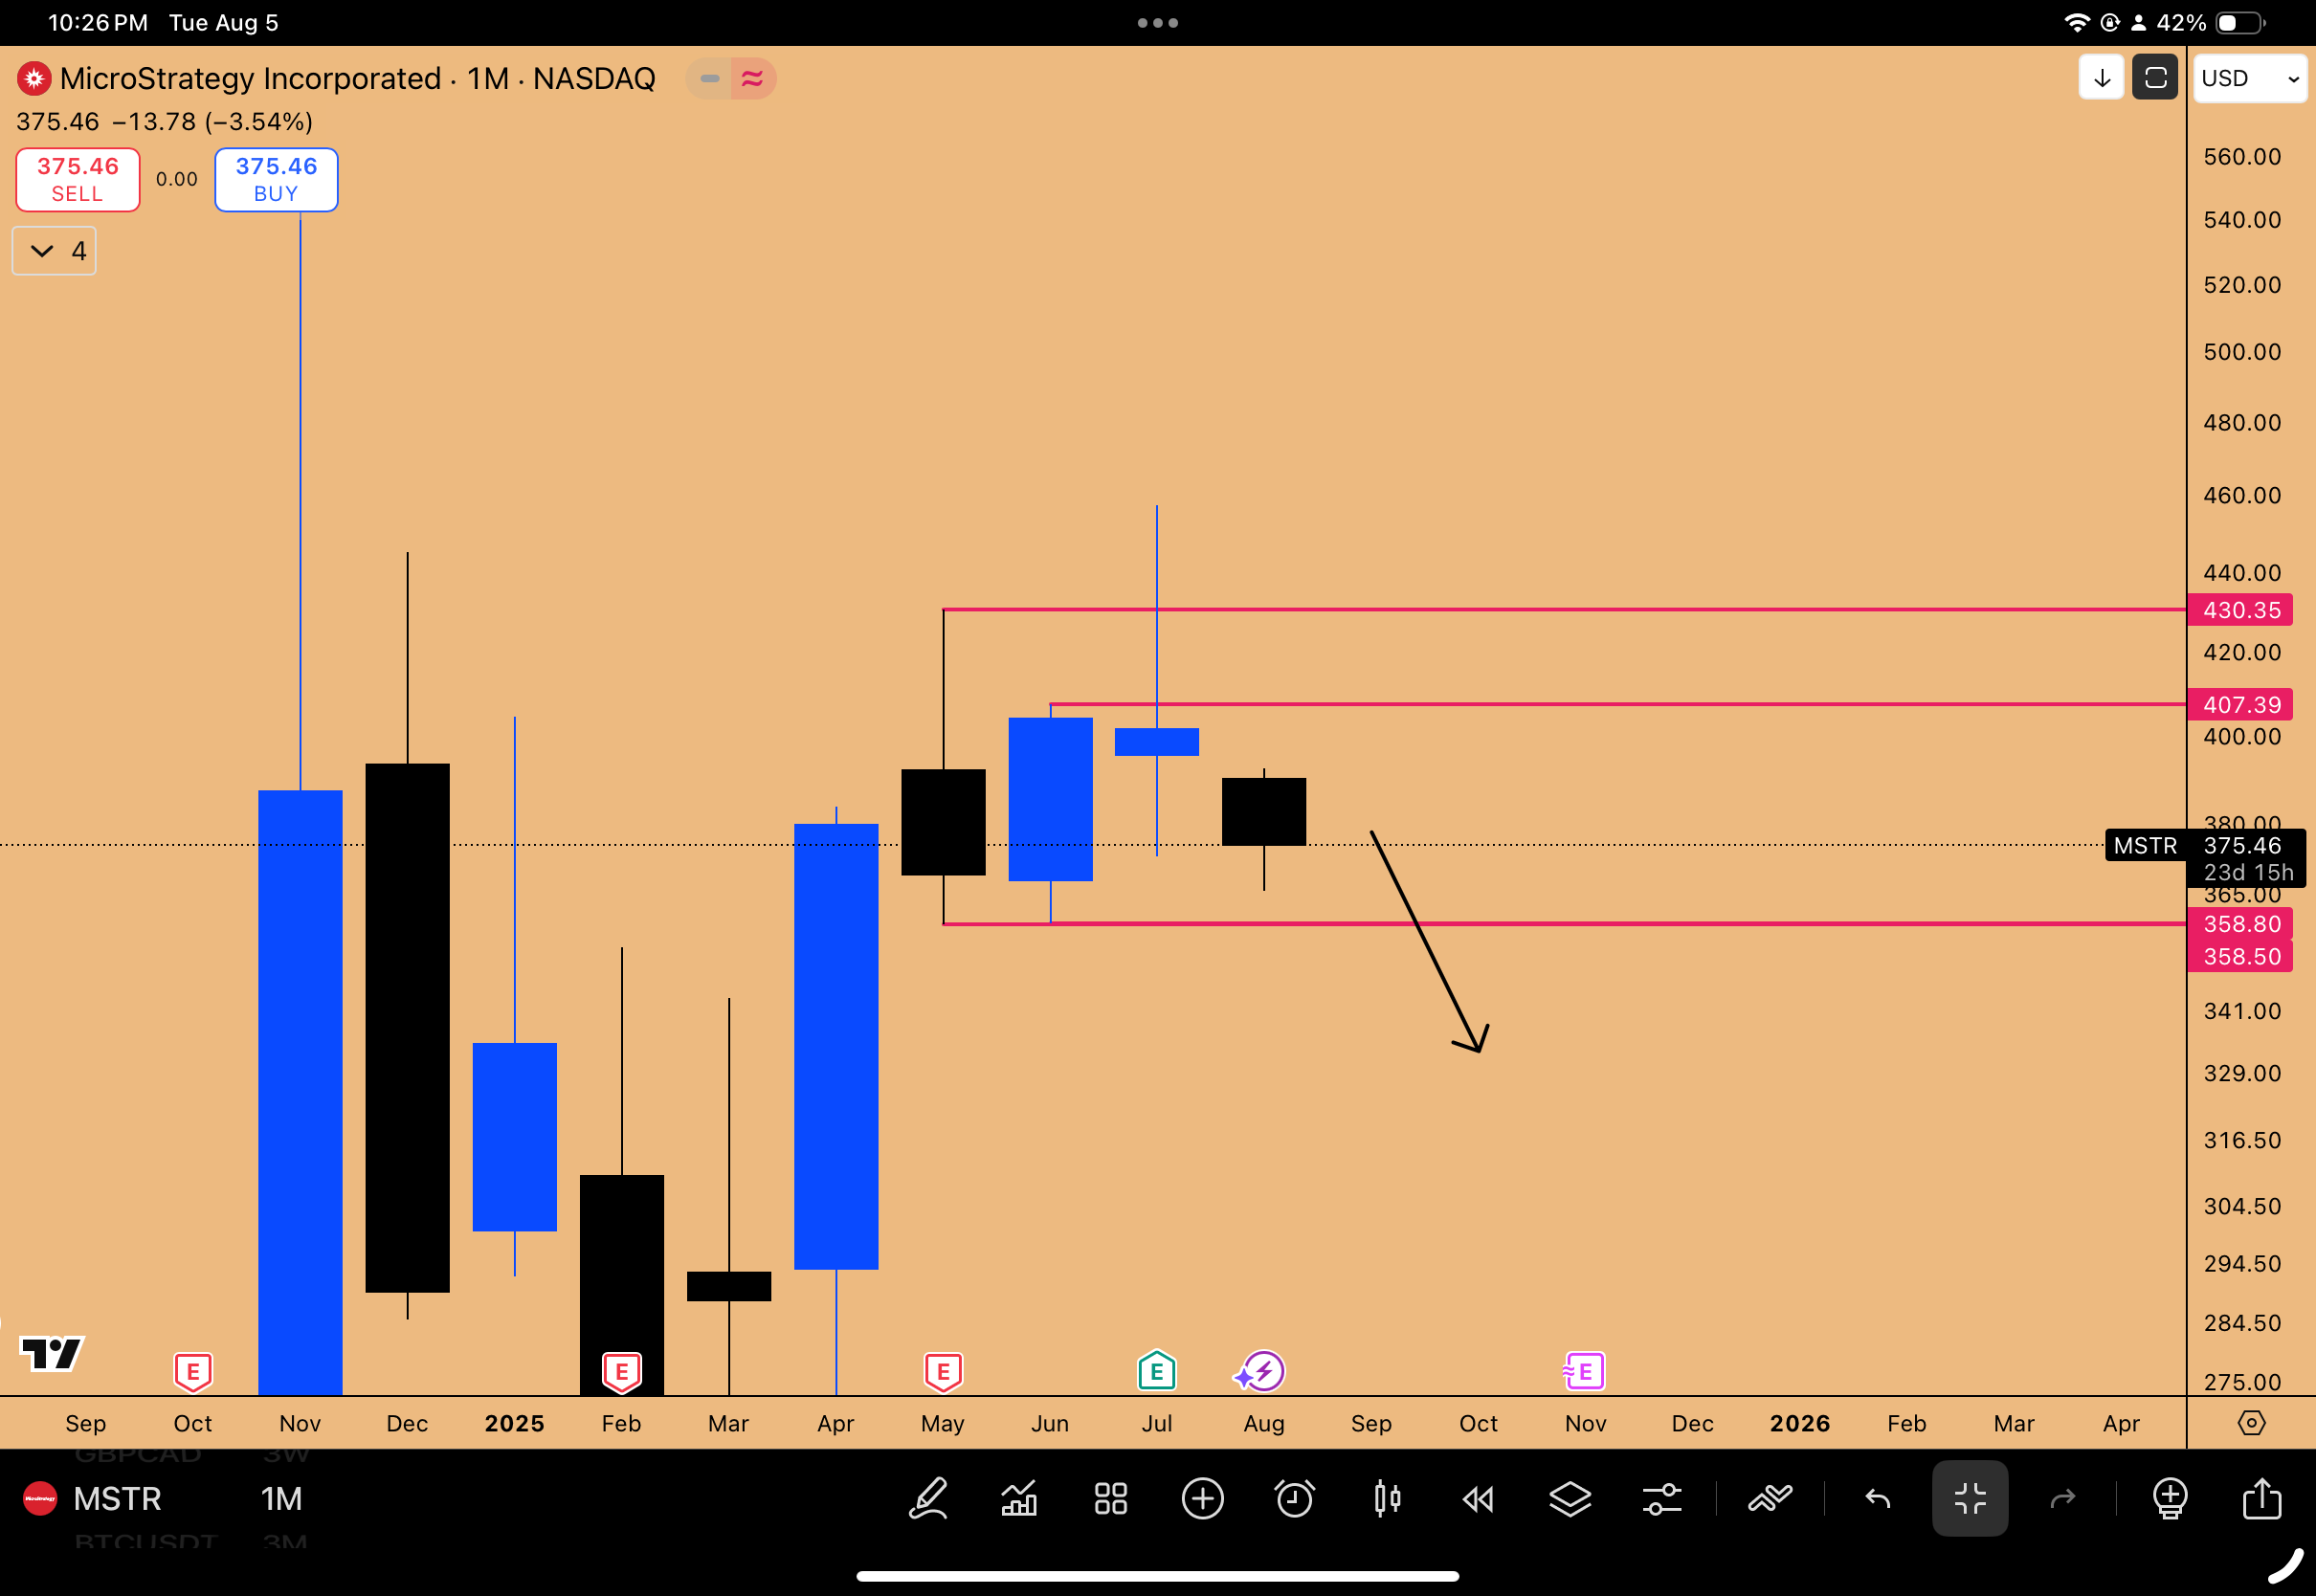
Figure 2: Inside Monthly Candle Failure on MSTR suggesting downward pressure
Key Takeaways:
MSTR downside drags Bitcoin; watch $358 break for confirmation.
Not bear market, only macro consolidation pullback to target open gaps on the downside.
Use divergences W.R.T BTCUSD for early signals of bottoming: higher lows in MSTR, while BTCUSD makes a lower low is your cue to buy Bitcoin.
Building on MSTR's proxy signals and Bitcoin's support holds, let's examine Ethereum's structure, where similar consolidation themes emerge but with range-bound opportunities.
Ethereum Market Structure and Expectations
Ethereum's weekly chart shows last week's price action forming a resistance zone, turning bounces into mere reactions amid consolidation. Overshoots from leveraged enthusiasm highlight forgotten higher time frame structures, with today's givebacks underscoring pullback potential.
Weekly Resistance and Bounce Dynamics
The bounce tagged 3684—a daily resistance from last week and inefficiency fill from open gaps in down candles, similar to Bitcoin's rejections. This aligns with weekly bearish order blocks at the 25% macro range level, where subrange midpoints (between 25% and 50%) provided support. Coiling off higher time frame SR levels shifts daily structure bearish, questioning downside depth. Anticipate retests at the macro range midpoint (2873) for sideways time, frustrating participants and offering best spot entries for 2026 bull runs.
Higher Time Frame Triangle and S/R Dynamics
This fits a multi-year triangle: consolidating, tagging lower trend lines, now upper ones—longs at resistance are unwise; wait for support. Past 1.5 years showed SR levels as pain points, holding as resistance and necessitating pullbacks for energy. Monthly lows as resistance triggered prior pullbacks; holding below current highs favors downs to $2,800 SR (past resistance breaking downside structure). Use drawn ranges from weeks ago: drops to SRs scared longs, but reactions were efficient; now, post-inefficiency tags, shorts dominate over longs.

Figure 3: Macro Range in play for ETHUSD
Key Takeaways:
Consolidation to October; range for longs/shorts.
7% moves lucrative with sizing—volatility as speed, not barrier.
Pullbacks build for 2026 breakouts; avoid resistance longs.
As Ethereum coils similarly to equities' overbought states, transitioning to indices reveals mean reversion risks paralleling historical rallies.
↔️ Indices Analysis: S&P 500 and Potential Mean Reversion
S&P 500's weekly bearish order block formed at strong trend line resistance, often overlooked amid bull enthusiasm. While support trend lines draw focus, upside assessments via correlations (Microsoft, NASDAQ) gauge 10% correction potentials, as markets don't ascend indefinitely.
Trend Line Resistance and Overbought Conditions
From April 2025 lows, a 33% rally over 115 days mirrors past signatures: VIX spikes flatten, then catalysts uptick VIX for protection buys. Two-day RSI hit 75 (overbought), falling sharply—likely bottoming oversold, filling gaps at 6,000. Buy there for six-month calls into 2026, as post-reversion bottoms (September/October) won't revisit until after runups.
Historical Parallels to Rallies and Corrections
Parallels include 2018 tariff collapse (reverse repo blowup; Fed cuts): 126-day rally before 10% correction, consolidation, then follow-through to the upside. Current 115 days rally aligns, favoring 2018 parallel over COVID-19 parallel (160 days to 15% correction; government funded trillions of $$ supporting straight-line rally up. Similar situation is absent in current environment with rates at 4.5%, no slush capital). 2018 consolidation post-rally captured 20% leg up; focus on next “Fat Pitch” to position during a potential September bottom on pullback. Post-2019 October bottoms ran five months straight-line to February 2020, which targeted 120-150 day leg for another 20% trending rally before next major pullback.
Key Takeaways:
Buy 6,000 gaps for 2026 positioning.
Parallels favor 2018: 126-day rally prior to 10% correction.
Mean reversions build consolidations for trends.
Echoing S&P's reversion themes, NASDAQ's correlations amplify via component proxies.
NASDAQ and Cross-Market Correlations
NASDAQ's monthly chart ties to Microsoft control, Yesterday's 2.3% rally (529 points) stemmed from zero-day options on QQQ ETF.
Zero-Day Options and Manipulation
Zero-day calls expire same-day, enabling hedge funds/institutions to manipulate via far OTM buys (e.g., 3-4 cents to 250% gains). Learned in 2022 bear rallies: squeezes from calls forcing dealers to buy assets. SEC 2022 policy opened to Wall Street, amplifying like BlackRock, State Street, Vanguard and other asset managers to leverage 0-dated options expiry to funnel $millions and cause the index to move 2-3% every day. FOMC hikes saw 5% up days despite bearish sentiment, options expiring the next day rescinded buying pressure, causing next-day collapses.
Microsoft and Netflix Proxies
Microsoft's straight-line since April (no pullbacks) at overbought weekly RSI risks snaps to 10-15% corrections, as in 2020 (Microsoft pullback led NASDAQ 15% down over 20 days, consolidating triangles). Three-month consolidation (August-October) builds energy for six-seven month rallies into 2026.
Netflix proxies: correlated straight-lines from October 2022; corrections mirror. Netflix up 114% vs. NASDAQ's 32% from levels, but bearish monthly blocks signal pullbacks. Netflix six down weeks warn NASDAQ catch-up via Nvidia/Microsoft cracks—unpriced catalysts needed.
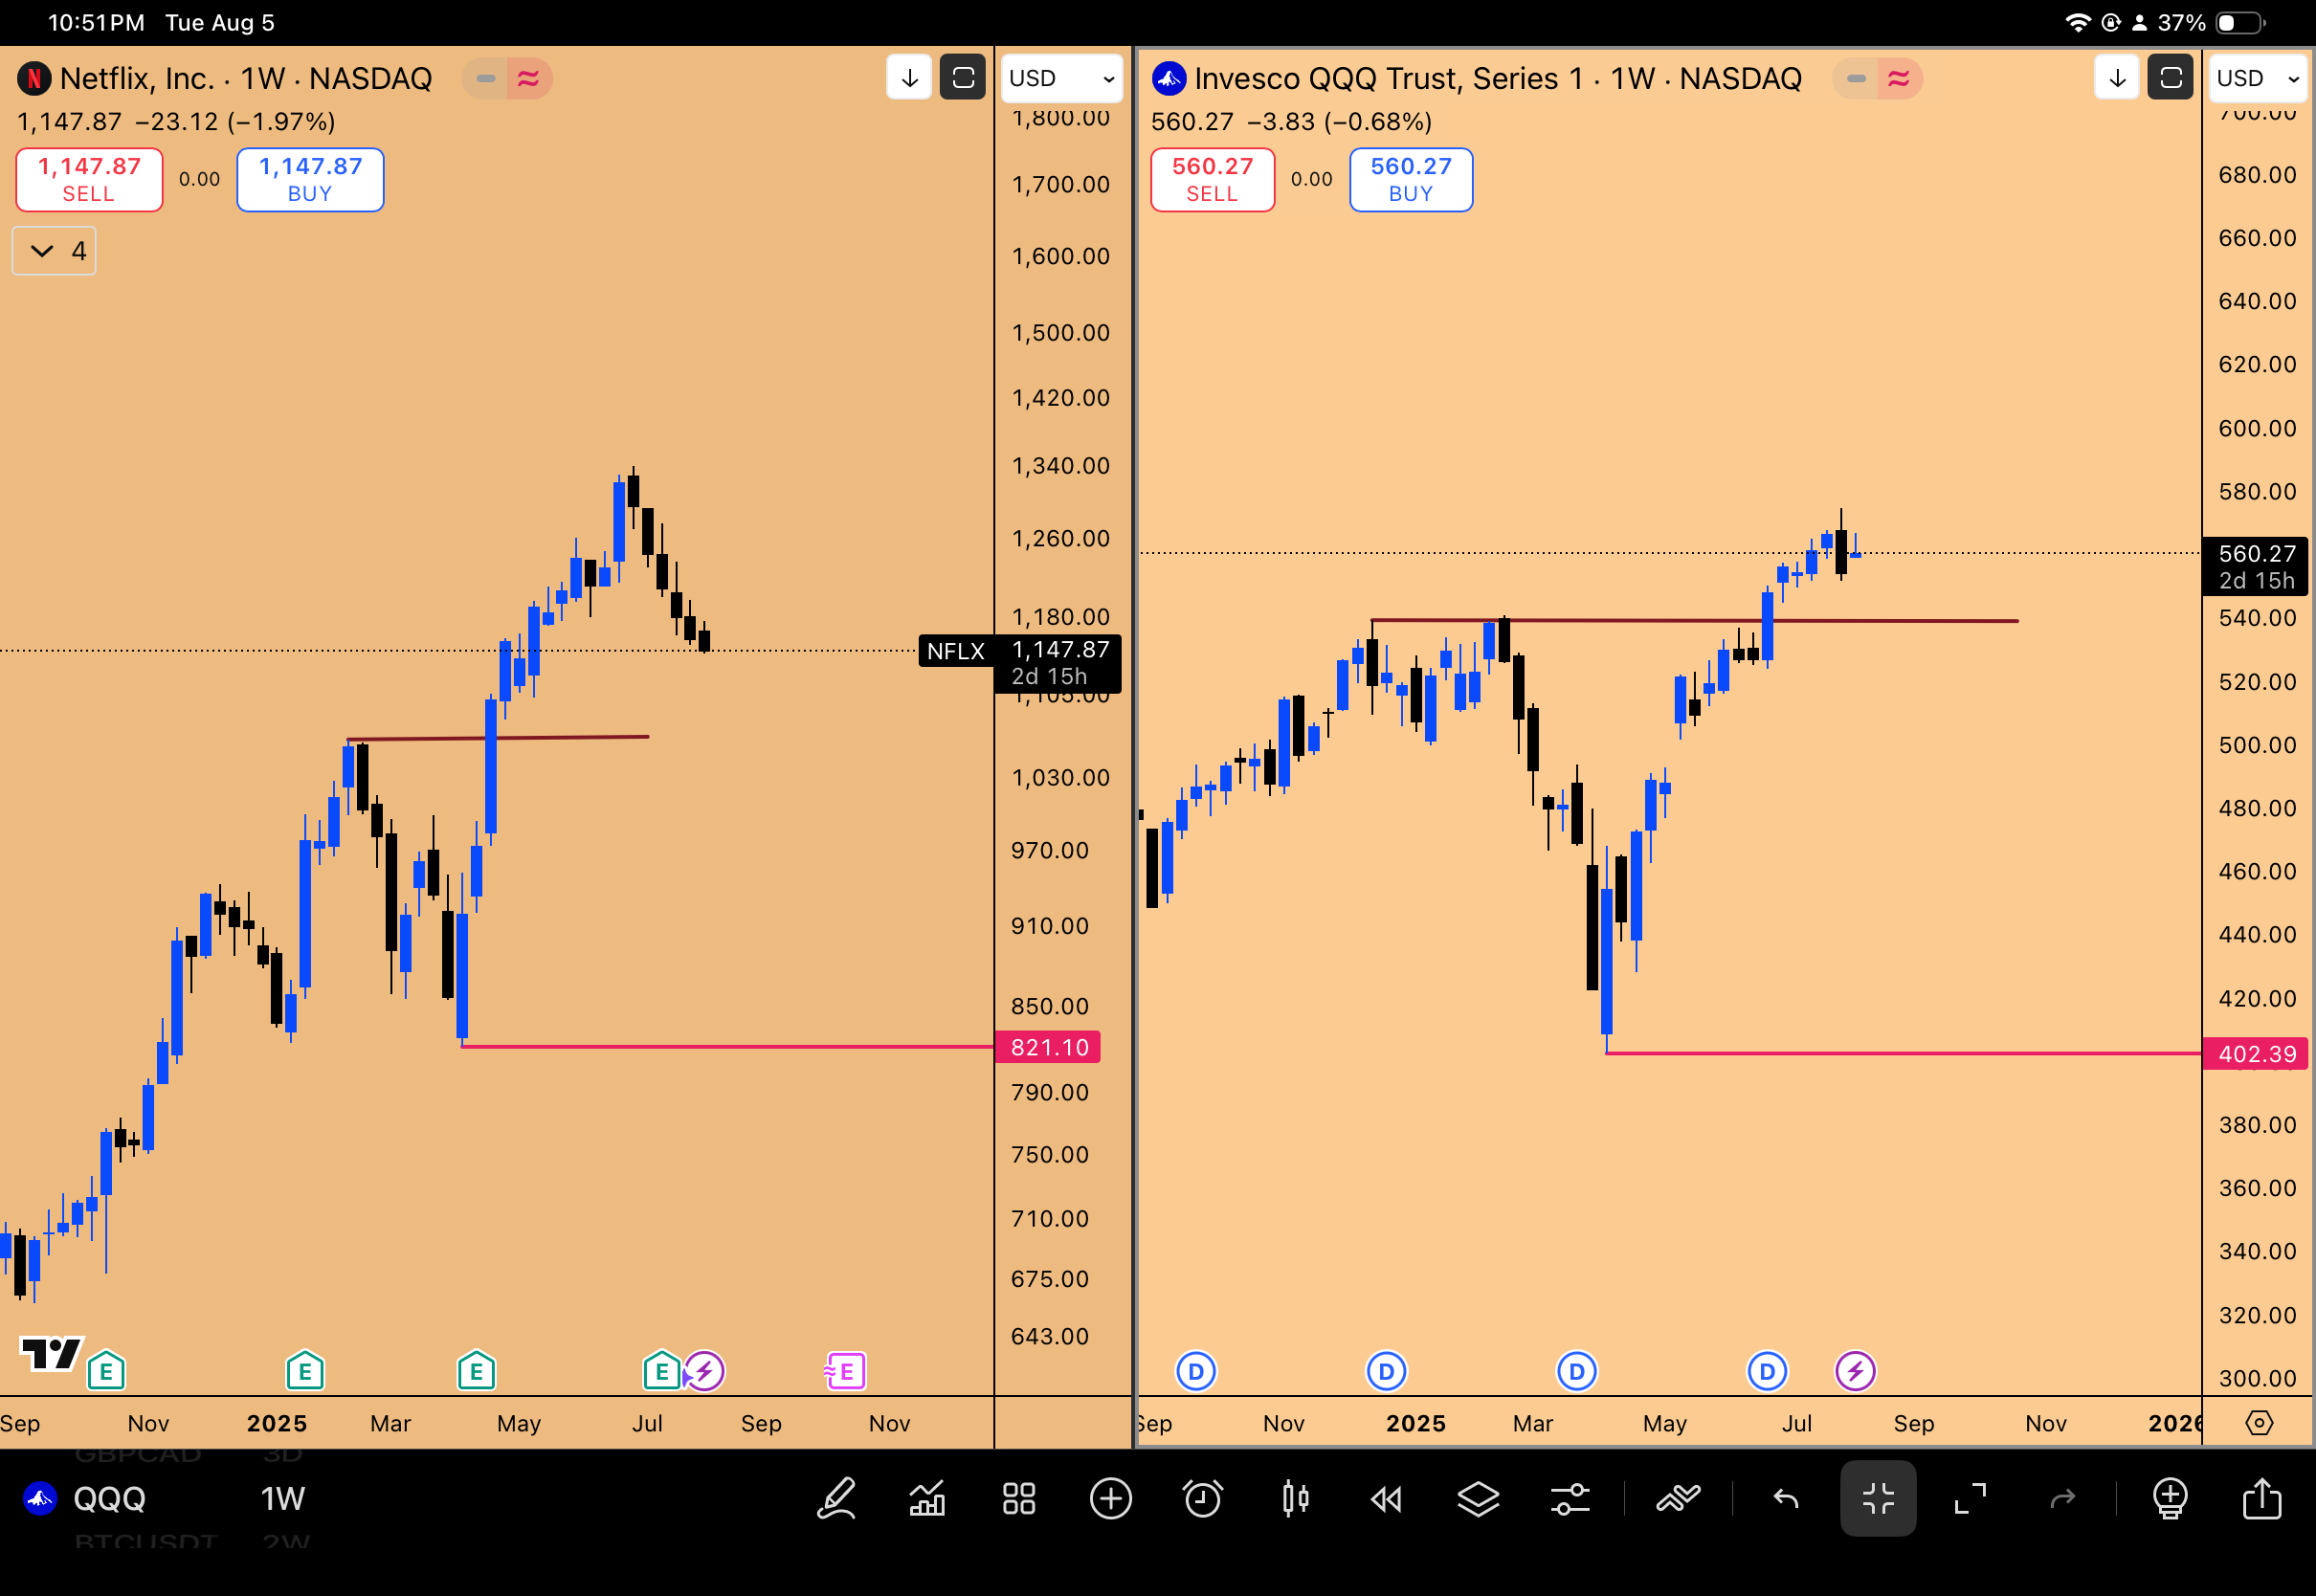
Figure 4: NFLX vs NASDAQ Index (QQQ ETF), NFLX already undergoing correction, QQQ is yet to undergo correction
Key Takeaways:
Zero-days drive squeezes; technicals preempt.
Buy Microsoft 10% dips for leaps.
Netflix foretells NASDAQ pullbacks sweep lows for longs.
Other Stocks and Trade Setups
Coinbase collapsed post-earnings, but current areas offer support for buys. Tesla's four-month chart shows double inside candles—coiled for massive breakouts to new highs, despite IV at 55 (e.g., July 2026 500 strike at 2,255/contract for 300% on 62% rally). Innovations like AI in vehicles, self-driving, RoboTaxi, Optimus cue revenue surges Q1 2026; November xAI meeting potential trigger. Costco: 11 up quarters; one down cools RSI for 2,000 targets. PLTR: 166% AI surge since April vs. Nvidia's 111%—poster child, buy corrections amid real revenue vs. 2000 speculation.
Key Takeaways:
Tesla: Buy 270 pullbacks for OTM calls.
NVDA/AMD: Real AI revolution, GPU demand from state nations in order to build their own AI technology.
Corrections differentiate from 2000 bubble, there is insane amount of cash flow behind the current AI hype, this cash flow was non-existent during 2000 bubble.
🤖📖 Recommendations on AI and Resources
The All-In podcast series on AI (Winning the AI Race Parts 1-5) offers insights: interviews with Nvidia/AMD CEOs on customers/orders/infrastructure; Trump's executive orders accelerating funding/permits. Eye-opener on government-private synergy pushing trends.
Key Takeaways and Outlook
Reiterating, August's sideways calls for education before September volatility—Bitcoin holds bullish above 105,100, with longs at 110,530 targeting 123,218 (extend to 129,000 for 3.3 RR), but MSTR's inside monthly failures and lower highs/lows signal drags, filling gaps in macro consolidations without bear markets.
Ethereum consolidates to 2,800 midpoints in triangles, building for October breakouts; ranges yield 7% dailies for gains.
S&P mean reversion possible post-115-day rally (paralleling 2018's 126 days to 10% correction vs. COVID's 160 days/15%), filling 6,000 gaps for 2026 buys.
NASDAQ faces 10-15% via Microsoft correction from overbought levels and Netflix proxies (inside two-month candle in formation), driven by zero-day manipulations.
Stocks like Tesla's coiled massively in the form of Inside 4-monthly candle. Could potentially witness 62-100% rallies amid AI (self-driving/Optimus) revolution.
Risks: MSTR pressures, unpriced catalysts cracking proxies, but opportunities in pullbacks for 2026 trends—120-150 day legs post-consolidations. As we head into low volatility August month, watch supports like Bitcoin at 110K and Ethereum at $3370, S&P 6K for entries. What's your take on these setups? Share in the comments—let's discuss strategies.
Disclaimer: This isn't financial advice – just market musings from the charts. Always do your own research.
If you enjoyed this deep dive, please share it with fellow traders!