The 2026 Equities Roadmap: Microsoft’s Volatility Box, Amazon's Robotics Revolution, and Strategic Index Correlations

Executive Summary
Welcome to the definitive breakdown of the early 2026 market landscape. This analysis is built on a top-down philosophy, beginning with the macro-structure of the major indices and distilling those insights into surgical positions within individual equities. The core thesis of this cycle is clear: the market is currently in a state of bullish consolidation, and the skepticism surrounding the S&P 500’s climb to 6932 is a psychological fallacy. While many traders fear a “sell-off” at every minor gyration, the market structure remains stubbornly intact, defined by a series of higher lows and higher highs.
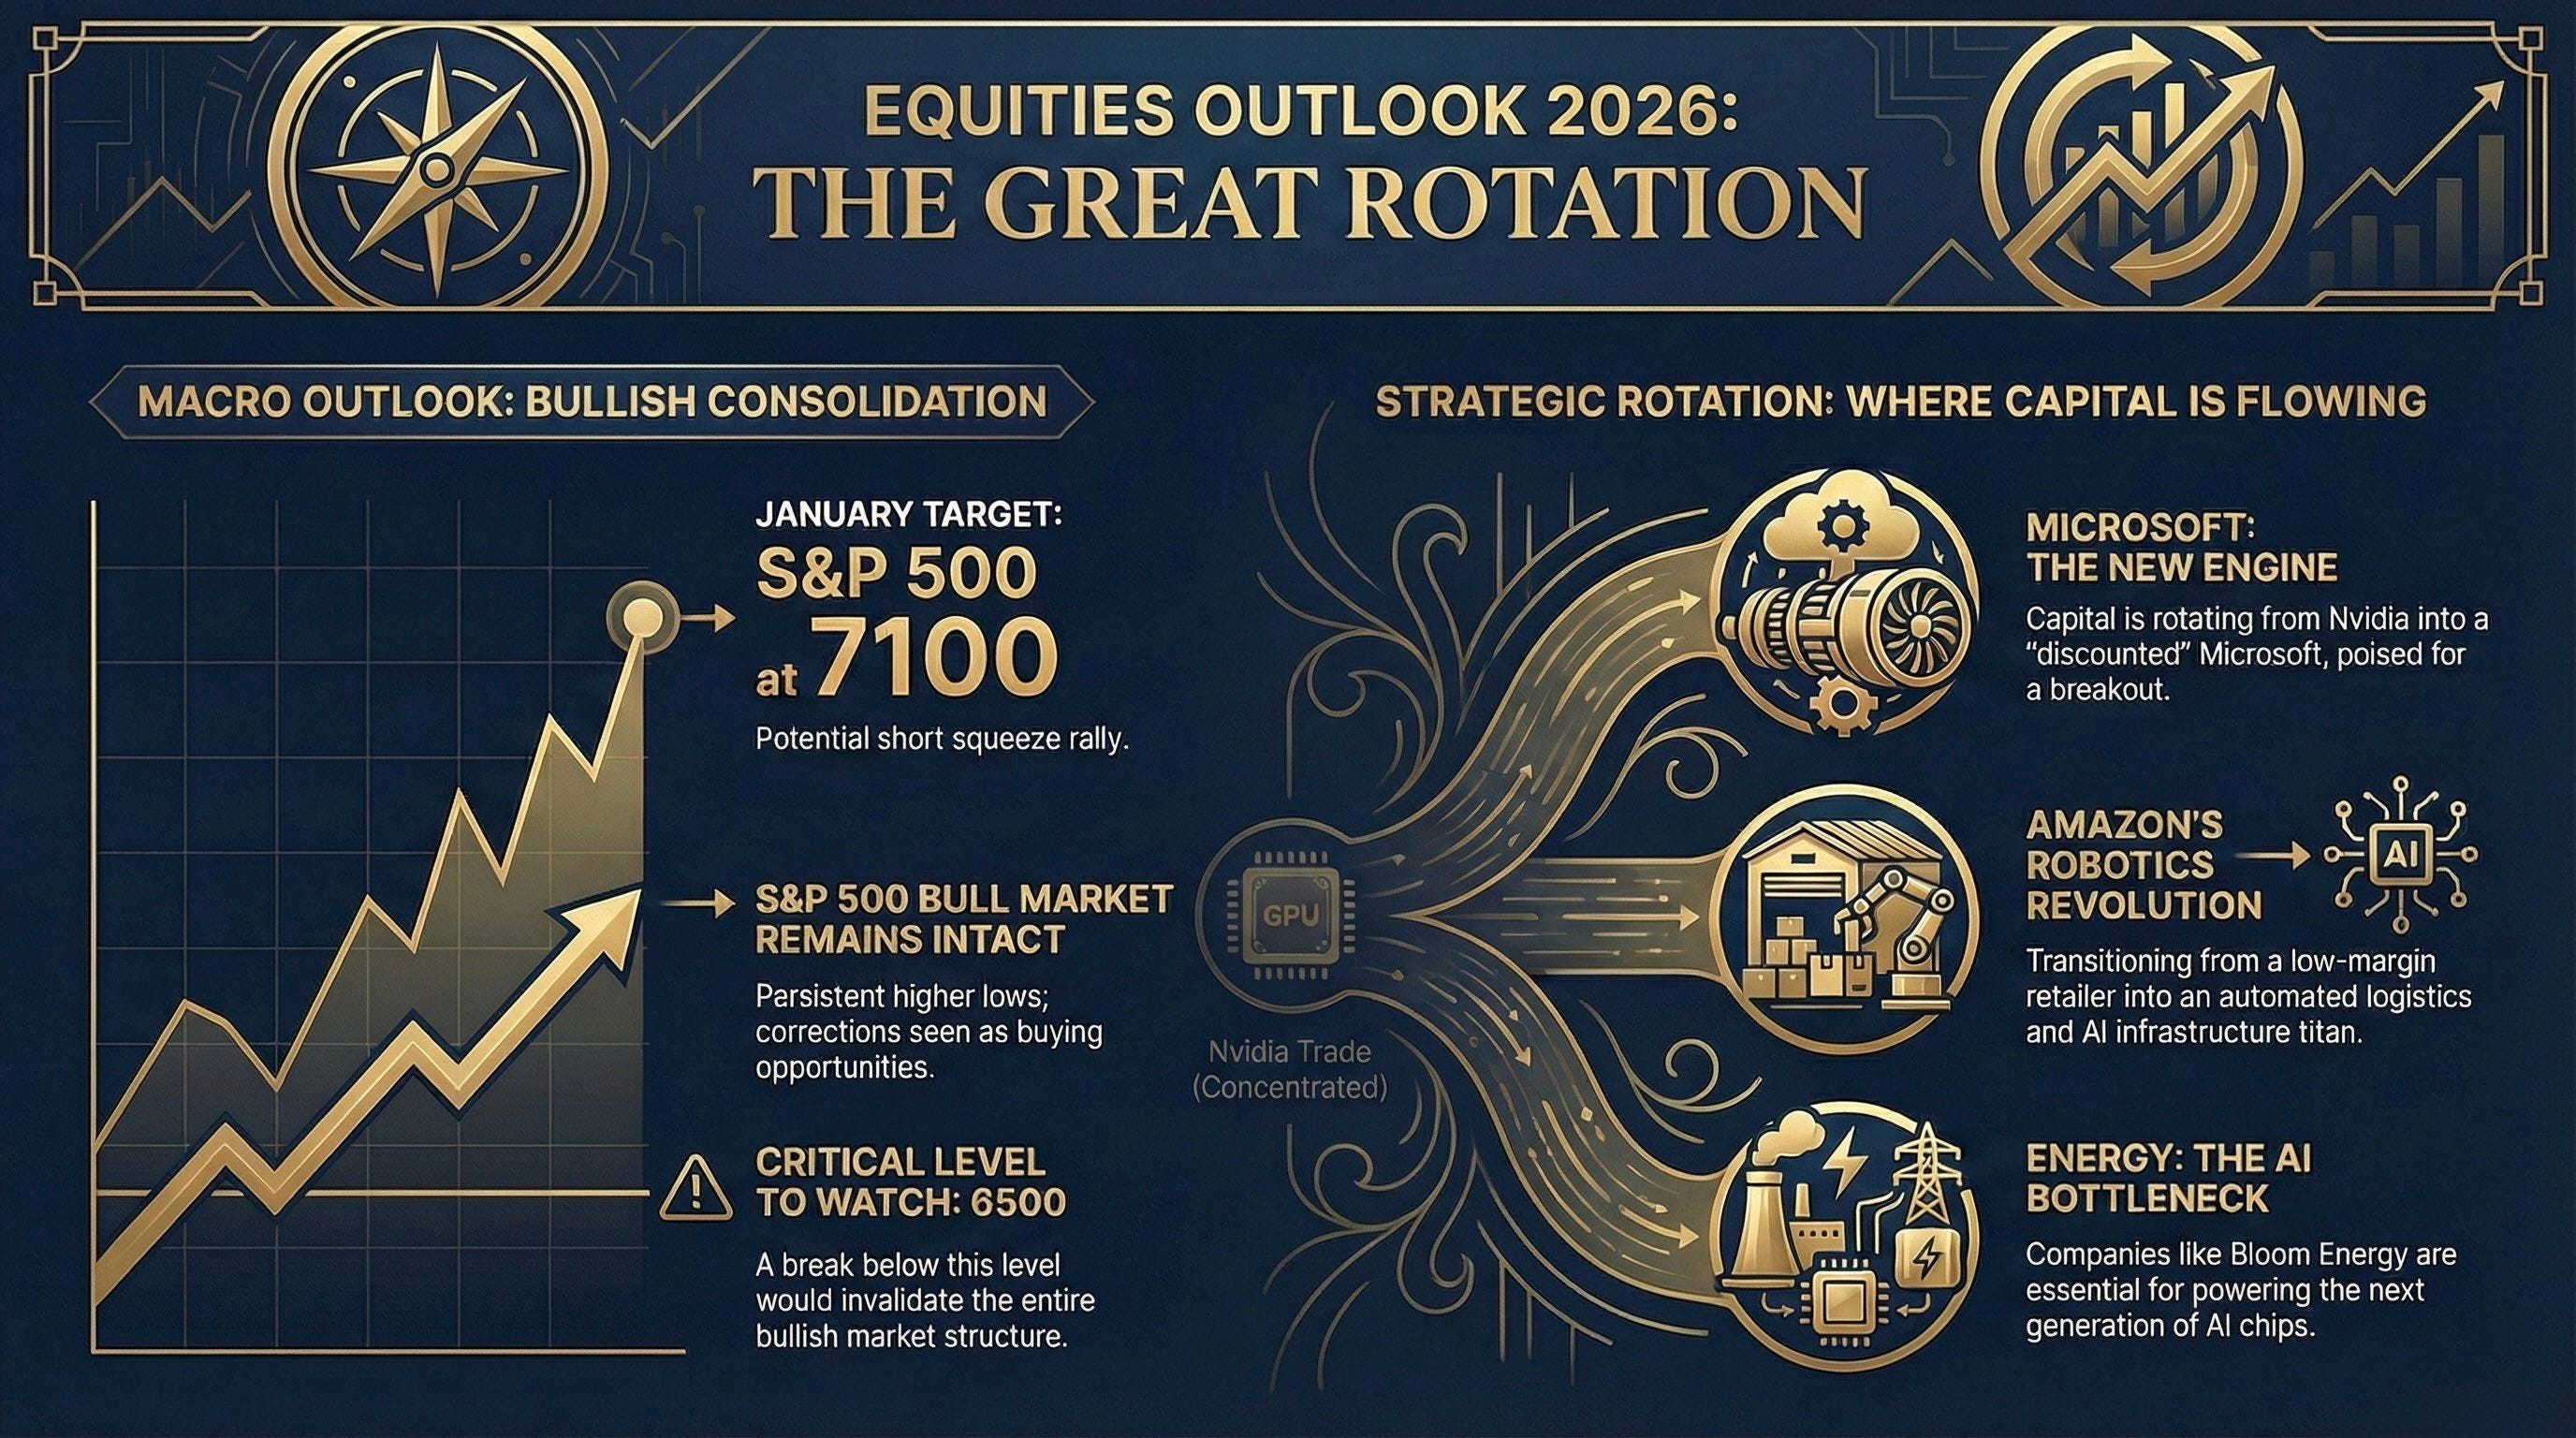
What does this mean for your portfolio? It means that understanding the 3-week low rule is the difference between panic-selling and wealth accumulation. We are currently tracking the S&P 500 toward a 7100 January target, a move likely to be fueled by a short squeeze rally as put-hedgers are forced to cover ahead of risk events like the NFP and Supreme Court rulings. This isn’t just about the S&P500; NASDAQ Index is the engine of this rally, and the NASDAQ cannot run without Microsoft. We are witnessing a historic rotation where the “Nvidia-only” trade is fading, and capital is flowing back into “discounted” giants like Microsoft (15% pullback), AMZN and META.
Key catalysts are lining up as follows for Mega Cap Tech companies: January 28th for Microsoft earnings, January 13th for JP Morgan, and February 4th for Meta. We are also tracking a fundamental shift in the AI narrative. While 2025 was about software models, 2026 is the year of energy bottlenecks and the Robotics Revolution. Companies like Bloom Energy, which provides the power for Nvidia’s Blackwell chips, and Amazon, which is on the verge of collapsing delivery times from 12 hours to 1 hour via self-autonomous fleets, are the new alpha generators.
In this report, we will exhaustively detail:
The S&P 500 Market Structure: Why the 6513-6538 gap was a gift and why 6500 is the line in the sand.
The Microsoft/NASDAQ Algorithm: How XLK is decoupling from SMH and why Microsoft’s “Volatility Box” is about to explode.
The Apple/Google Partnership: The financial engineering behind the $120B buyback and the Gemini AI integration.
Retail and Banking Alpha: Why Costco is a 20% “discounted” version of the index and how JPM will benefit from the rate-cut cycle.
By the end of this deep dive, you will have specific entries, stops, and targets for over a dozen tickers, allowing you to position ahead of the quarterly expansion.