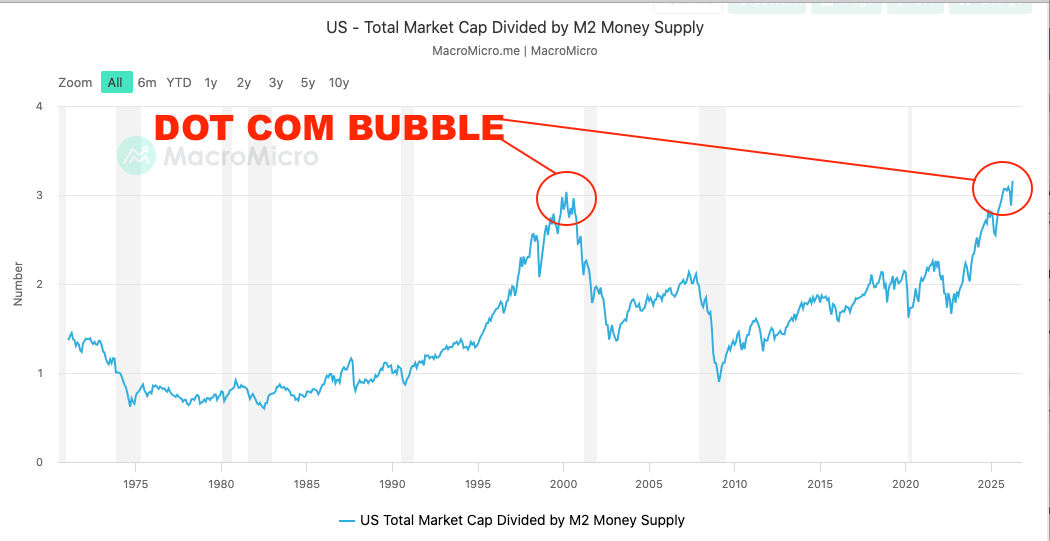

There’s a chart doing the rounds. US total market cap divided by M2 money supply. Two red circles. One around the year 2000. One around right now. Both sitting at 3.

The message writes itself: the stock market is three times bigger than all the money in the economy, we’ve only been here once before, and that time it ended with an 80% drawdown in the Nasdaq. Traditional investors are sounding the alarm. So the question asks itself too: are we here again?
I want to answer that properly, because the chart is only half right.