

The AI Bubble and Market Melt-Up: Navigating Quarterly Rebalancing, Cross-Market Correlations, and Strategic Equity Positioning

📊 Executive Summary
In this report we dissect the critical dynamics shaping the end of this quarter and the positioning required for Q4. This analysis covers the post-FOMC price action and the crucial phenomenon of quarterly rebalancing, where institutional giants like BlackRock, State Street, and Vanguard reshuffle portfolios. While directional movement may seem muted, significant activity occurs underneath the surface as managers position for the next three months. A key focus remains on utilizing Open indicators (monthly, weekly, and quarterly opens) as dynamic support and resistance levels, essential for sniping the exact bottom of a monthly or quarterly candle before expansion begins as demonstrated by the Q3 open holding firm support during Bitcoin's recent dips.
(ACCESS TRADING RESOURCES-SKILL DEVELOPMENT-MARKET COMMENTARY-COMMUNITY OF TRADERS)
FOR THE FIRST TIME IN 9 YEARS WE ARE OFFERING A 14 DAY FREE TRIAL TO OUR PREMIUM SERVICE. TAILORED TOWARDS EQUITY, INDICES, CRYPTO AND COMMODITY/FX TRADERS AND INVESTORS.
The overarching theme this quarter has been a relentless push higher, driven by powerful cross-market correlations. The Q3 bias was bullish across the board, anchored by an inside quarterly candle failure on the Nikkei. This pattern signaled significant upside, which, due to a “100% correlation,” mandated similar expansion in the NASDAQ and, consequently, Bitcoin. The market is currently defying traditional seasonality, particularly the typical weakness of September. This defiance indicates we are in a "melt-up phase," a market moving “on steroids.” This environment is fueled by massive liquidity, impending rate cuts, and the ongoing AI revolution, leading to revenue explosions in mega-cap companies. The example of Oracle rallying 40% post-earnings underscores that this is far from normalcy, and expectations should be adjusted for trillion-dollar companies seeing 10-25% jumps on earnings beats.
The AI narrative is creating a bubble, particularly in US equities, which are currently outperforming cryptocurrencies. The strategy emphasized is not to fear the bubble but to actively participate with leverage and proper risk management. Microsoft (MSFT) is a prime example, offering a high-conviction trade based on cross-market analysis and an inside 3-week candle failure pattern. This setup provided a 9.53 risk-reward ratio, justifying a heavy 30% risk allocation, and is already up 50-60% with the main move expected into the October 20th earnings. The conviction is further supported by analyzing Capital Expenditures (Capex). Companies like Google (doubling capex YoY to $22 billion) and Microsoft ($19 billion forecasted) are investing heavily in AI infrastructure and cloud services (Azure, Google Cloud), signaling massive future revenue growth. Furthermore, historical fractals suggest striking parallels between Microsoft's current structure and its 1996-1999 bubble phase, which saw a 670% return following a similar 26% consolidation period.
While equities lead the charge, the cryptocurrency market appears to be consolidating, waiting for the new quarter to open. Bitcoin (BTC) is lagging NASDAQ but defending key support, potentially forming an ascending triangle for a year-end breakout. Ethereum (ETH) has broken out of a 2.5-year consolidation, with a trajectory toward 10k. The immediate strategy is to wait for a pullback to the 4127 support level for a swing long entry. Altcoins like Sui and XLM also present compelling inside candle failure setups, with XLM targeting 63 cents. In commodities, Gold (XAU) continues its expansion, targeting $4000 based on a double inside two-month candle breakout. Traders are cautioned against shorting based on overbought RSI conditions, as bubbles can remain extended for years.
Finally, the macro environment is defined by currency debasement. As yields and the DXY fall, purchasing power decreases. Institutions are forced into risk-on assets (equities, gold, Bitcoin) to protect wealth. This dynamic underscores the critical importance of maintaining long-term investments in indices like the QQQ or S&P 500 to hedge against inflation and generate generational wealth, recognizing that despite historical recessions, the market always recovers and moves higher.
Key Takeaways:
Market Phase: We are in a "melt-up phase" driven by liquidity and the AI revolution, defying traditional seasonality.
Cross-Market Correlation: Nikkei, NASDAQ, and Bitcoin are moving in sync (100% correlation); discrepancies offer catch-up trade opportunities.
AI Bubble Strategy: Actively long the AI bubble in US equities (e.g., Microsoft, Google, Alibaba) rather than fearing the burst.
Capex as Indicator: Massive increases in Capex by mega-caps signal future revenue explosion in AI and cloud services.
Crypto Outlook: Consolidation expected until the Q4 open; Q4 is seasonally the strongest quarter for crypto.
Historical Fractals: Algorithmic patterns repeat; Microsoft shows strong parallels to the 1996 tech bubble setup.
Macro Driver: Currency debasement is forcing capital into risk-on assets to preserve purchasing power.
Navigating the "Melt-Up": Quarterly Rebalancing and Market Dynamics
As we approach the close of the current quarter, understanding the underlying market mechanics becomes paramount. This period is characterized by significant institutional activity and a market environment that is defying traditional expectations, fueled by extraordinary liquidity and technological advancements.
The Institutional Shuffle: Positioning for Q4
The final weeks of a quarter trigger a phenomenon known as quarterly rebalancing. This is a critical period where a significant amount of portfolio reshuffling occurs. Institutional hedge fund managers, large retail investors, sovereign funds, and major asset managers such as BlackRock, State Street, and Vanguard are all actively repositioning.
This activity is driven by the need to align portfolios for how the upcoming quarter (Q4) is expected to unfold. It is important to note that this period often does not result in large directional movements visible on the surface. Instead, “there is a lot of activity underneath the surface in the market,” and these subtle shifts are very hard to miss if you know what to look for. Recognizing these patterns, based on how they have unfolded in past quarters, provides a decent idea of what to anticipate as Q4 begins.
Defying Gravity: The Q3 Rally and the Steroid Market
The bias for Q3 was overwhelmingly to the upside, not just in Bitcoin but across the board, including NASDAQ and Nikkei. This outlook was based on specific patterns and cross-market correlations, which have performed strongly over the past three months.
A major observation is the defiance of traditional seasonality. September generally sees weak seasonality, which often leads to caution. However, this September has presented one of the strongest monthly candles in the entire push. When September defies gravity and shows no weakness from a seasonality perspective, it strongly indicates that we are in a "melt-up phase" in the market.
In this phase, traditional algorithmic expectations—such as the idea that a 10% rise must be followed by a 3% or 4% correction—do not apply. “We are not in a normal environment. The market is moving on steroids.”
Drivers of the Melt-Up:
Liquidity: There is a significant amount of liquidity currently in the system.
Rate Cuts: Impending rate cuts are anticipated to add even more liquidity.
AI Revolution: Technological advancements are driving significant growth.
Revenue Explosions: Mega-cap companies are experiencing massive earnings growth.
A stark example of this abnormal environment is Oracle. Before its recent earnings, it was a $700 billion company. Post-earnings, it rallied 40%. This is not normal. We are entering a phase where trillion-dollar companies like Microsoft, Apple, Nvidia, and Amazon might see 10%, 15%, 20%, or even 25% jumps on earnings as they beat revenues by large margins.
Because these mega-cap companies carry the NASDAQ index, the NASDAQ is unlikely to come down. This, in turn, has a very supportive effect on the global risk-on appetite, which spills over into the cryptocurrency space, including Bitcoin. If liquidity is expanding and NASDAQ is expanding, Bitcoin is expected to expand accordingly and move higher along with it.
Cross-Market Correlations: The Nikkei, NASDAQ, and Bitcoin Nexus
Understanding the interconnectedness of global markets is crucial for maintaining a bullish bias and managing risk. The relationship between the Nikkei (Japanese index) and the NASDAQ (US tech index) serves as a primary driver for the current market environment, with direct implications for Bitcoin.
The 100% Correlation and Q3's Driving Pattern
Everything is connected globally. The Q3 outlook was heavily predicated on a specific pattern identified in the Nikkei: an inside quarterly candle failure at a high. This pattern signaled a strong likelihood of pushing through initial targets and rallying higher.
The critical insight is the relationship between these indices: “When Nikkei goes up, NASDAQ goes up; they both go hand in hand. It is a 100% correlation between both of them.” Anticipating upside price action on the Nikkei's quarterly candle directly implied that the NASDAQ would print the same kind of upside.
This correlation explains why the NASDAQ has experienced such a large quarterly candle expansion to the upside, despite widespread claims of overextension, overbought RSI readings, and expectations of a drop. If the Nikkei is expanding, liquidity is flowing into the system, circling back, and hitting the NASDAQ. Consequently, if the NASDAQ is going higher, Bitcoin is also going to go higher, limiting significant downside price action.
If a bullish pattern like the inside quarterly candle failure shows up in one of these major indices, signaling a three-month rally, it will have reverberations across all correlated markets. It is highly improbable that one asset would rally for three months while the other declines; they move in sync. This allows traders to look for swing long positions across the board—Nikkei, NASDAQ, or Bitcoin—as the entire global monetary flow is interconnected.
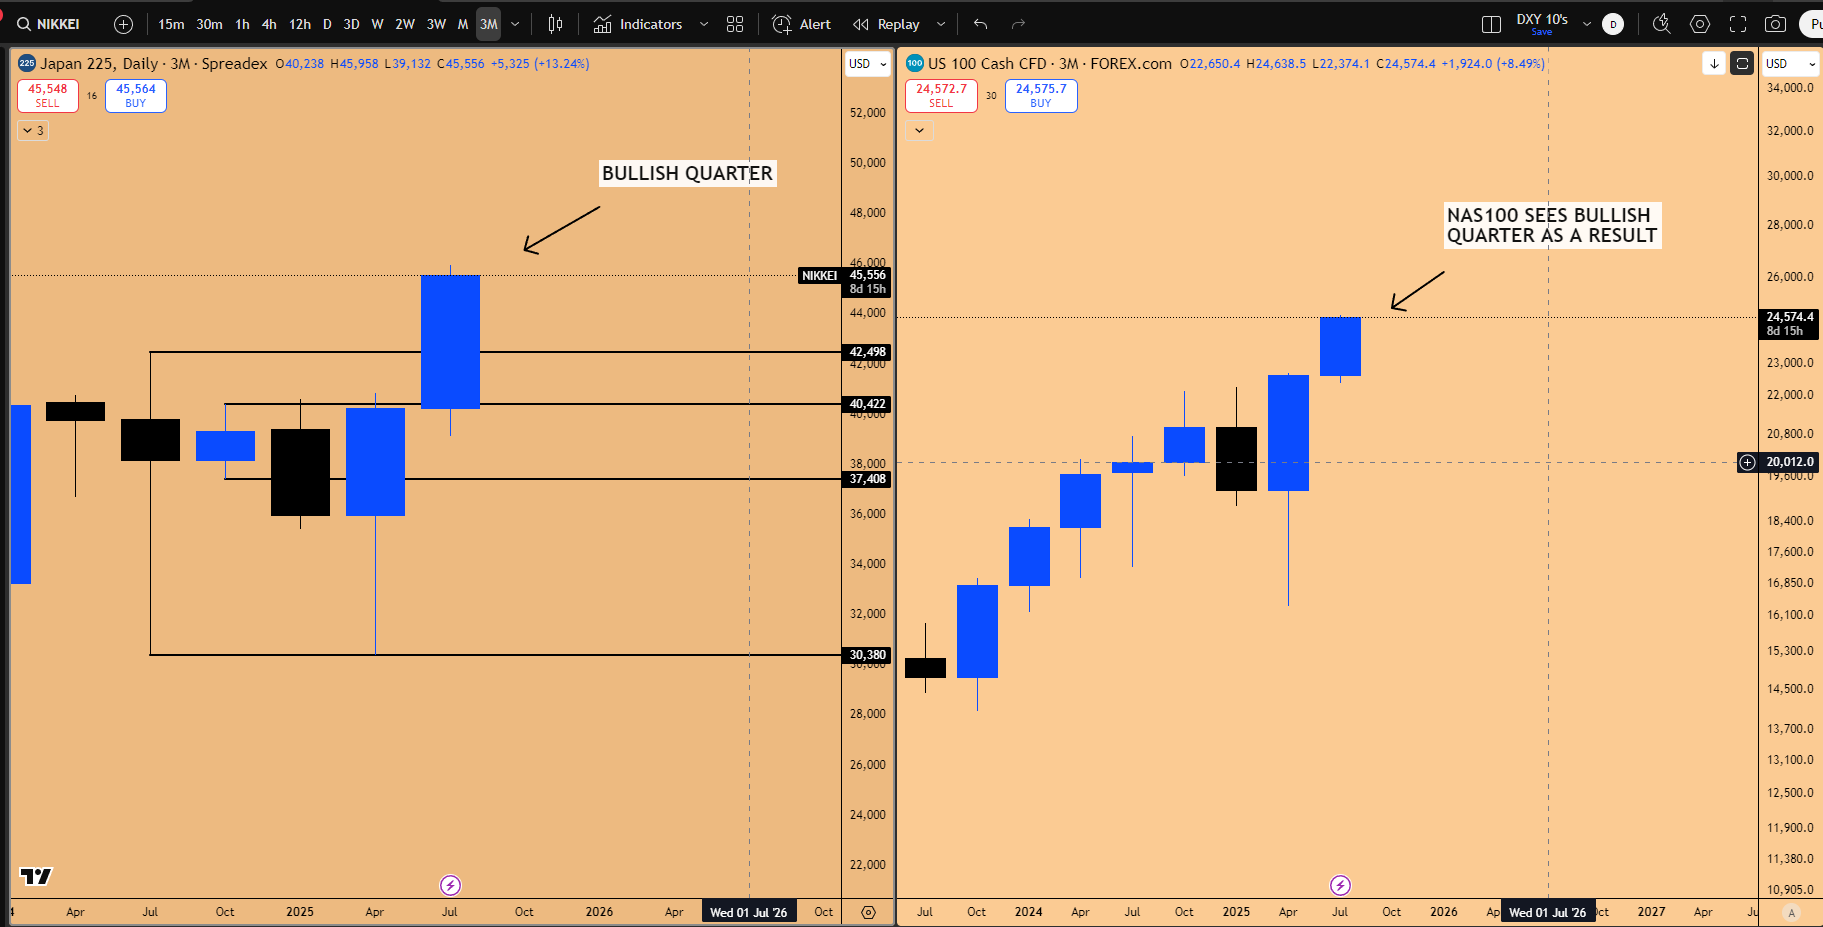
Figure 1: NAS100 vs Nikkei225, bullish quarter in Nikkei 225 leading to Bullish quarter in NAS100
🤖 The AI Bubble and Strategic Equity Positioning
The current market dynamics strongly favor US equities over cryptocurrencies, primarily due to the AI revolution driving unprecedented capital inflows and creating a bubble formation in AI-related companies.
Riding the Bubble: Why Equities Outperform Crypto
When a bubble is forming, the strategy is not to be afraid of it. “You go and long it and you long it with leverage.” Significant money is made by being part of the bubble. While the bubble will eventually burst, the timing is unknown—it could be six months, a year, or five years from now. The key is to execute proper risk management upon entry and let the market do its thing, riding the expansion until a market structure break signals the bubble is popping.
Currently, Bitcoin is underperforming NASDAQ, despite typically being a 3x or 5x leveraged proxy. From a key support/resistance level, NASDAQ is up 11%, while Bitcoin is only up 6%. This shows that money flow has prioritized US equities due to the AI narrative.
Comparing IBIT (Bitcoin ETF) with QQQ (NASDAQ ETF) confirms that NASDAQ is significantly more bullish. While Bitcoin has been moving sideways, NASDAQ is moving in a straight line up. Notably, the 3-week candle lows for Bitcoin were taken out, forcing it into consolidation. NASDAQ, however, has seen no breach of 3-week candle lows and has avoided consolidation. “It has just been up. That is really a bubble.”
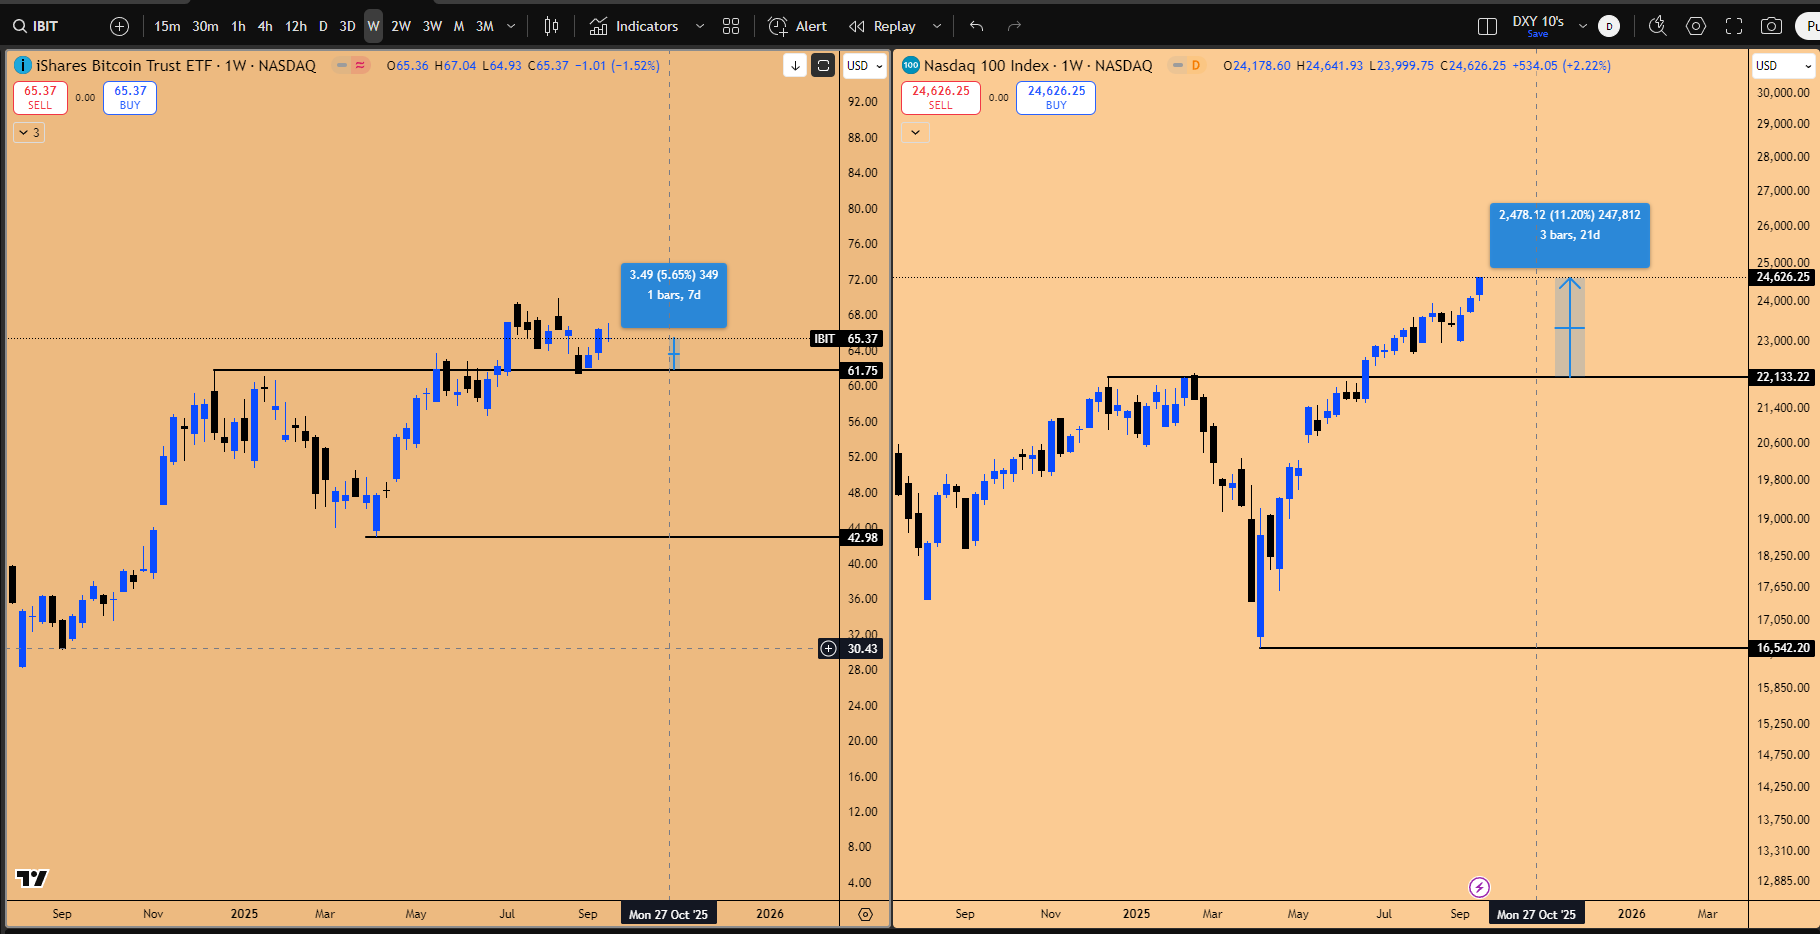
Figure 2: IBIT vs NAS100, IBIT underperforming NAS100 in the past 3 months
If NASDAQ is a bubble, traders are much better off being long on the bubble itself, specifically through companies driving the narrative, like Microsoft. The long position taken on Microsoft is performing far better than current crypto longs, which are mostly sitting neutral. Microsoft, on heavy positions, has gone up 50% or 60% in the past two weeks, demonstrating where the real money is trading at the moment.
Microsoft Deep Dive: The 9.53 R:R Setup and 3-Week Candle Strategy
The cross-market correlation between Nikkei and NASDAQ provides a framework for identifying high-conviction trades in individual equities. If the entire quarter is expected to be bullish for NASDAQ, positioning in leading companies like Microsoft (MSFT) is the optimal strategy.
The recent entry into Microsoft was based on a confluence of factors derived from this top-down analysis:
Cross-Market Support: Microsoft leads NASDAQ. The confidence that the quarterly low on Microsoft would hold was based on the certainty that NASDAQ would not violate its quarterly low, which in turn was based on the Nikkei's massive pump on the quarterly chart. All algorithms are in sync.
Strategic Entry: Microsoft was sitting near the quarter low. A sharp drop was bought at the bottom (495) because the analysis indicated it would not take out the quarter low.
Risk Management: This certainty allowed for an extremely tight stop loss. Targeting new highs, the setup offered a risk-reward ratio of 9.53.
Heavy Positioning: Due to the tight stop loss and high confidence, a 30% risk was taken instead of the regular 5%. The dollar amount risked if stopped remained the same as regular trades, but the position size was significantly larger due to higher risk/reward being offered on the trade setup.
Technical Trigger: The inside 3-week candle pattern was in play. The daily candle took out the inside 3-week candle lows, which was identified as a likely stop hunt. The subsequent rejection confirmed a sweep of the low, triggering a swing long based on the inside 3-week failure.
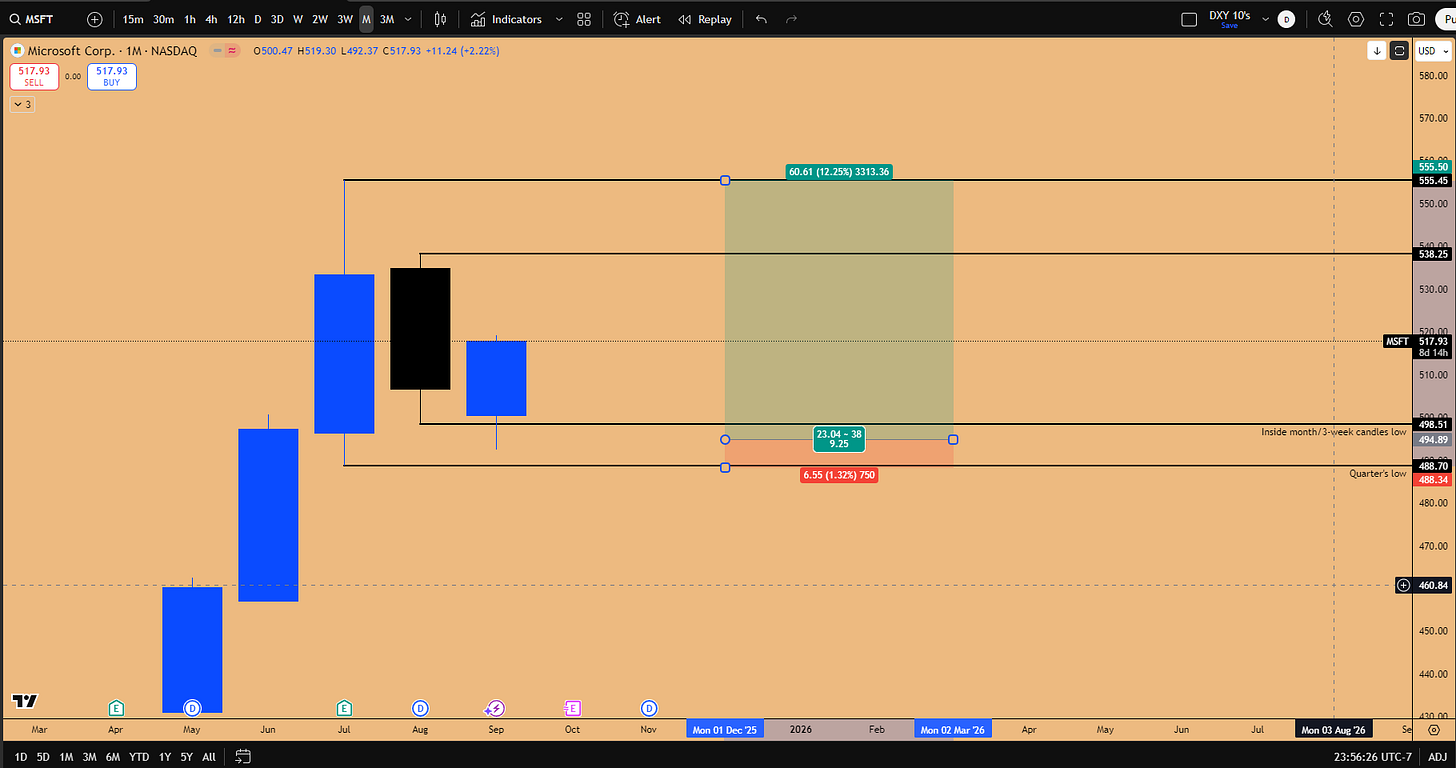
Figure 3: MSFT’s swing long trade setup entered on 5th September, 2025

Analyzing the NASDAQ/Microsoft Relationship:
Just as Nikkei and NASDAQ go hand in hand, NASDAQ and Microsoft do too. Monitoring the 3-week candle lows is key. NASDAQ has never taken out any of the 3-week candles during its expansion, providing no technical reason to exit long positions. Although profits were previously locked in due to concerns about Microsoft's post-earnings rejection spilling over to NASDAQ, the index held firm as money rotated into other components like Apple, Google, and Tesla.
Currently, NASDAQ is pushing higher and making new highs, while Microsoft experienced a pullback and formed an inside 3-week candle. This gives the green light that Microsoft should also be pushing higher to catch up. The options call position is currently up 50%, but the actual move for MSFT stock has not even started yet. The expectation is a full liftoff going into the earning season, with Microsoft reporting on October 28th, 2025. By cross-market analysis correlation, it is already written in Microsoft's algorithm that it should be sitting at all-time highs because NASDAQ is now; it is just a waiting game.
⚔️ The Capex Explosion: Google, Microsoft, and the Cloud Wars
A key indicator supporting the bullish thesis on AI companies is the massive increase in Capital Expenditures (Capex). When a company expands its capex, it signals that they expect their future business revenue to explode, as they are preparing infrastructure to onboard significantly more clients.
Research into the capex for major companies reveals the scale of the AI investment:
Google (GOOGL): In Q2 of this year, Google's capex was $22 billion, compared to $11 billion in Q2 last year. This represents a 104% increase. This spending is focused on AI-driven infrastructure, specialized hardware (TPUs and GPUs), and expanding data capacity for Google Cloud to meet enormous computational demands.
Microsoft (MSFT): Microsoft's forecasted capex is $19 billion, up significantly from $11 billion in the prior year comparison. Investments are focused on expanding data center capacity, particularly for its exclusive partnership with OpenAI, whose models are trained using data hosted on Azure cloud services.
Amazon (AMZN): Amazon is also heavily in the AI race with Amazon Web Services (AWS) and its funding of the Anthropic AI model.
At the core of every major AI company is cloud-based infrastructure. The expansion of capex is directed toward these cloud services because enterprise companies utilizing these platforms host terabytes worth of data on them.
The Strategic Importance of Cloud Capex:
The race is on to capture enterprise clients early. If an enterprise company moves in early and develops its applications using a specific cloud service (like Azure), it is very unlikely they will switch to a competitor later. These big tech companies are spending billions to ensure they have the infrastructure ready to be the first choice. This allows them to easily upsell future AI applications and services to a captive customer base.
This strategy mirrors Microsoft's approach during the 1990s internet bubble, where early dominance with Windows secured its behemoth status. Google, having observed this, is competing aggressively this time, evidenced by its capex spending exceeding Microsoft's.
Other Players:
Meta (META): Is not competing effectively in this infrastructure race.
Apple (AAPL): Is not significantly spending on AI development, enjoying its past successes rather than engaging in the AI wars.
Oracle (ORCL): Is waking up, reporting $350 billion worth of future partnerships in its recent earnings, positioning it as a direct competitor in the future.
🇨🇳 The China Factor: Alibaba's AI Ambitions and Technical Breakout
The AI revolution is not limited to the US. China is a direct competitor. Data shows that 90% of the entire global AI data analyst and researcher population is concentrated in either the US or China (approximately 45% each), with the remaining 10% spread globally. The race is highly concentrated between these two nations.
While US companies are rallying, Chinese equities should not be forgotten. Alibaba (BABA), accessible on the New York Stock Exchange, is emerging as a direct player in the AI space.
Alibaba's Strategic Position:
With US-China relations strained and Nvidia banned from providing chips to China, Alibaba is stepping in to fill the void. They are developing their own chips to serve Chinese clients, capturing the opportunity to reduce reliance on the US. Alibaba has been rolling out new chips offering decent compute compared to Nvidia, and the market is responding positively.
Technical Analysis (BABA):
Alibaba is waking up after a four-year recessionary phase (from 2020 to the 2022 bottom) and is turning bullish.
Breakout: For the first time, Alibaba broke out of a massive accumulation zone spanning July 2022 to February 2025.
Support: The first support is the bullish order block between $80 and $117.
Market Structure: The recent pullback was defended, establishing a higher low. Following an earnings announcement where they released a new competitive model, the market popped up, taking out the nearest high. The structure is now bullish: higher lows followed by the first ever higher high, and now advancing again.
Price action suggests that Alibaba is also expanding its capex and competing directly with American companies for AI-based hardware infrastructure. This is expected to be the “most hated rally” because sentiment toward China remains negative due to trust and regulatory issues.
Risk Management Note: If positioning in Alibaba, traders must be willing to lose 100% of the capital invested due to the inherent risks associated with Chinese equities. However, if it works, the potential returns (e.g., 100%) represent significant upside. Alibaba should be on the radar going into 2026.
📈 Cryptocurrency Outlook: Consolidation Before Q4 Expansion
The cryptocurrency market is currently lagging behind the fervor in US equities. The analysis suggests that the entire market, including crypto, is waiting for the quarterly candle to close. The real expansion is unlikely to happen until the new quarterly candle opens in approximately 9 days. Seasonally speaking, the last quarter (Q4) is the strongest quarter of the entire year for crypto, with Bitcoin and consequently altcoins performing very well going into November and December.
Bitcoin's Consolidation and the Ascending Triangle Thesis
Bitcoin (BTC) is a direct proxy for NASDAQ, typically acting as a leveraged beta. However, it is currently underperforming as capital flows prioritize the AI bubble in equities.
While Bitcoin defended the key support/resistance level during the recent pullback, confirming the Q3 low at 105,119, it has entered a consolidation phase, partly because its 3-week candle lows were taken out (unlike NASDAQ).
The current thesis is that Bitcoin is developing a large consolidation zone, which it is expected to break out of once the new quarter starts.
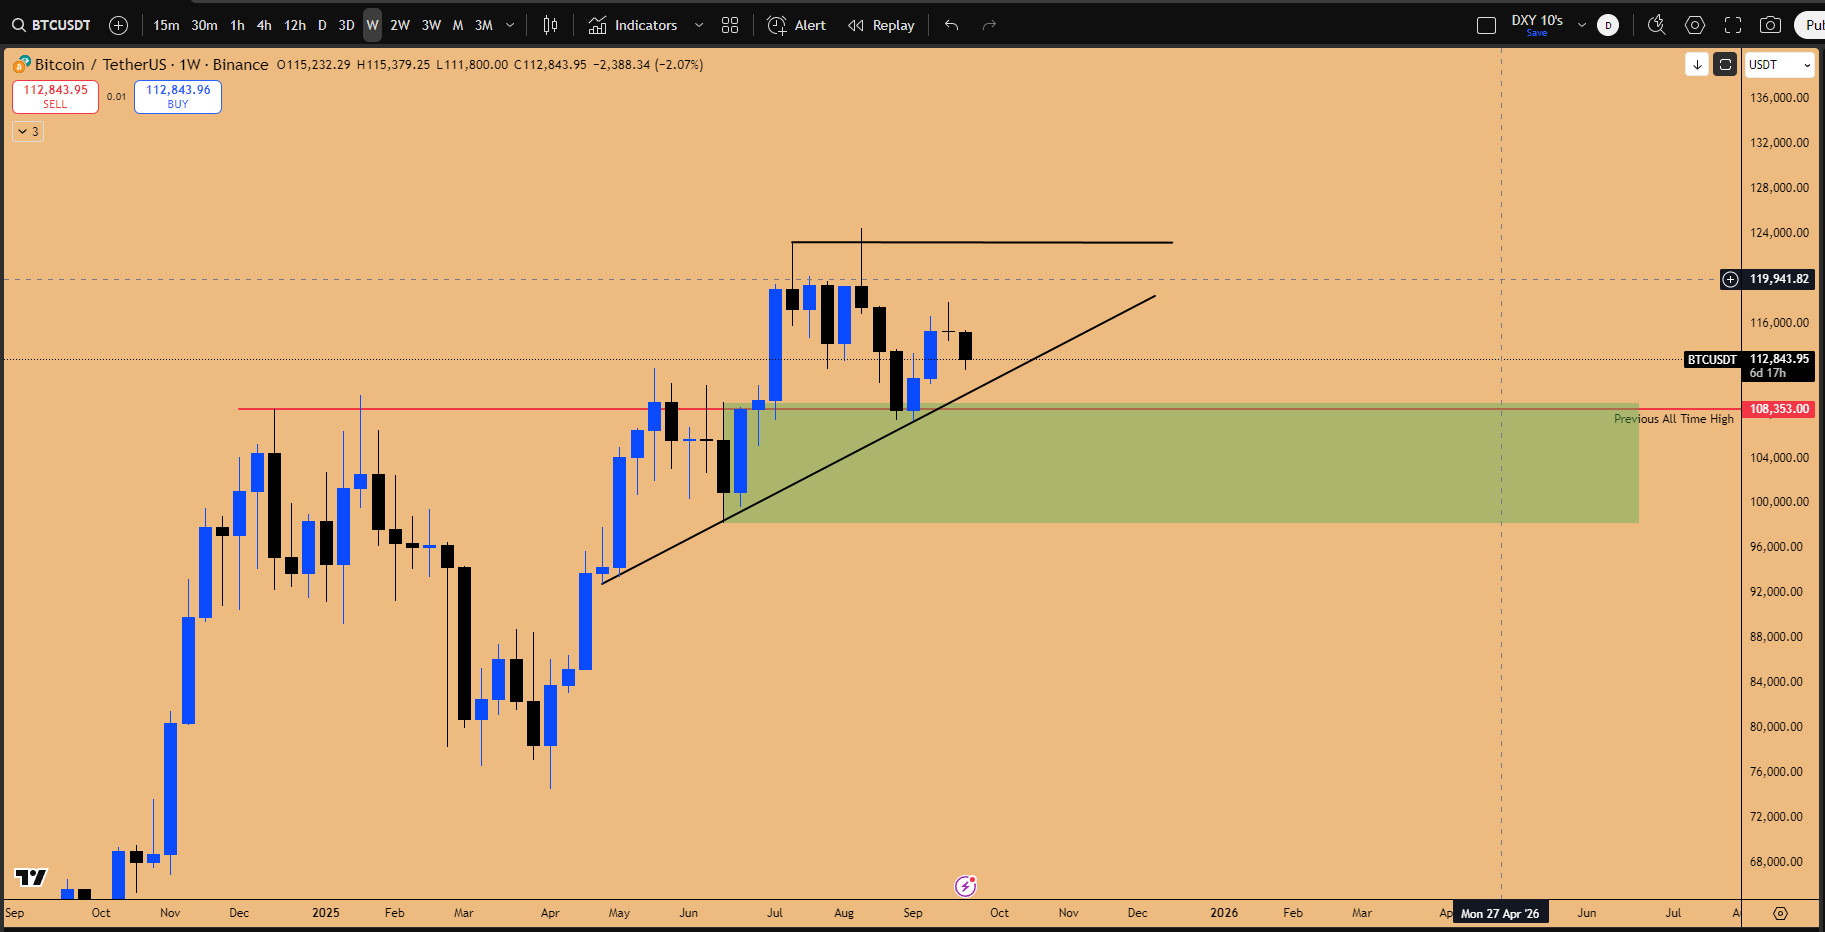
Figure 4: Ascending Triangle in formation for BTCUSD
Key Levels and Strategy:
Critical Support: The previous all-time high and the Q3 low (105,119). The market cannot go below these levels to maintain the bullish structure.
Entry Zone: Any pullback into the local support/resistance level presents a very good level to enter a long position.
Ethereum's 10k Trajectory: The Inside Candle Setup
Ethereum (ETHUSD) presents one of the most prolific charts currently. The quarterly candle expansion has been significant, indicating that Ethereum is breaking out of a massive, 2.5-year consolidation. The long-term trajectory is toward 10k.
Given this breakout, any pullback that may happen in the market will be an opportunity to go swing long. However, the current quarterly candle is very stretched, suggesting it may go sideways for the next 9 days until the close.
The Current Pattern and Entry Strategy:
There is a very distinct pattern in play: an inside two-week candle, which is also nested within an inside 3-week candle. The strategy is to remain on the sidelines and wait for a specific trigger.
Trigger Level: The key level is the low at 4127.
Action: Lock this level on the chart and set an alert.
Execution: If this low gets taken out, the market will be tagging a very strong support zone. This is the area to look for swing long positions, both from a spot perspective and potentially with leverage, as it offers a very lucrative risk-reward ratio.
Until this trigger occurs, the recommendation is to wait for the new quarter to open. Strategies will be deployed to capture the low of the next quarter, similar to capturing the bottom wick of the Q3 candle, allowing traders to ride the expansion throughout Q4.
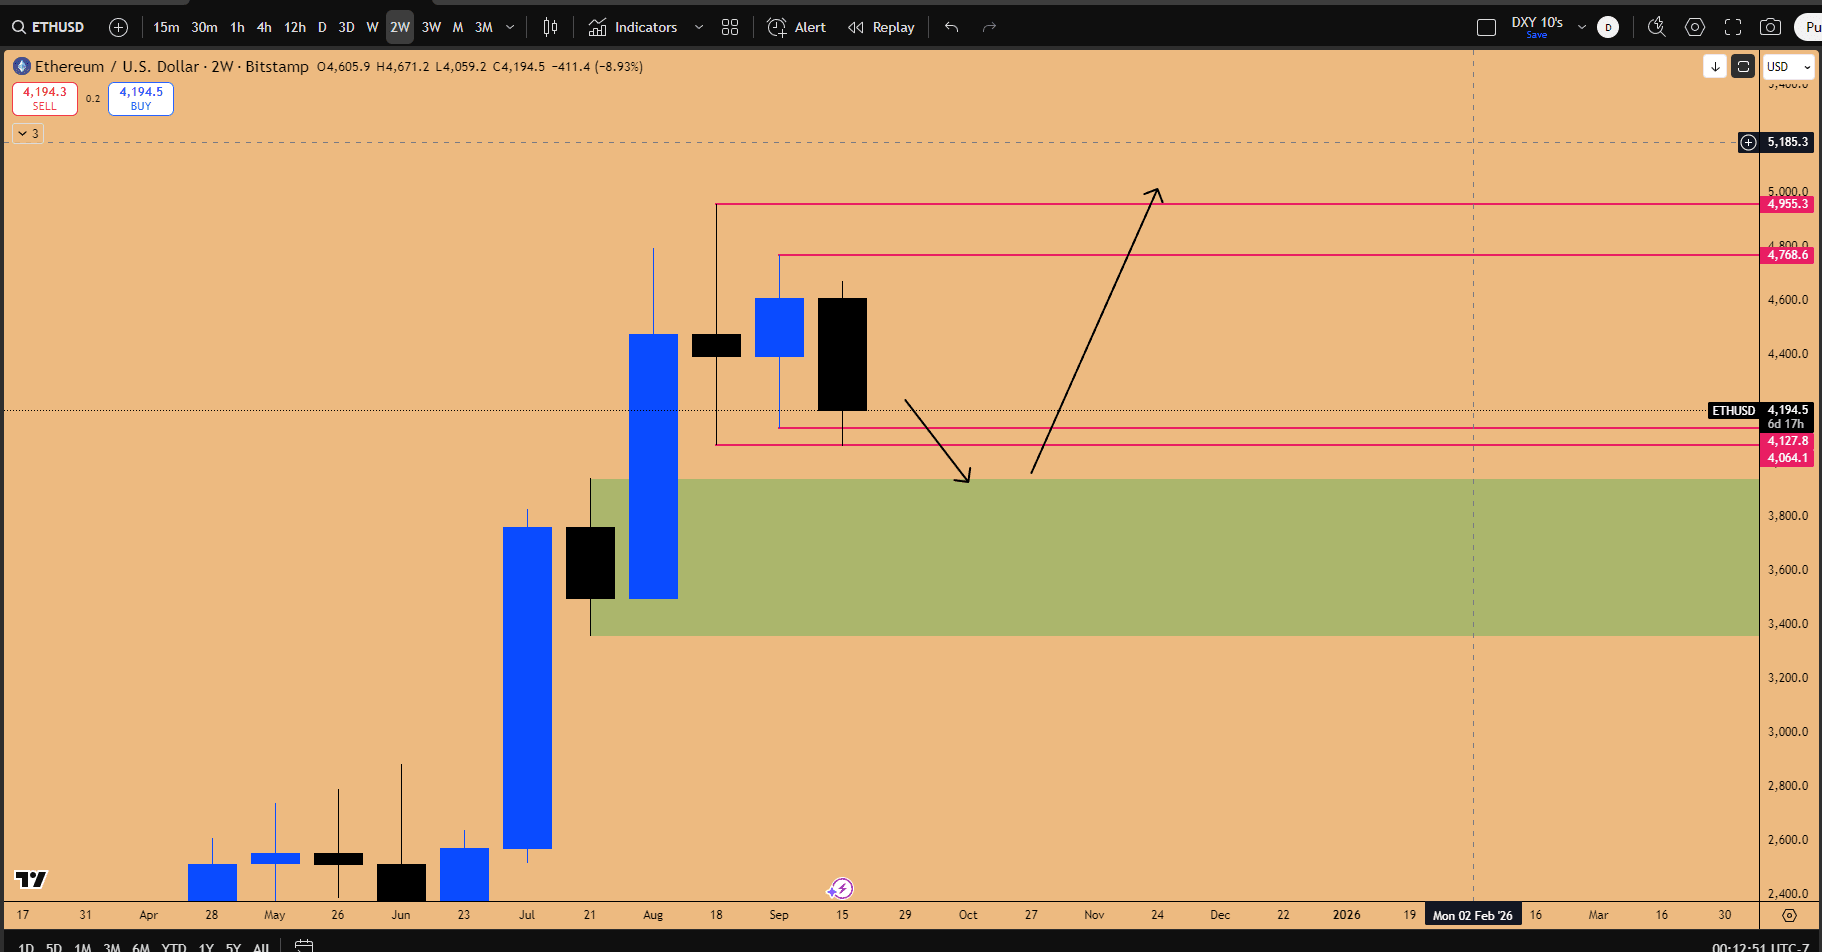
Figure 5: ETHUSD breaching Inside 2-week candle’s lows, on watch for a failure to form
💸 Commodities and Currencies: Gold's Bubble and Fiat Debasement
The current environment, characterized by strong growth alongside impending rate cuts, has significant implications for commodities like Gold and the broader macroeconomic landscape concerning fiat currencies.
Gold's Path to 4000: Don't Short an Overbought Bubble
Gold (XAU) is still expanding on the quarterly chart. A significant fallacy among traders is the urge to fade a market just because it is overextended or the RSI is overbought (currently sitting at 86).
“This is what a bubble is all about. The bubble can stay strong and it can keep expanding higher and higher and higher while it remains overbought.”
A bubble remains overbought for an extended period. The RSI only takes a significant nose dive when the bubble is about to pop.
Historical Example:
In a previous cycle, Gold was extremely overbought on the RSI. It remained in a bubble and kept expanding for the next 3 years. Attempting to short continuously during this period based solely on the RSI would lead to obliterated accounts.
Strategy for Riding the Gold Bubble:
The recommendation is not to short a bubble when it is moving this way. Instead, wait for a clear market structure break.
Trail Stops: As Gold expands on the quarterly chart, mark out all the quarterly lows.
Identify the Breach: Concern is only warranted after it breaches a quarterly low.
Exit Signal: When higher lows start breaching and the RSI takes a hit, that is the signal that the bubble is getting popped, and it is time to exit the position.
The current bubble has been expanding since October 2023, and every quarter's low has been defended. As long as the quarterly candles keep expanding on top of the previous ones, traders should remain long.
Outlook and Targets:
Gold will still keep expanding due to the monetary policy environment (cutting rates sparking inflation concerns), serving as an inflation hedge.
The target is based on the inside two-month candle pattern (specifically a double inside two-month candle) breakout. When the highs were taken out (3451 to 3500), the projected move from the breakout is a minimum of 15%.
Target: This takes Gold to the 4,000 mark.
While the current two-month candle is overextended, suggesting potential consolidation in October, the bullish momentum will stay intact. The expansion may resume when the next two-month candle opens in November. Future long opportunities require a pullback forming an inside weekly or daily candle failure. However, the primary focus going into October should be on equities due to stronger seasonality and the upcoming earning season, with potential rotation back into Gold in November.
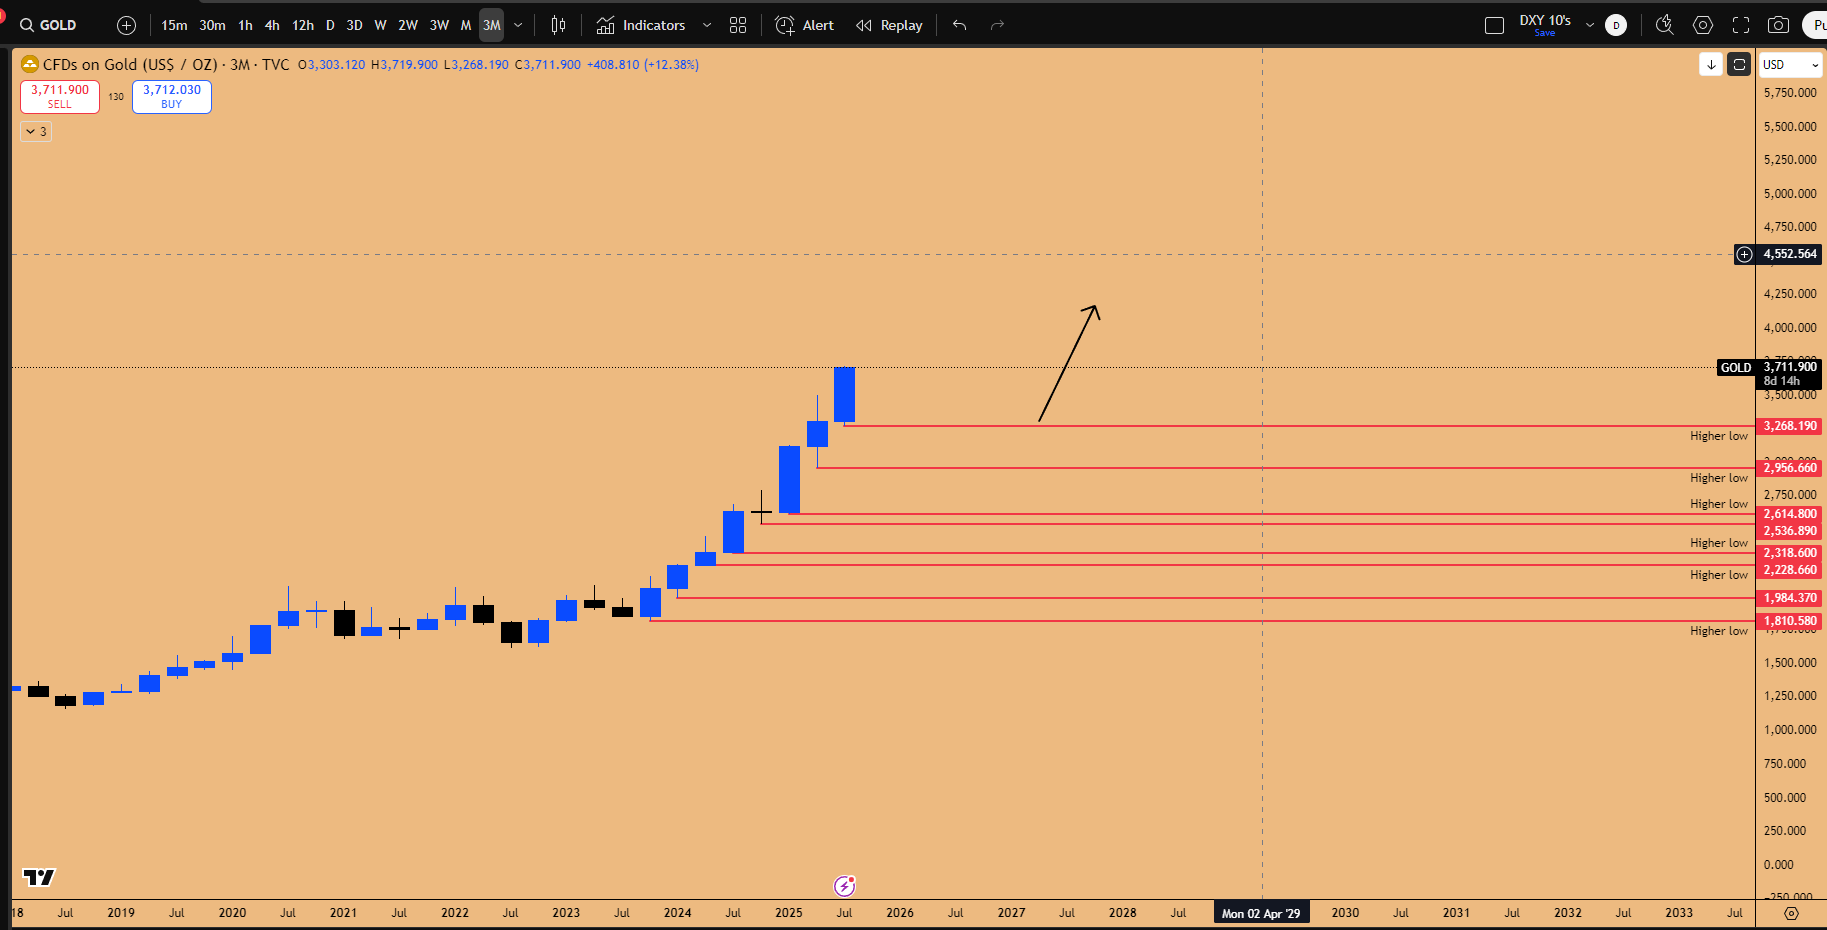
Figure 6: Gold quarterly outlook, maintaining higher lows during melt-up phase
💵 The Macro Reality: Currency Debasement and Wealth Protection
The entire reason risk-on asset classes are moving higher is rooted in macroeconomic shifts: yields (specifically the 10-year yields) are coming lower, and consequently, the DXY (Dollar Index) has been coming down. This signals currency debasement.
When the DXY is coming down, the purchasing power of the currency decreases. Sitting in cash means losing value. If a currency gets devalued by 10%, $10,000 becomes $9,000 in real terms.
The Institutional Imperative:
Large hedge fund managers and institutional portfolio managers understand this dynamic intimately. They cannot afford to lose the purchasing power of their assets. Losing 10% on $1 billion is a $100 million loss. To protect and leverage their wealth, they take on risk and move capital into assets that outperform during currency debasement:
NASDAQ 100
S&P 500
Bitcoin
Gold
If the currency goes down 10%, assets like the NASDAQ might go up 30% or 40% as this capital flows into these assets.
The Impact on Individuals:
Average individuals often do not realize their bank savings are losing value over time. They experience this loss when purchasing goods and services (Amazon, Netflix, iPhones) that become more expensive year over year. Companies raise prices to keep up with inflation caused by currency debasement.
Wealth Protection Strategy:
It is crucial to have money invested in indices like the S&P 500, NASDAQ, or Gold. These assets are bulletproof in terms of protecting against inflation and currency debasement. The capital appreciation (e.g., $10,000 growing to $15,000) ensures that you can afford the rising prices of products and commodities without losing real wealth.
A long-term portfolio (retirement or life savings), separate from trading and investing portfolios, should be established and left untouched. This has been the greatest wealth generator, consistently beating inflation for the past 15-20 years. Since the COVID bottom, an S&P 500 fund would be up 200% over five years.
The Long-Term Perspective:
Recessions and market corrections (the 1929 depression, 1970s stagnation, 1987 collapse, 2000 tech bubble, 2008 recession, COVID pandemic, 2022 bear market) are inevitable. However, history shows the market always recovers and goes higher.
A powerful example of generational wealth creation: If $100k was invested in the S&P 500 in 1994, it would have generated a 500% return by 2017, turning into $500k, despite going through the tech bubble burst and the 2008 collapse. For long-term portfolios (20-30 years), there is no "good time" to start, as the market will continue to rise. Investments should be in stable funds, such as those managed by BlackRock (iShares) or State Street (e.g., GLD, IBIT), not obscure coins or NFTs.
Strategy Session: Q&A and Active Setups
This section addresses specific questions regarding portfolio allocation strategies and highlights an active trade setup identified in the European markets.
Long-Term Allocation: QQQ vs. SPY
When considering long-term allocation for wealth protection and growth, the choice of index fund is critical.
SPY (S&P 500 ETF): This is the standard allocation for the S&P 500 index, providing regular market returns.
SPMO (Leveraged S&P 500 ETF): Offers 2x leverage on the SPY ETF. While it can enhance returns during bullish periods (e.g., 55% return vs 38% for SPY from a recent bottom), it is not recommended for very long-term holds but can be used if confident in the market outlook for the next 6-12 months.
QQQ (NASDAQ 100 ETF): This is the tech index and the recommended vehicle for timeless allocation, especially for long-term holds.
Performance Comparison (Since COVID Bottom):
SPY: 204% return.
QQQ: 263% return.
QQQ will always outperform SPY because it represents the growth sector, dominated by large tech companies that outgrow other sectors (financial, biotech, energy). If the belief is that AI technology will be a major growth driver over the next 20-30 years, QQQ is the best bet as it captures all the major tech companies.
On Timing Entries:
While long-term allocation is crucial, entries should be strategic. Generational opportunities arise during specific pullbacks where specific triggers are presented. The approach should not be to FOMO into the market just because it is going up, but to wait for defined opportunities, such as the one identified at the recent bottom where 100% of the portfolio was deployed.
Active Trade Setup: The DAX Inside Candle Failure
A notable pattern has been observed in the DAX (German stock index), providing a proper trigger based on an inside candle failure. Further upside is anticipated.
DAX Trade Setup:
A pullback into the key level offers a very good risk-reward ratio for a long position.
Pattern: Inside 3-week candle failure (Note: 3-week candle has 12 days left to close).
Entry: 23,433 (or around 23,476).
Stop Loss: Right below the inside 3-week candle low at 23,369.
Target: 24,101.
Risk-Reward Ratio: 5.45.
This is considered a very good setup to take on the DAX moving forward.
Key Takeaways and Outlook
As we conclude Q3 and look ahead to Q4, the market environment remains highly dynamic, characterized by a "melt-up phase" driven by liquidity and the AI revolution. The market is moving "on steroids," defying traditional seasonality and algorithmic expectations.
Cross-market analysis remains essential. The 100% correlation between the Nikkei and NASDAQ continues to drive global risk appetite, supporting Bitcoin. Discrepancies between these indices, where one lags the other, offer high-probability catch-up trades.
The AI bubble in US equities presents the most significant opportunities currently. The strategy is to ride the bubble with leverage and disciplined risk management, focusing on leaders like Microsoft. The massive expansion in Capex by Google, Microsoft, and Amazon signals confidence in future revenue explosions driven by AI and cloud infrastructure. Alibaba also presents a compelling, albeit high-risk, opportunity as China competes in the AI race.
Historical fractals provide confidence and potential blueprints. Microsoft's current setup mirrors its 1996 breakout, which preceded a 670% rally, suggesting the current expansion is still in its early stages.
In cryptocurrencies, consolidation is expected until the Q4 open. Bitcoin is potentially forming an ascending triangle for a year-end breakout, while Ethereum has broken out of a multi-year consolidation, targeting 10k. Setups in Sui and XLM based on inside candle failures remain valid.
Gold is targeting 4000, and traders must avoid shorting based on overbought conditions, recognizing that bubbles can remain extended. The underlying macro driver for all risk-on assets is currency debasement, emphasizing the critical need for long-term investment in indices like QQQ to protect purchasing power and generate wealth.
Looking ahead, the focus shifts to the quarterly open in 10 days and the upcoming earnings season in October, particularly Microsoft's earnings on October 20th. The next comprehensive Quarterly Outlook will be hosted on September 30th, covering currencies (DXY, USDJPY) and strategies for positioning for Q4 expansion.
What's your take on the AI bubble and the equity setups? Are you positioned for the Q4 crypto expansion? Share in the comments—let's discuss strategies. Subscribe for more market breakdowns!
Disclaimer: This isn't financial advice – just market musings from the charts. Always do your own research.
If you enjoyed this deep dive, please share it with fellow traders!