

The Endgame Playbook: Why Negative Real Yields Will Drive Parabolic Moves
Bitcoin, Gold, and Stocks


Executive Summary
Welcome to your mid-week market breakdown for August 13, 2025. Today, we're taking a comprehensive look at the powerful undercurrents shaping our markets, from the immediate drivers this week to the seismic shifts expected next year. The central thesis is a game changer: the US government is on a path toward negative real yields, a scenario where the return on 10-year Treasury bonds, stripped of inflation, is less than zero. This isn't just a theoretical concept; it happened during the COVID era and is poised to return around May, June, or July of next year. The US government will likely achieve this through a form of yield curve control, buying its own bonds in coordination with the Fed.
What does this mean for your portfolio? When holding a government bond guarantees a loss of purchasing power, capital will flood into "free assets" seeking a return. This is the endgame playbook that will ignite parabolic, multi-year trends. We're forecasting another 30-40% upside for gold as its historical inverse relationship with real yields reasserts itself. Bitcoin, now increasingly seen as a risk-on store of value, could see gains of 40-60%. And stocks, particularly the S&P 500, will find rocket fuel in these suppressed yields, driving them dramatically higher. This environment will also naturally lead to a weaker US Dollar, though the Euro's performance remains a key variable.
In the immediate term, the market is being driven by traditional macro forces. The US-Germany 10-year yield spread is once again the primary driver of the Dollar, signaling that monetary policy is back in the driver's seat. As this spread falls, so does the Dollar, making it a poor time to be short USD pairs. Meanwhile, the crypto market is experiencing a selective altcoin season. Our synthesized altcoin indicator broke down below the key 66% level, unleashing a "runaway train" of capital into alts. This isn't a tide that lifts all boats; money is flowing selectively into assets like Ethereum, which shattered the $3,960 resistance level and has added a staggering $100 billion in market cap in just six weeks.
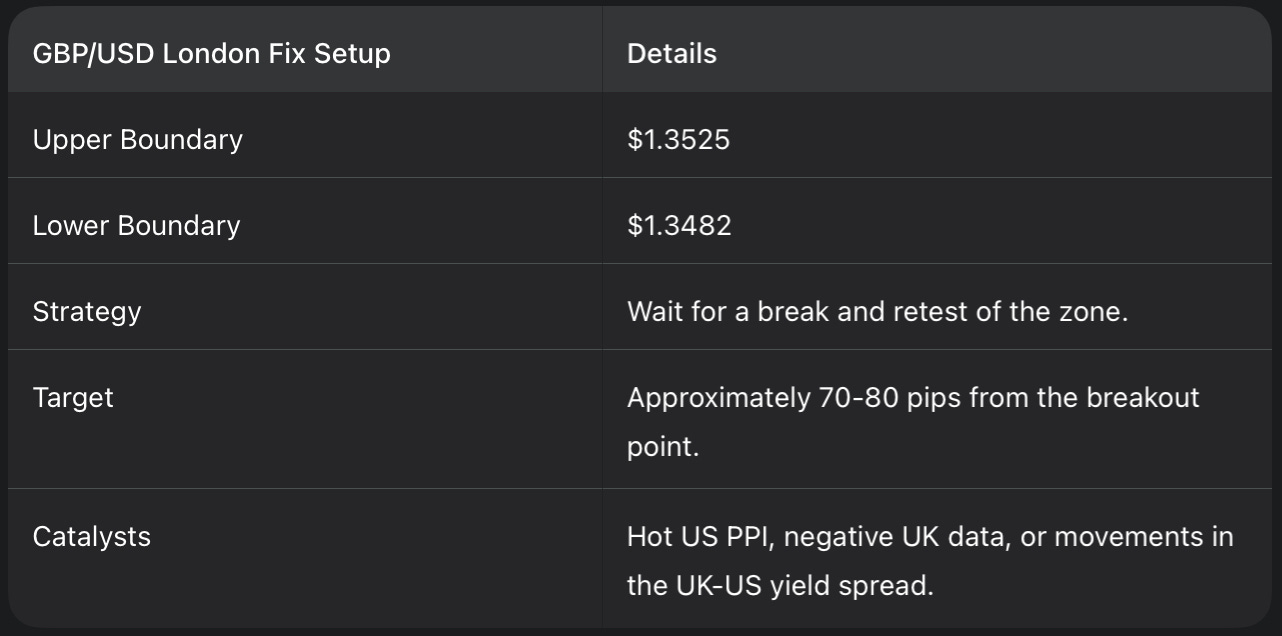
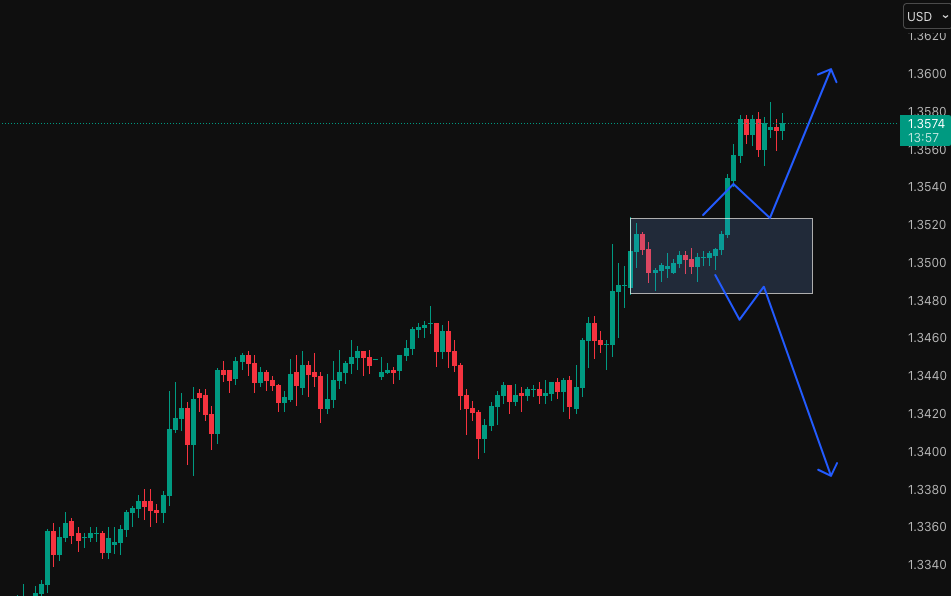
For the week ahead, we have actionable setups. A key one is the GBP/USD post-CPI London fix, with a tight range between 1.3482 and 1.3525. A confirmed break and retest offers a potential 70-80 pip trade. While the S&P 500 and NASDAQ are pushing towards new highs (6,500 and 24,000 respectively), other indices like the German DAX and the Dow Jones are lagging, suggesting a more cautious approach to swing trading them until the Jackson Hole meeting at the end of the month provides more clarity. This is a time for selectivity, for keeping powder dry, and for understanding the powerful long term forces at play.
Key Takeaways from the Livestream:
Long-Term Bullish Thesis: Negative real yields, driven by US government policy, will create parabolic moves in Gold, Bitcoin, and the S&P 500 starting next year.
Current Market Driver: The dollar is being driven by the US-Germany yield spread, confirming monetary policy is the dominant narrative.
Altcoin Market: A selective alt season is underway, with capital flooding into specific assets like Ethereum after a key indicator breakdown.
Actionable Trade: A high-volatility setup in GBP/USD based on the London fix range.
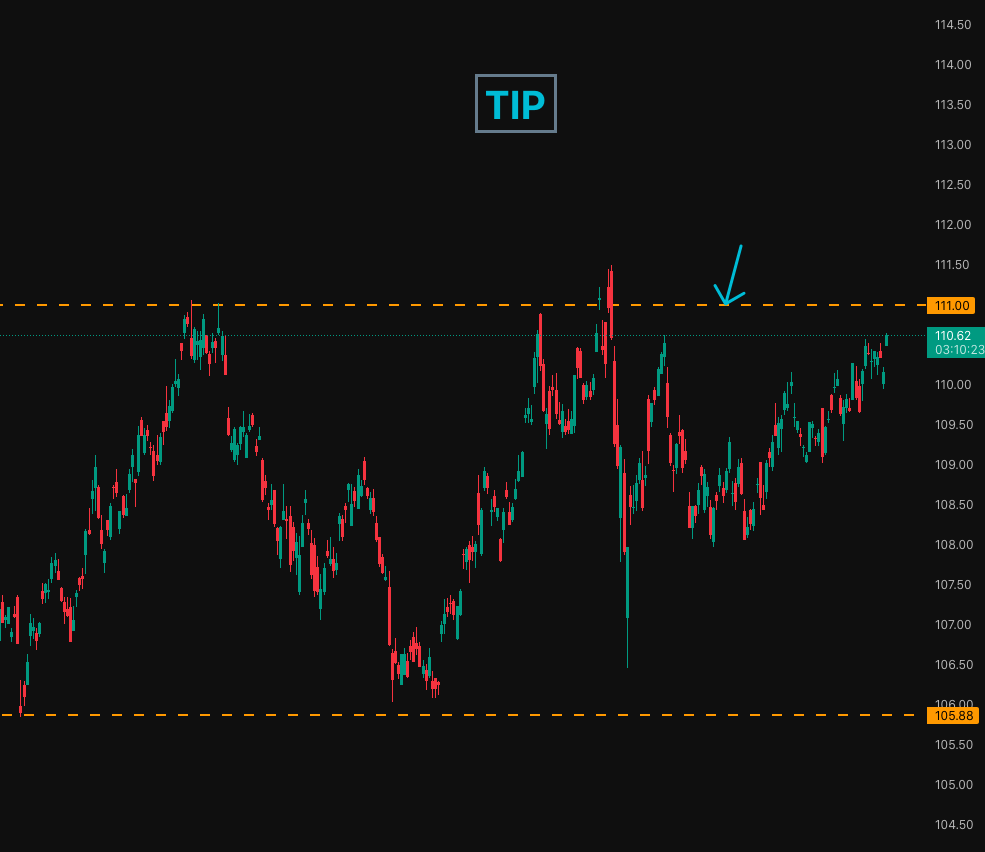
Crucial Warning Signal: Keep an eye on the TIPS chart. A move above the 111 level would signal a stagflation trade and could trigger a significant risk-off dip in equities before the Fed's "endgame" begins.


The Long-Term Secular Trend: The Coming Age of Negative Real Yields
The most significant trend brewing under the surface is the trajectory of US real yields. This is the long-term, secular trend that will define asset performance for years to come. It’s crucial to understand what this means, why it’s happening, and how it will translate into opportunities.
The Government's Endgame: Yield Curve Control and Its Consequences
The core of the long-term thesis is that the US government will eventually run negative real yields. Real yield is the return you get on a US Treasury bond after stripping out the inflation component. If real yields are negative, it means that by holding this bond for its entire term, you are guaranteed to lose purchasing power. This isn't unprecedented; we saw this happen from the COVID period all the way until May 2022. While common in Japan, it was a relatively new phenomenon for the US.
The belief is that this will become official policy, likely starting around May, June, or July of next year (2026) when the new FOMC Chair comes on. The government will achieve this through a form of yield curve control, where the Treasury and the Fed work in tandem to suppress yields, which will involve the government buying up a lot of its own bonds.
Once this endgame is initiated, it will drive "free assets" dramatically higher. Why? Because rational investors will not accept a guaranteed loss in government debt. They will seek returns elsewhere, creating a flood of capital into other asset classes. The narrative is not fully built yet; there are still many denials and short-term distractions like rate cut debates. But beyond this noise, this is the underlying driver we are heading towards. This is the playbook.
Gold's Resurgence: A Return to a 40% Upside?
One of the primary beneficiaries of this environment is gold. Historically, gold has had a very well-defined inverse relationship with real yields. When real yields fall, gold rises. This relationship appeared to break down around July 2022, but we believe it is set to return with a vengeance.
When real yields started to climb, gold weakened. Once the new policy of negative real yields is enacted and they begin their sustained descent, we expect this relationship to drive gold significantly higher. The forecast is for a potential move of another 30% or even 40% from current levels.
Bitcoin as a Store of Value: The Path to a 60% Rally
Another asset poised to benefit massively is Bitcoin. While still considered a risk-on asset, Bitcoin is increasingly being adopted as a store of value, especially during risk-on periods. As capital flees negative-yielding bonds, a significant portion will find its way into the crypto market's flagship asset. The expected move is substantial, on the order of 40% to maybe even 60%. This is a direct consequence of the same macro-financial repression that will lift gold.
Fuel for Equities: How Suppressed Yields Will Lift the S&P 500
It might seem counterintuitive, but stocks in general, and the S&P 500 in particular, will be a major beneficiary of this orchestrated yield suppression. When real yields drop dramatically, it acts as powerful fuel for equities. We've seen this pattern play out before. Initially, a sharp drop in yields can cause some market anxiety, but it ultimately becomes the foundation for a strong rally in stocks. With the Fed and Treasury working hand in hand, this becomes an even more potent catalyst. The message is clear: lower yields make equity risk premiums more attractive, pushing valuations higher.
The Dollar's Dilemma: A Weaker Future
All else being equal, a policy of negative real yields should translate into a weaker US Dollar. However, this comes with a critical caveat. The Dollar Index (DXY) is a basket of currencies, and about 60% of that basket is the Euro. Therefore, the Dollar's fate isn't solely in its own hands. If the Eurozone engages in its own aggressive devaluation policies, the Dollar might not drop as much as expected on a relative basis. But the underlying pressure from US policy will be decisively bearish for the greenback.
Navigating the Now: Current Market Drivers and Short-Term Catalysts
While the long-term picture is taking shape, we must trade the market in front of us. Right now, the drivers are more traditional, but they offer clear signals about market direction and sentiment.
The Macro Driver: Why the Treasury-Bund Spread Dictates the Dollar
The clearest macro driver for the US Dollar right now is the yield spread between the 10-year US Treasury and the 10-year German Bund. This spread, which reflects the difference in monetary policy expectations between the US and Europe, had decoupled from the Dollar for a period but has now fallen back into a very tight correlation.
When the spread falls, the Dollar falls with it. This tells us that monetary policy is back in vogue as the market's primary focus. Following the recent CPI print, which reinforced that rate cuts are on track, this dynamic has solidified. The key takeaway for traders is that this is a bad time to be shorting the US Dollar or any major USD pair. Our macro tools are working, and this is the dominant theme for the current week and month.
The Altcoin Explosion: A Selective "Easy Mode" Market
The crypto market is telling a fascinating story. Our synthesized altcoin indicator, which is composed of stablecoin dominance plus Bitcoin dominance and moves in inverse correlation to altcoins, has provided a powerful signal. We were watching for a break of the 66% level, and as soon as it gave way, it triggered a fast elevator move down for the indicator. This was the starting gun for a powerful rally in altcoins.
The mechanics are simple:
Stablecoin Dominance Drops: This means money is leaving stablecoins and flooding into the crypto market.
Bitcoin Dominance Also Drops: This signifies that the new money isn't just going to Bitcoin; it's flowing into the broader altcoin market.
This has created what some in our community call an "easy mode" environment, but with a twist. Unlike past cycles where a rising tide lifted every single altcoin, this is a more selective alt season. Capital is flowing into specific, strong projects, meaning traders also need to be more selective in their approach.
Case Study: Ethereum's Runaway Train
The primary beneficiary of this new capital flow has been Ethereum. The moment the altcoin indicator broke down coincided perfectly with Ethereum breaking above its key resistance level of $3,960. This triggered a runaway move.
The numbers are staggering:
Over the last six weeks, Ethereum has added approximately $100 billion in market capitalization.
In just the last four days alone, it is up another 16%.
This is a runaway train. The money flows first into a market leader like Ethereum, and from there, it begins to trickle down to other large-cap alts like Solana and other promising projects. This confirms the need for a selective approach to capitalize on the current altcoin rally.
Actionable Setups and Weekly Outlook
August is historically a month where most assets chop sideways while a select few make significant moves. That's why we've closed many of our longer-term positions and are now focusing on high-conviction, shorter-term trades while we wait for the expected jolt of volatility in late August and early September.
FX Trade of the Week: The GBP/USD London Fix Setup
For FX traders, the post-CPI price action in GBP/USDhas created a clean and actionable setup. The "London fix" has established a clear range that is containing price. For a day trader, this is an ideal scenario to watch for a volatility-driven breakout.
The thinking is that a decisive break of this zone, followed by a retest, should lead to a 70 to 80 pip move. This trade would be accelerated by a hot Producer Price Index (PPI) print on Thursday or negative data out of the UK. We're also seeing the UK-US yield spread stall at current levels, which supports the idea of rotation within this range. While the bias is for a move down, as nimble traders, we are prepared for a break in either direction
Gold's Six-Week Cycle: Staging for the Next Leg Up
In the gold market, we are currently operating within a six-week cycle trade. The price action isn't overly encouraging as it's chopping within a zone, but this is a way to circumvent local volatility and position for the next move. We are looking for Gold to bounce from the $3,300 - $3,350 support area to then make a move to attack the $3,400 level.
The Tale of Two Markets: S&P/NASDAQ vs. DAX/Dow
The indices are showing a clear divergence. The leaders, the S&P 500 and the NASDAQ, have printed near all-time highs and look poised to attack the 6,500 and 24,000 handles, respectively. These are best approached on an intraday basis for now.
However, the German DAX and the Dow Jones (US30) are lagging significantly. They haven't made any meaningful progress since July. This suggests caution when considering swing trades in these markets. The next major inflection point for all indices will likely be the Jackson Hole meeting at the end of the month. This annual gathering of central bankers often creates significant volatility and can mark a turning point for the market heading into September. For now, keep your powder dry on longer-term index trades.
Trader Q&A: Deep Dives on Oil, Yen, and Market Timing
This section addresses key questions from the community, providing deeper insights into specific assets and trading psychology.
On Losing and Resilience: "Having the right market environment nailed is infinitely more important than anything else."
A community member shared their recent struggles with losses. It's a universal experience in trading, and it's important to reframe it. Losing money is a part of doing business; it is not a reflection of your status or intelligence. The path forward involves a few key things: leaning on the community, learning from shared experiences, and building emotional resilience.
Most importantly, we must focus on the market environment. “Having the right market environment nailed is infinitely more important than anything else.”If you are using a range-trading strategy in a strong trending market, you will become cannon fodder. Success comes from matching your strategy to the current conditions—whether it's choppy and rotational or a clear, trending "easy mode." This reduces emotional strain and makes risk management far simpler.
Oil Analysis: "It is just so lame."
The oil market is currently uninspiring. While there was a thought it might be a good time to buy, it has traded below key six-week cycle levels and is simply not finding a bid. The current expectation is for oil to chop about in its current range, perhaps finding its way back above $70. A bullish stance is off the table until at least next month.
Even the geopolitical catalysts seem neutralized. An earlier rally from $58 to $76 in May was driven by the conflict with Iran. However, the notion that Iran could cause a major disruption at the Strait of Hormuz has been largely neutralized, so a flare-up is unlikely to drive prices much higher. For now, oil is a choppy market, even for intraday trading. It's just so lame.
The Yen Conundrum: A Market Held Hostage by Yields
Yen pairs are typically driven by yields, and USD/JPYis a slave to US Treasury yields. The thesis is that US yields are unlikely to move beyond 4.5%. They are currently building for what looks like another move lower. This implies that USD/JPY's trend is also to the downside. The path would likely involve a break below 146, then 144, and ultimately 142.
However, the conviction on this trade is very weakbecause yields are simply chopping about with zero momentum. Other Yen pairs like GBPJPY and AUDJPYtell a different story. They are strong because the Bank of Japan is hiking rates into a period of strengthening inflation, which is negative for the Yen. This has created great trending moves, like our successful long trade on AUDJPY during the last six-week cycle. This highlights the selective nature of the current market.
The Billion-Dollar Question: Should We Wait for the "Big Dip"?
Are we expecting one more big dip in BTC, Gold, and the S&P 500 before the massive multi-year move up? In my experience, there is always going to be a big move down before that happens. The natural follow-up is, should you wait for it?
The answer is no, I would not wait. The problem with waiting is that the drop could be eight months away. You cannot time it perfectly. The better approach is to trade the market as it presents itself now, while keeping the long-term endgame in the back of your mind. The ultimate confirmation for the massive trend higher will be when you see the Fed actively buying bonds and, most importantly, when real yields begin their sustained track lower. That is the ultimate tell.
The Curveball to Watch: When TIP Cross 111
Here is a curveball that every trader needs to have on their radar. TIPS (Treasury Inflation-Protected Securities) are inversely correlated with real yields. When TIPS go up, real yields go down. I am watching the 111 level on the TIPS chart (currently trading at 110.16).
Why is this level so important? Because it's the point where bond traders will likely go "big on the stagflation trade." They will be seeking protection from inflation while simultaneously believing that growth will be terrible (as hinted by the bad NFP print on August 1st). If and when we cross this Rubicon of 111 on TIPS, it makes perfect sense that we would see that significant risk-off dip in equities. This could be the event that precedes the Fed fully stepping in. This chart is critical because it will signal a short period where falling real yields are negative for the market, before they become the fuel for the parabolic rally. Navigating this transition will be key
Key Takeaways and Outlook
As we head towards the latter half of August, the market presents a dual narrative. The long-term outlook for assets like Bitcoin, Gold, and equities is extraordinarily bullish, predicated on a coming era of negative real yields driven by government policy. This is the multi-year endgame we are positioning for.
In the short term, however, the environment demands selectivity and patience. August is living up to its reputation for being choppy. While leaders like the NASDAQ and S&P 500 push higher, other markets are lagging, and clear trends are scarce outside of the selective altcoin space. The key event to watch is the Jackson Hole meeting at the end of the month, which promises to inject a fresh dose of volatility and clarity as we head into September. Keep your risk managed, stay nimble, and have your watchlist ready for the high-conviction setups that will emerge. The opportunities are building, and it's going to be an awesome ride.
Disclaimer: This isn't financial advice just market musings from the charts. Always do your own research.
If you enjoyed this deep dive, please share it with fellow traders!