

The Final Market Curtain
What Happens After the VIX Spike?

⚡ TLDR;
Welcome to this comprehensive analysis derived from the 19th livestream episode, a crucial deep dive as the US earnings season kicks into high gear. This period brings massive volatility, setting the stage for new trends across equities and cryptocurrencies. This post exhaustively unpacks the critical market dynamics discussed, from the mechanics of volatility control funds to specific bullish setups in tech giants like Netflix and Microsoft, and a nuanced, cautionary outlook on Bitcoin contrasted with a bullish stance on Ethereum. We explore why the recent spike in the VIX likely marked the Quarterly Low for indices and how major Q4 tailwinds including
Anticipated Rate Cuts
Corporate stock buyback window reopening in first week of November
Massive Capex Spending fueling the AI boom—are creating a compulsory risk-on environment for the remainder of 2025.


The season began with peculiar price action in JPM, which sold off despite beating expectations a classic sign of an overextended stock after six consecutive bullish monthly candles. However, the focus now shifts to critical tech earnings, starting with Netflix (NFLX). Reporting in two days, Netflix exhibits a powerful inside two-month candle failure pattern. Historical analysis reveals a strong tendency for October earnings to catalyze significant gap-ups (as seen in 2022, 2023, and 2024). As a bellwether, a strong performance from Netflix is expected to immediately flip the risk-on appetite across the tech sector. During our next 20th livestream we will explore QRA dynamics and pre-Santa rally, make sure join us here Livestream.
A key underpinning of the bullish equity bias stems from recent Volatility Index (VIX) dynamics. The VIX recently spiked 46% in two days, hitting 28 a customary event in October as institutions reposition for Q4 2025 and Q1 2026. Crucially, this spike has been faded, suggesting “peak fear” has subsided and the dip has been bought. Due to the inverse correlation between VIX and Nasdaq Index, this VIX rejection, combined with the NASDAQ’s decisive reclamation of the quarterly open at 24,617, strongly suggests the low of the quarter has been set. What does this mean for your positioning? It implies a strong foundation for a sustained rally through year-end. Microsoft (MSFT) exemplifies this resilience, holding its 3-week lows and targeting $555 based on overlapping inside 3-week and monthly candle failures, bolstered by an average Q4 return of 15-18% in the past 20 year lookback period.
The bullish outlook is further supported by massive Q4 tailwinds: expected rate cuts (25 basis points in October), the AI boom driving CAPEX spending, and, critically, the reopening of corporate stock buyback windows in November. This injects massive liquidity; for context, Apple’s buybacks are equivalent to the size of GDP of an entire country(s) in the African content, the sheer size of these stock buybacks create a bullish tailwind going into year end that investors should not fight.
The cryptocurrency market, however, presents a complex dichotomy. Bitcoin (BTC) is flashing major warning signs with the confirmation of an inside monthly candle failure—a significant topping pattern. This weakness is exacerbated by the massive divestment occurring in MicroStrategy (MSTR) (which shows an inside quarterly candle failure targeting $231 to the downside) as institutions rotate capital directly into the IBIT ETF, instead of investing into MSTR to gain exposure to Bitcoin market. While a counter-trend rally to 120K is expected alongside NASDAQ strength, this should be treated cautiously. The medium-term outlook suggests a pullback toward the 90K support zone, which “IF” transpired has been identified as a “generational buying opportunity.” In contrast, Ethereum (ETH) is poised for outperformance in the short term, driven by bullish inside monthly and 3-week candle failure patterns under development, targeting new all-time highs around 5K.
Key Takeaways from the Analysis:
Equities are Risk-On: The quarterly low for NASDAQ and S&P 500 is likely set, supported by fading VIX volatility and the reclamation of the quarterly open (24,617).
Tech Leaders Poised for Expansion: High-conviction long setups in NFLX and MSFT driven by powerful technical patterns and earnings catalysts. META also presents a 4.54 RR Long setup at macro trendline support.
The November Tailwind: Expect a significant surge in liquidity and market strength in November due to massive corporate stock buybacks and potential rate cuts.
Crypto Divergence: Bullish on Ethereum for outperformance to 5K; cautious on Bitcoin due to topping patterns, viewing the rally to 120K as a counter-trend move before a potential pullback to 90K.
AI Narrative Continues: The AI boom supports revenue acceleration; Tesla is highlighted for strong November seasonality and the upcoming xAI integration shareholder vote catalyst.
📈 Earnings Season Catalysts and Volatility Dynamics
The US earnings season is now in full swing, introducing massive amounts of volatility on both sides of the market. This period is crucial for identifying trade setups in formation, as new trends unfold once the dust settles after earnings reports are concluded.
The JPM Precedent and Market Extension
The season kicked off last week with JPM reporting, offering a peculiar start. Despite the earnings being really good—beating expectations across the board—the stock did not immediately go higher. It suffered a drawdown, rallied, and is now moving down further to potentially take out the lows again.
The primary reason for this muted reaction, despite strong earnings, is that JPM has been significantly overextended. Since the bottom, it has printed 6 consecutive monthly candles on the bull side. Expecting a seventh consecutive bullish candle was considered a bit of a stretch. Nonetheless, a long position was initiated with a view toward December end. The thesis mentions that it is entirely possible that the October month for JPM results in an Inside Monthly Candle, with the true expansion starting in the months of November and December.
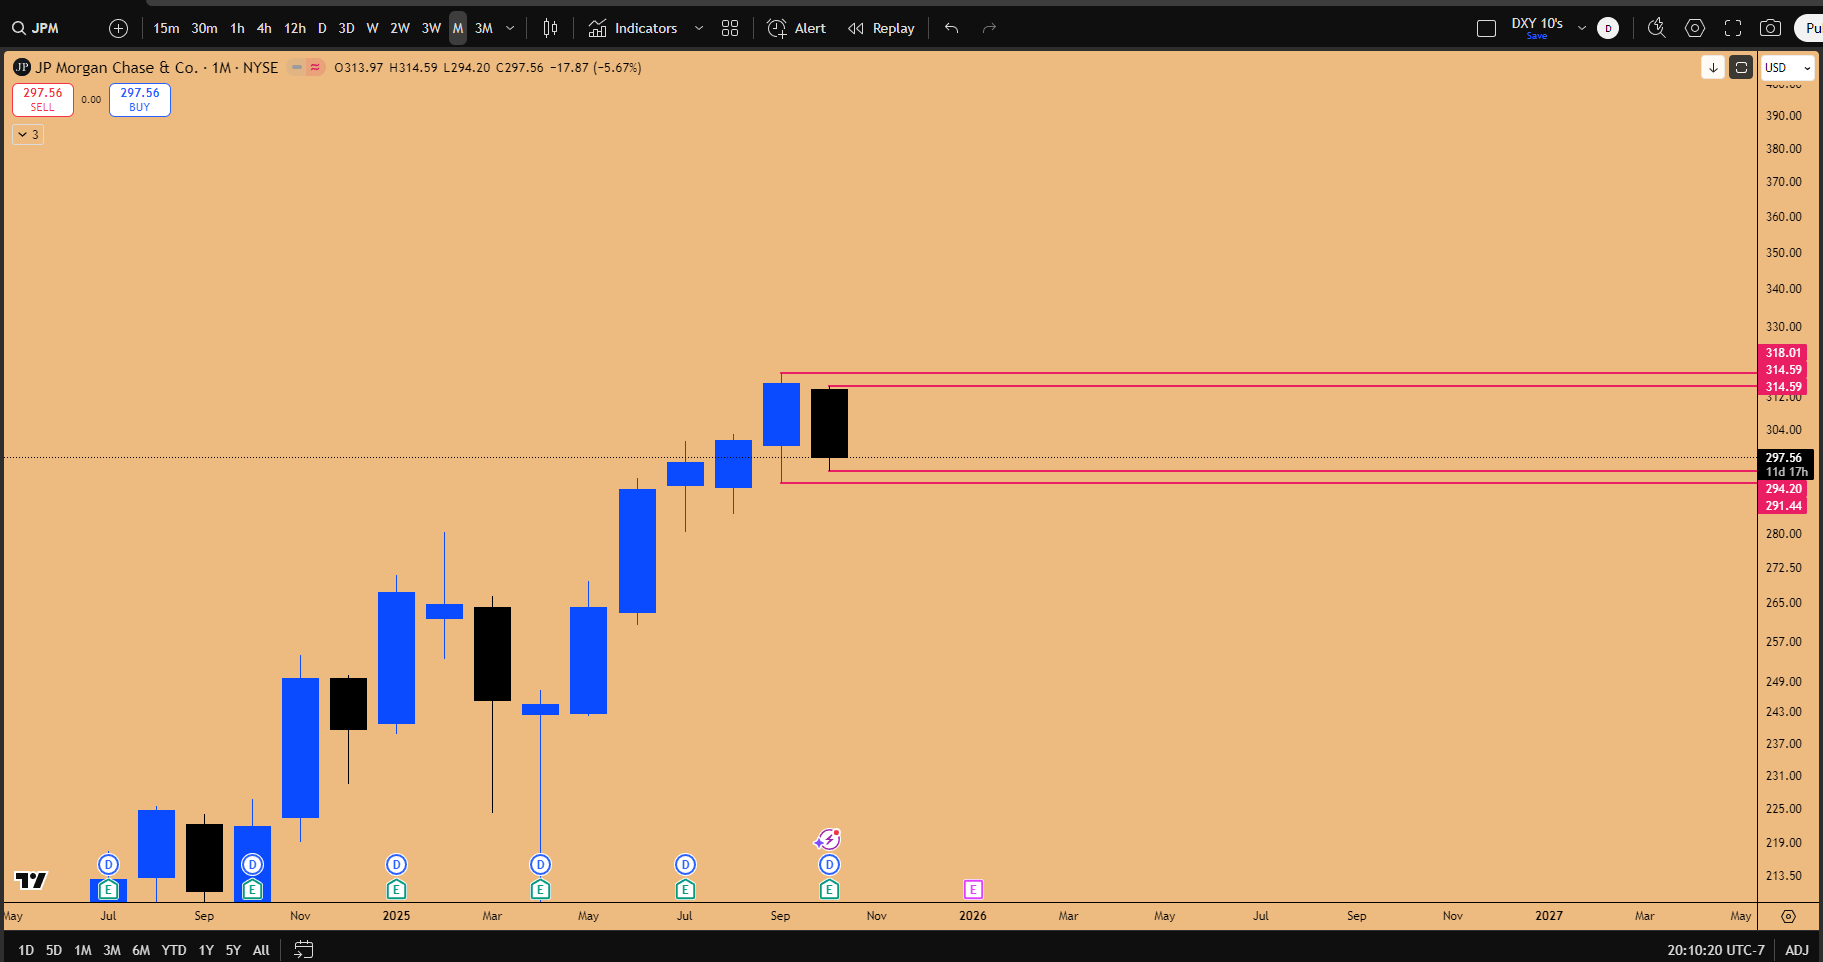
Figure 1: Inside Monthly Candle pattern in formation for JPM
The VIX Spike: Institutional Positioning and Quarterly Dynamics
In the past two weeks, we have witnessed the VIX (Volatility Index) jump significantly higher. Understanding this volatility factor is critical. It is almost customary for the VIX to spike up in October when the new quarter starts. This volatility bout is essentially institutions positioning themselves not only for the last quarter of 2025 but also for the first quarter of 2026.
This dynamic is clearly visible on the NASDAQ (NDX) chart relative to the quarterly open. The quarterly open was mapped out at 24,617. After the first day of the open, the market went up slightly, followed by a massive volatility bout that drove the price below the quarterly open. Subsequently, the market rallied, achieving a “decisive reclamation of the quarterly open.”
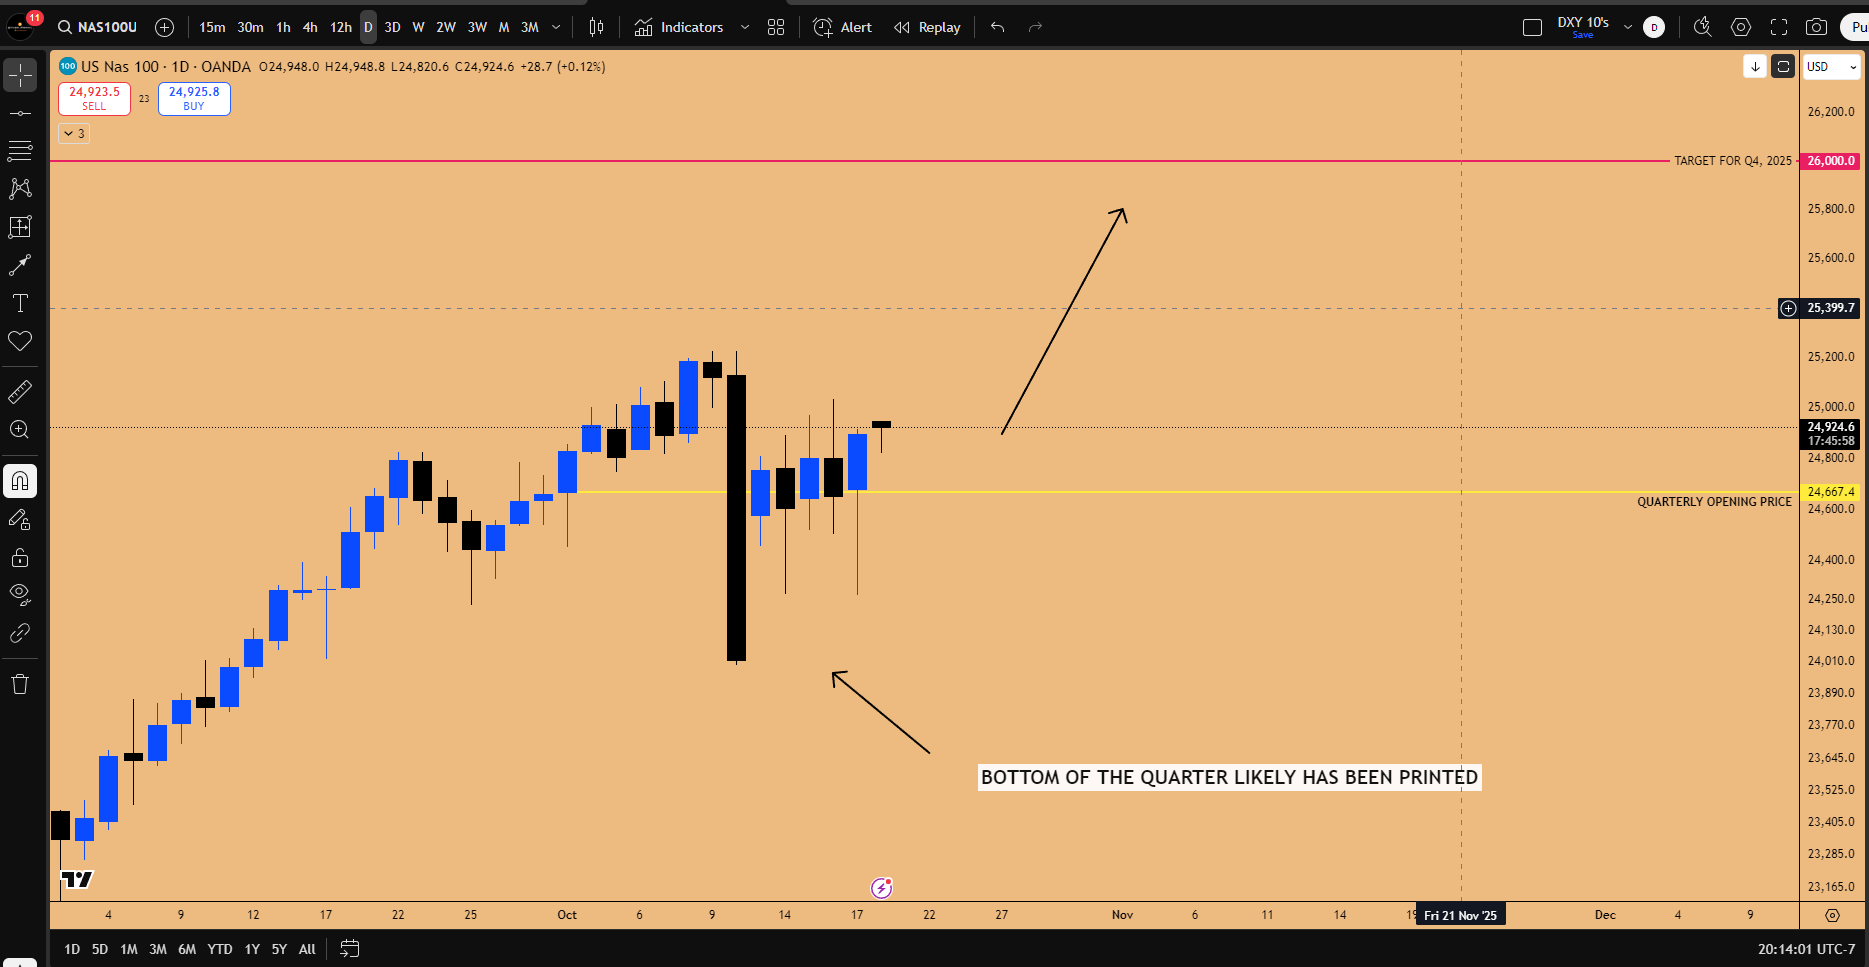
Figure 2: NAS100 bottom wick for the quarterly candle is likely solidified, expansion higher expected going into tech earnings season.
The critical insight here is that when the quarterly open is reclaimed, whatever price action happened just below it becomes the bottom wick of the quarterly candle. It is highly probable that the downside movement seen in the past two weeks was the entirety of the bottom wick, and the low of the quarter has been set in stone.
Volatility Control Funds and the Inverse Correlation
The relationship between the VIX and major indices like the NASDAQ and S&P 500 is heavily correlated due to the actions of vol control funds, quants, and other institutional funds heavily linked to volatility.
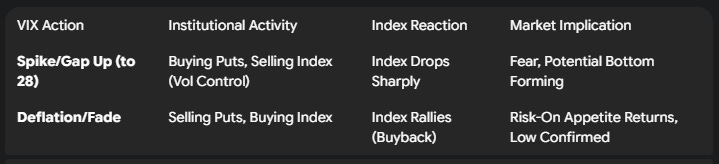
High Volatility = Lower Index: If volatility is going higher, the index will go lower. Institutions achieve this by buying put protection and using option contracts to spike up the VIX, which necessitates selling the underlying index and its constituents (Microsoft, Apple, Amazon, Meta, Tesla, Google, Nvidia, AMD).
VIX Deflation = Higher Index: When the VIX deflates, it happens because a bottom gets printed in the index, and buying pressure resumes.
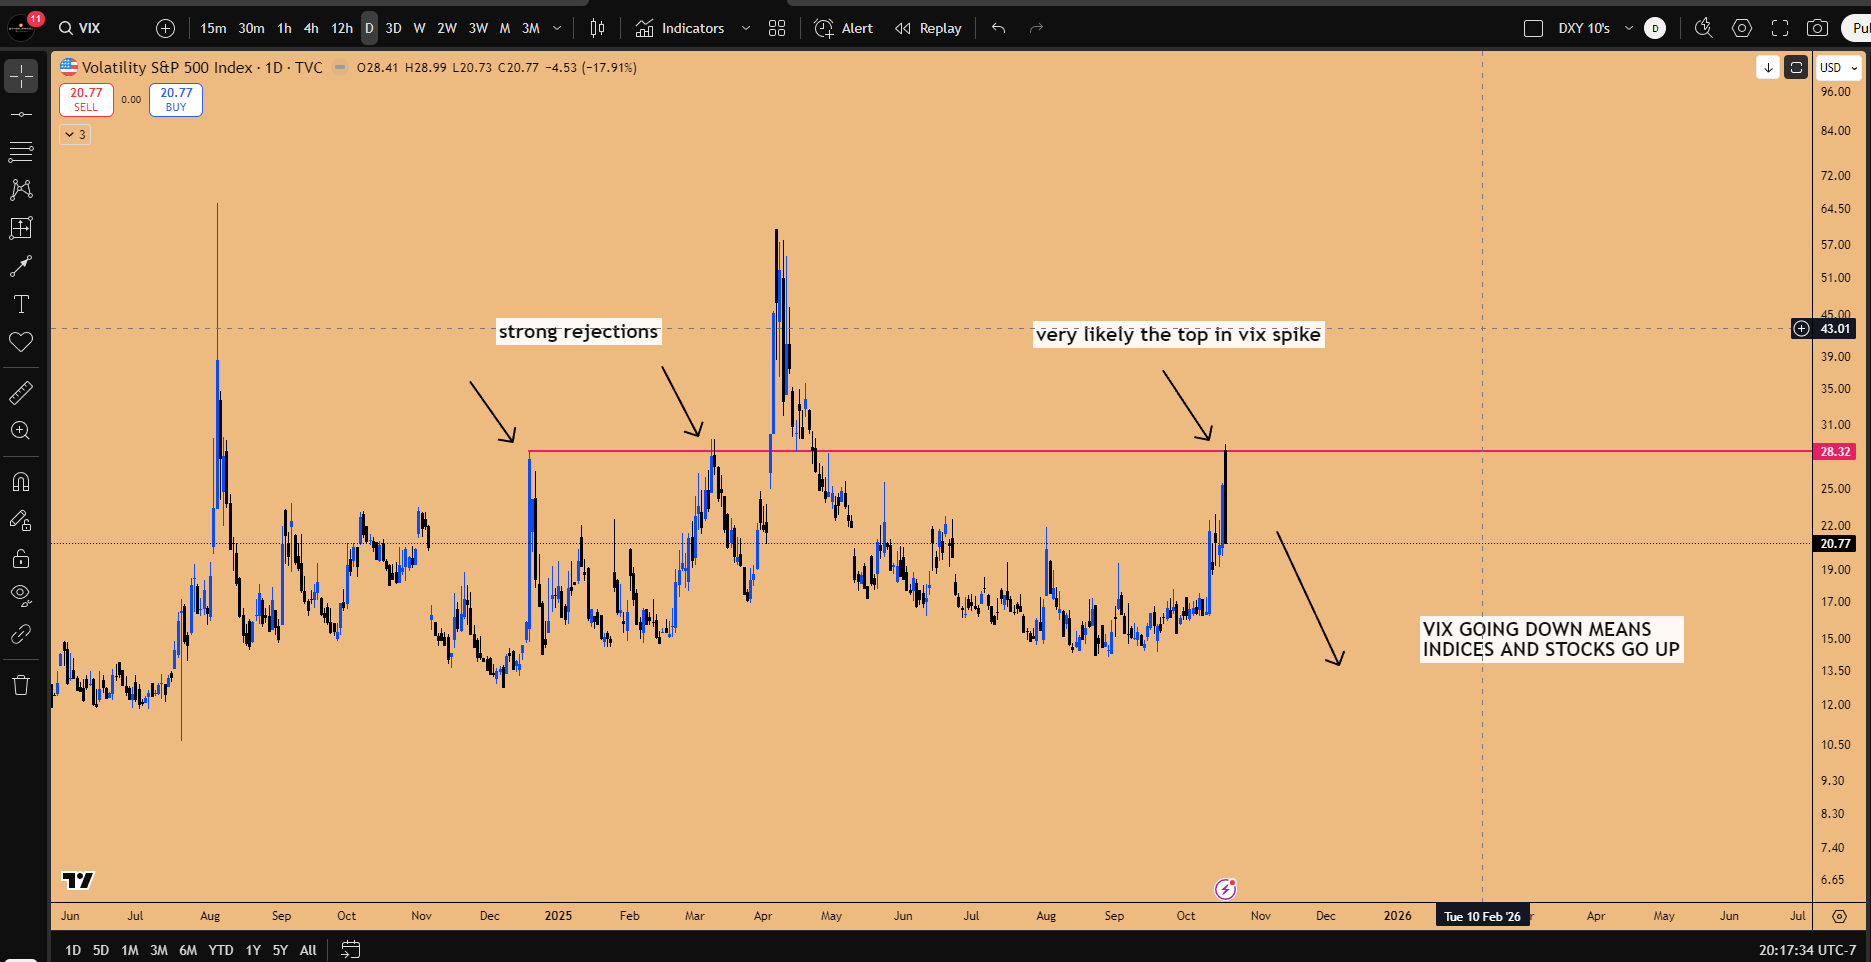
Figure 3: VIX DEFLATION INCOMING, major signal for upcoming equity rally
When the VIX starts eclipsing and forming an eclipse formation (topping pattern), there is a very high probability that a low is forming in the S&P500 Index—a low that may stay intact for months, or perhaps forever, similar to April, 2025 low earlier this year.
Analyzing the Recent VIX “Armageddon” and Market Implications
The recent short-term “Armageddon” in the VIX was highly reminiscent of events back in April, presenting a significant opportunity to position long. When the VIX experiences a massive spike followed by immediate fading or deflation (a “blowoff phase”), it rarely returns to retest the high that was just printed in the VIX. Subsequent spikes typically form lower highs before deflating again.
This price action—a massive sell-off in the VIX reflected by a buyback in the index—provides high confidence that the VIX will not take out the recent high (28). According to their inverse correlation, this means the low printed on the S&P 500 (6538) and NASDAQ (24268) on Friday is unlikely to be taken out moving forward.
This analysis provides a roadmap for risk-on appetite going into the rest of the quarter. If the low of the quarter is confirmed to be in, then swing positions can be held without hesitation for the next 2.5 months going into November and December. Furthermore, this implies that every major constituent stock in Nasdaq Index should respect the low put in on Friday. While this is a guideline rather than a rule, the probability is high due to the VIX manipulation observed. We anticipate expansion in the NASDAQ as it sits above both the monthly and quarterly opens.
💻 Tech Sector Deep Dive: Earnings, Patterns, and Projections
The tech sector is the focal point this earnings season, with specific companies poised to lead the market higher based on strong technical setups and fundamental tailwinds.
Netflix (NFLX): The October Earnings Catalyst
Netflix reports earnings in two days and is expected to set the tone for the entire tech sector. Netflix is unique in that it primarily moves due to earnings events, which historically serve as catalysts for massive expansions or deflations, with trends often lasting from one earnings event to the next.
The Technical Setup:
A very strong pattern is in play for Netflix: the Inside Two-Month Candle Failure.
The failure initiated when a low was taken out, forming a Daily Swing Failure Pattern (SFP).
A swing long position was opened during the formation of daily SFP after taking out 1144$ Swing low.
The subsequent rally broke the nearest lower high formation, changing the market structure from bearish to bullish.
This triggered the Inside Two-Month Candle Failure.
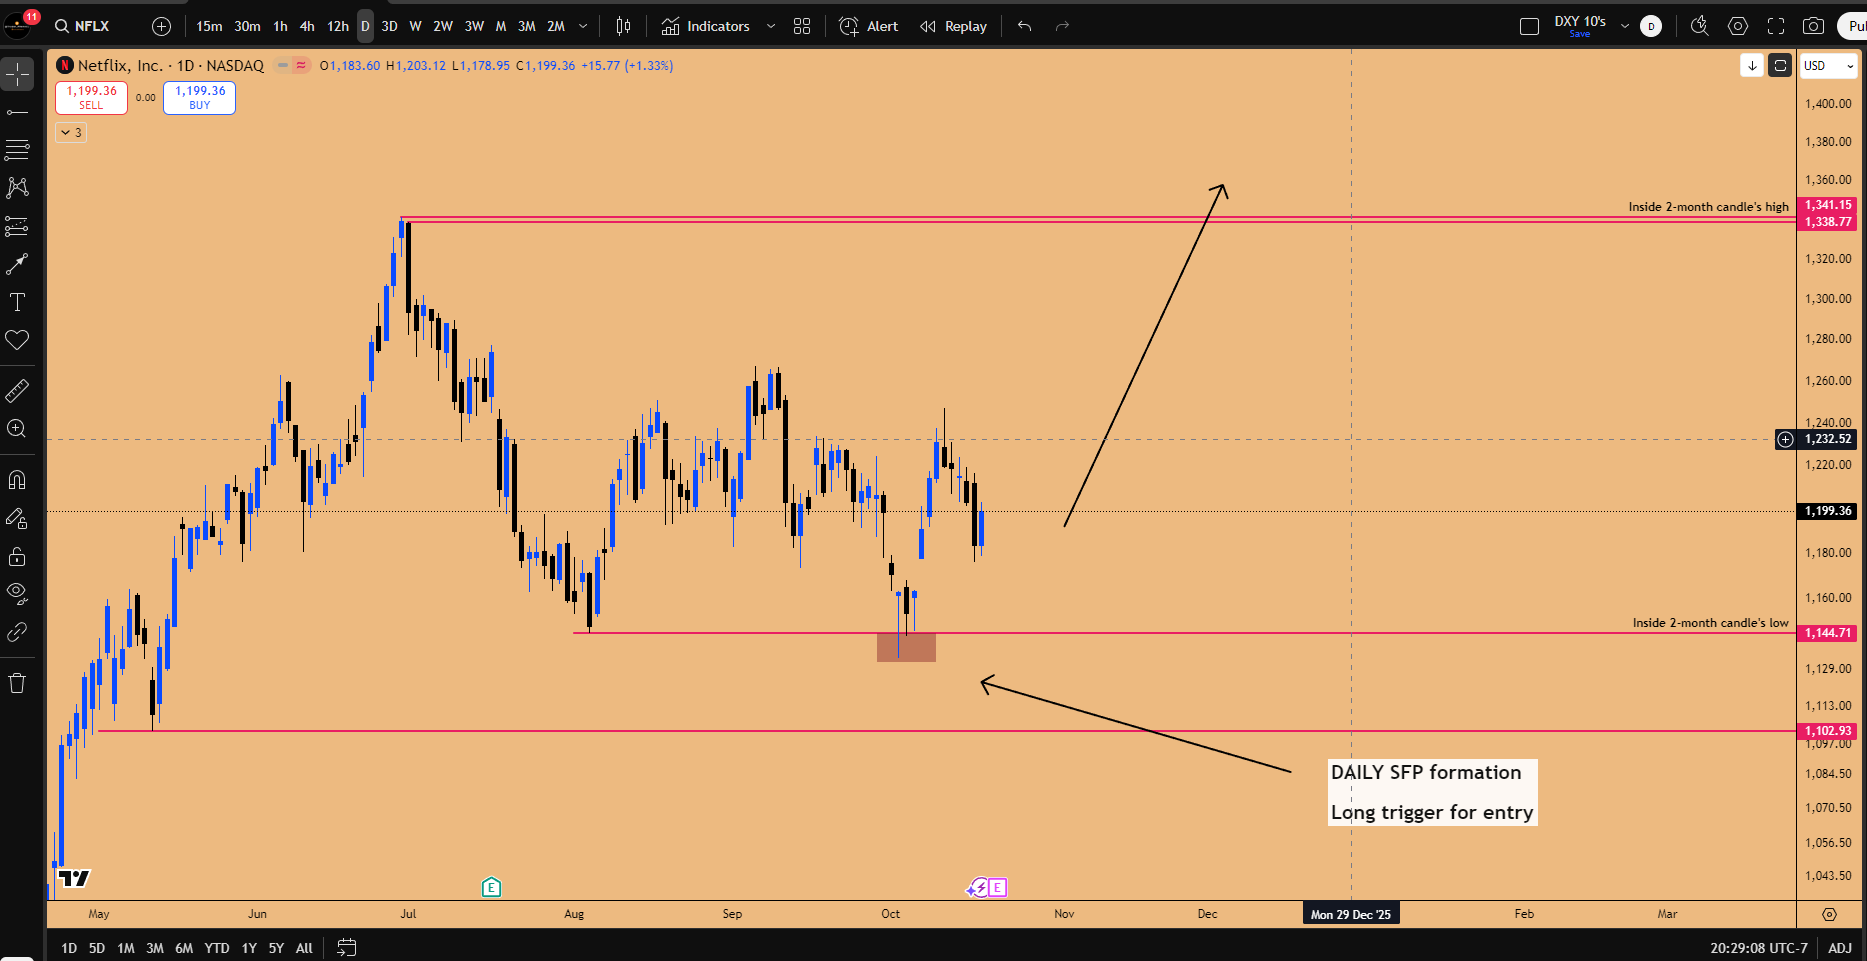
Figure 4: Daily SFP formation at 1144$ triggered long position for Inside 2-month candle failure pattern.
The expectation is for the price to start expanding, take out new all-time highs, and go beyond, potentially after earnings or into next year.
October Seasonality for NFLX:
A specific seasonal tendency has been observed for Netflix earnings reported in October (scheduled for October 21st). In every October earnings event analyzed since the 2022 bottom, the market has suffered a gap up after the report, on the heels of strong earnings beat. Given the bullish technical pattern and this strong seasonality, the expectation is that Netflix will beat earnings significantly and start expanding.
Long-Term Trends and NASDAQ Correlation:
On the 4-month chart, Netflix has been expanding higher ever since the 2022 bear market bottom. Every four-month candle has gone above the previous four-month candle’s high.
Comparing Netflix to the NASDAQ (NDX) reveals a crucial divergence. The NASDAQ has already traded above its previous four-month candle’s high and is making new highs. Netflix has not done this yet. This indicates that Netflix, being a top 20 company in the index, needs to catch up with the Index. This lag is seen as algorithmic and inevitable. A strong performance from Netflix will send reverberations across the tech sector and immediately flip the market appetite to risk-on mode.
Microsoft (MSFT): Resilience and Multi-Timeframe Failures
Microsoft presents a high-conviction long setup based on its resilience during the recent market volatility and multiple overlapping technical patterns.
Resilience Against VIX Spike:
When the VIX spiked by 46% over two days, driven by tariff headlines and political fears, Microsoft notably did not react negatively. While many anticipated a sell-off, Microsoft did not even break below the previous day’s low; it moved sideways. “I specifically mentioned this in the discussion channels that pay attention to this pattern which is developing... the stocks underneath the surface they are not reacting to this VIX spike up...” If the VIX spike truly indicated a massive sell-off, Microsoft would have experienced 2-3% down days.
Furthermore, during the drop in the NASDAQ, Microsoft came very close to, but crucially did not take out, the previous 3-week candle’s low. This shows how well-controlled the market is.
Technical Patterns and Targets:
Microsoft is confirming an Inside Daily Candle Failure pattern. This suggests the line in the sand is at $507, and expansion toward the inside daily candle high of $523 is likely. Once the daily candle closes above the $520 zone, it will target the vulnerable highs above.
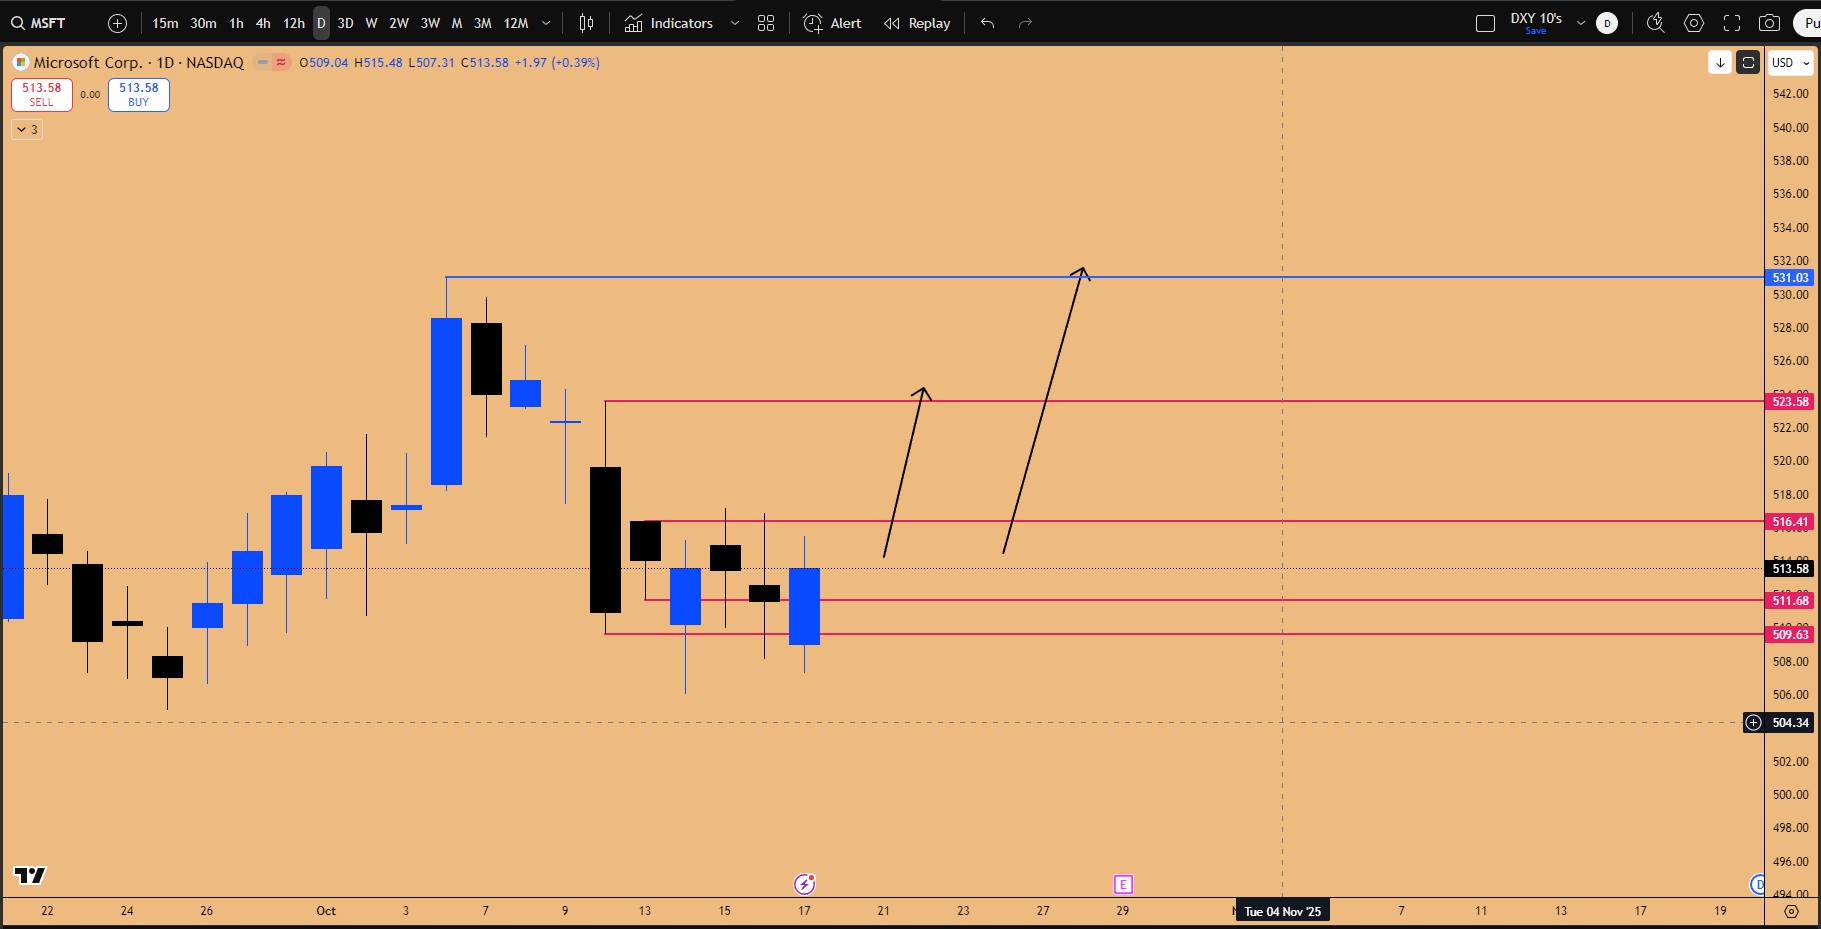
Figure 5: Inside Daily Candle Failure in play, targeting upside
The larger, more significant patterns driving the long position (held since September 5th) are:
Inside 3-Week Candle Failure: This pattern has been in development for a month and targets the upper liquidity pool at $555.
Inside Monthly Candle Failure: This overlaps with the 3-week pattern, reinforcing the bullish thesis.
The structure suggests Microsoft is confirming a higher low. This week is crucial as the 3-week candle closes; a strong close will provide a pathway for expansion when Microsoft reports its earnings next week.
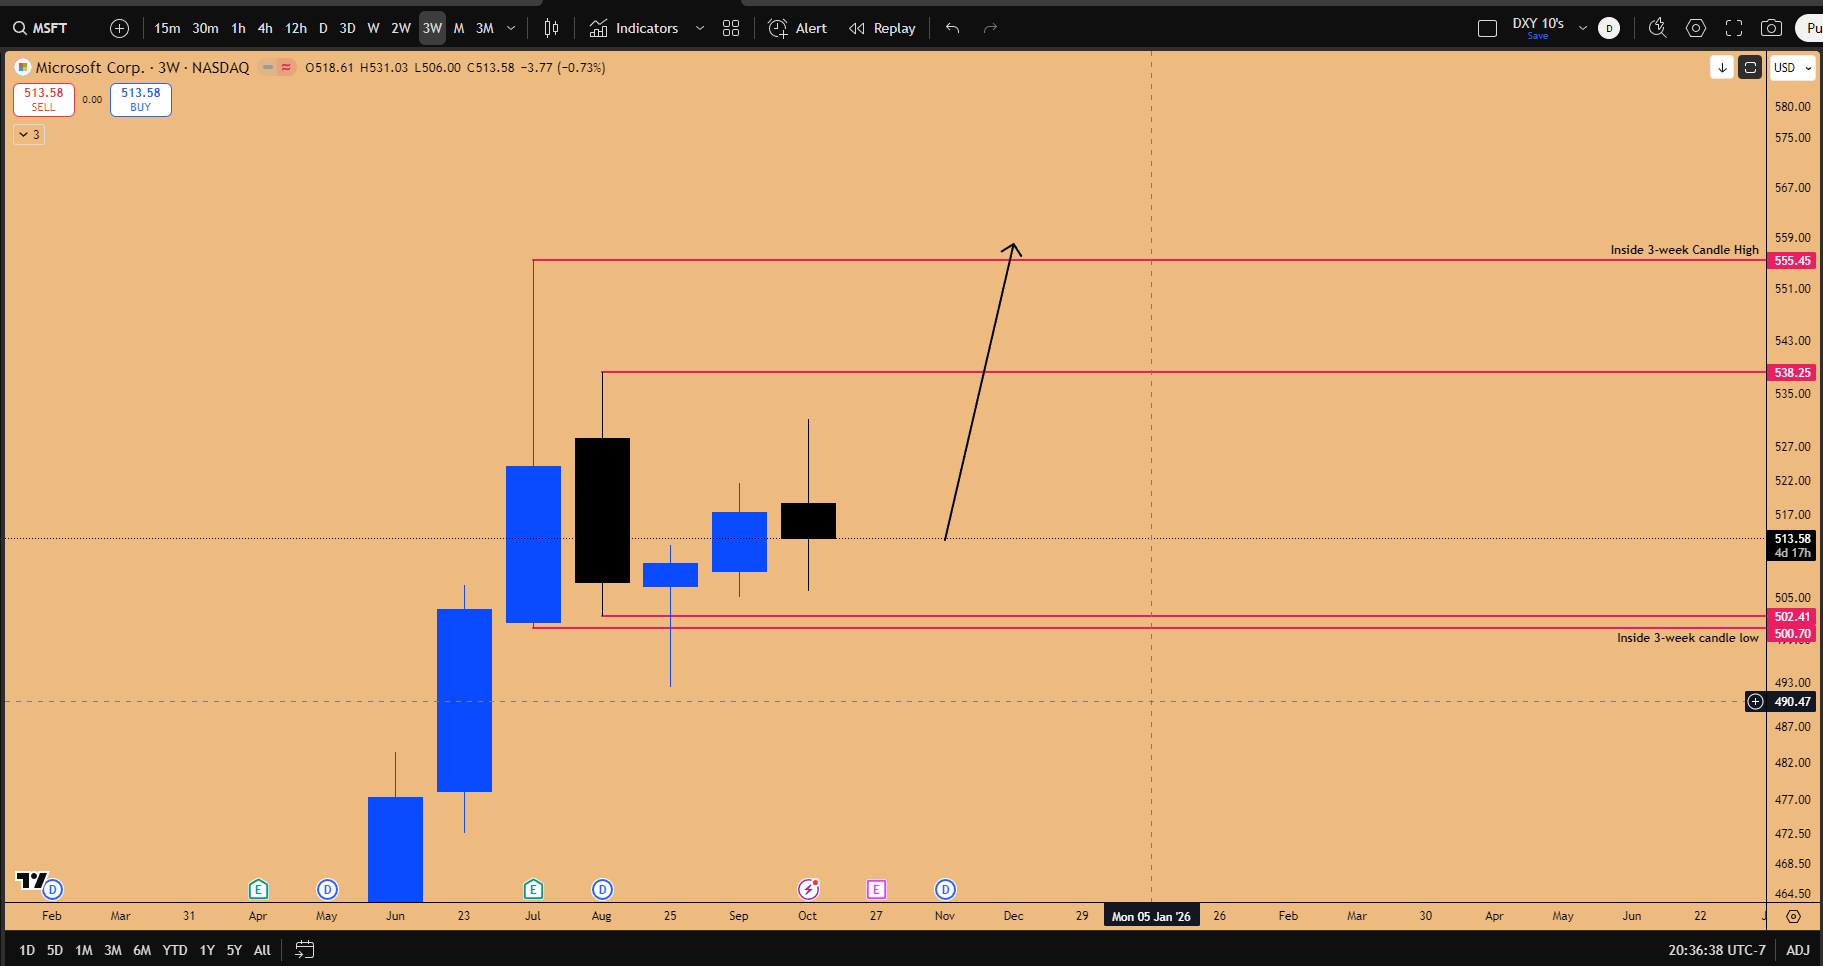
Figure 5: Inside 3-week Candle Failure pattern in play, targeting 555$ All Time Highs and beyond
Q4 Historical Performance:
Similar to the analysis conducted on Gold before its breakout, historical data suggests that in the last quarter (October, November, December combined), Microsoft averages at least 15% to 18% return. The major catalyst for this move is expected to be the earnings report itself. The current position is held with a stop loss potentially below $492 (September Month’s Low).
🔷 Meta (META): The 4.54 Risk-Reward Trendline Trade
Meta is considered a direct proxy for whatever the NASDAQ does. It presents a compelling technical setup based on a long-term trendline. On the monthly chart, connecting the monthly candle lows from the extreme bottom reveals that the price is currently retesting this monthly trend line support zone.
Last week, the market tested this trend line and printed an Inside Weekly Candle. The thesis is that with the earnings season underway, this inside candle will break out to the upside, and the support zone will hold.
The Trade Setup:
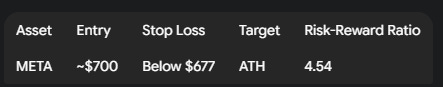
A 4.54 R:R on a swing basis is considered amazing. “When you get anything above three on a swing environment for any asset based on a battle tested strategy, you take it and ask questions later, but you take it first and then see if it makes sense or not after that.” Further research confirmed the entire framework—structure, fundamentals, revenue, and cross-market correlation—supports this technical setup. If it plays out, Meta is not expected to stop at all-time highs and could potentially reach $1,000 in 2026.
Amazon (AMZN)
Amazon (AMZN): The technical pattern is not as clean; it is described as “holding by the thread.” If the support gives up, the position will be closed. However, it is being held through earnings, as Amazon has a tendency to move higher by at least 10-15% if they beat expectations, a pattern often seen in the last quarter’s earnings. On a yearly basis, Amazon has not expanded much, suggesting it may be a good investment going into the next year once regulatory troubles settle.
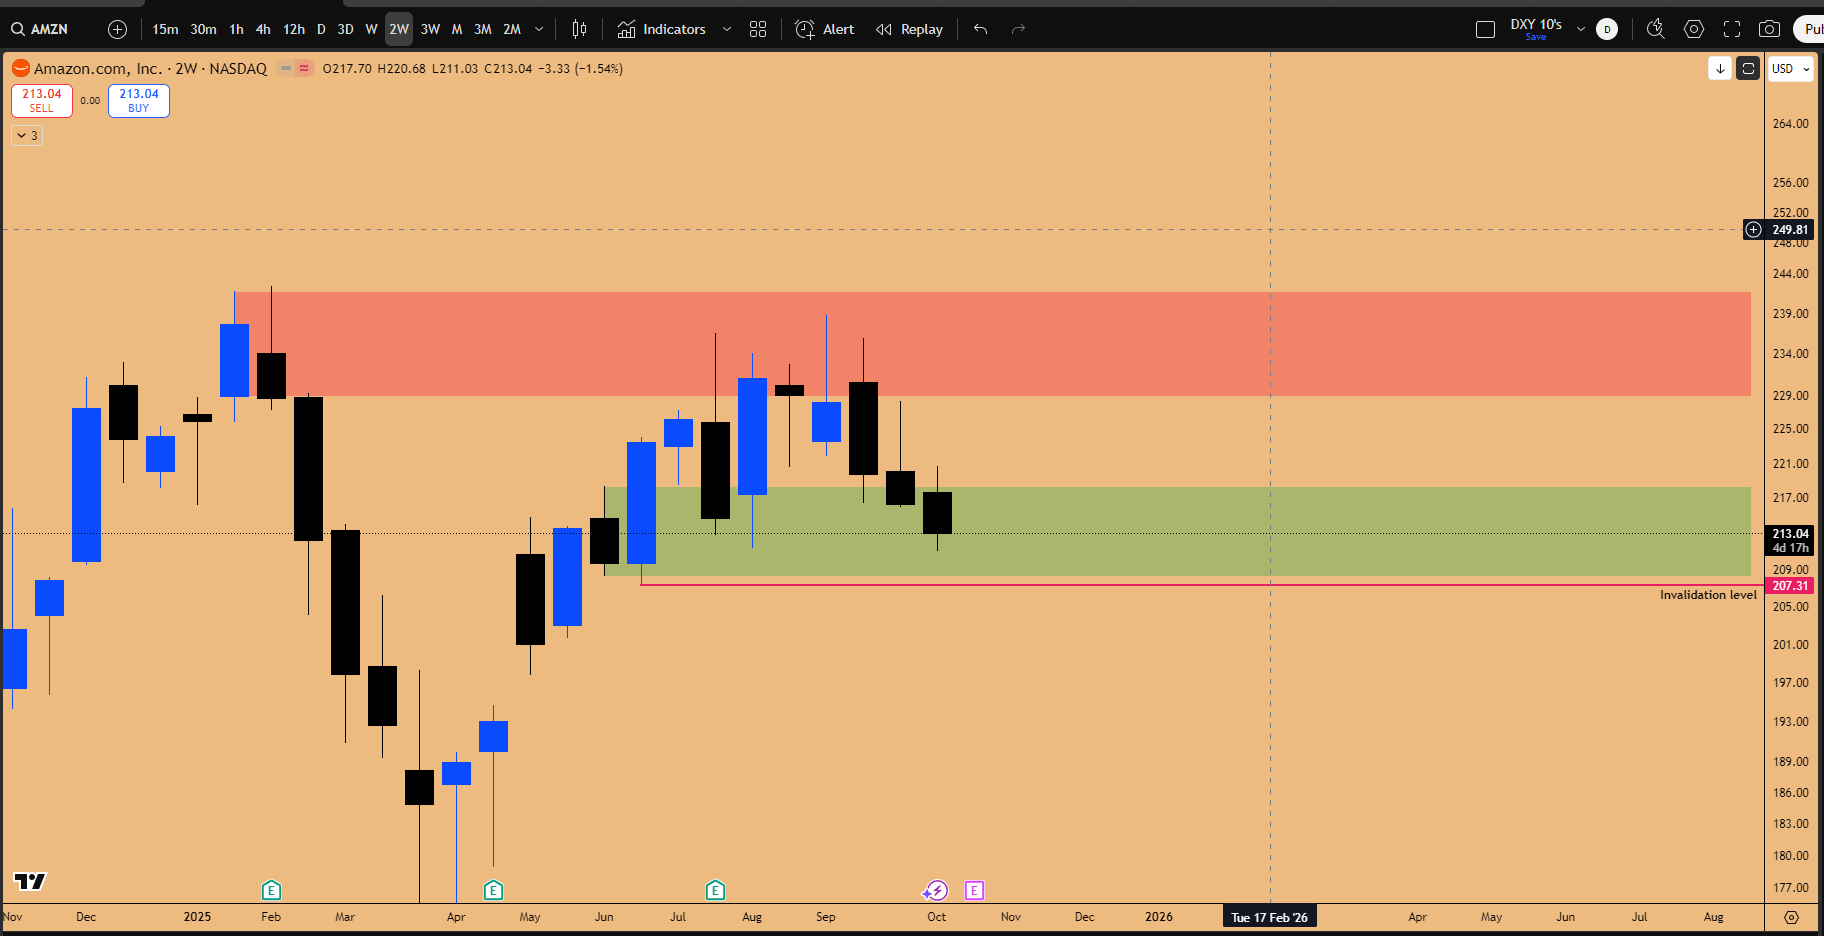
Figure 6: 2-week bullish orderblock support is the line in the sand for higher time frame bullish trend continuation
Tesla (TSLA): November Seasonality and xAI Catalyst
Tesla is poised for a breakout after a sideways month. It presents a strong opportunity for those looking to add new positions.
Seasonality and Technicals:
November is historically one of the strongest months for Tesla, often outperforming the index (as seen in November 2024, 2023, and 2020). An Inside 3-Week Candle is currently in play, and the stock has been going sideways since the quarter opened.
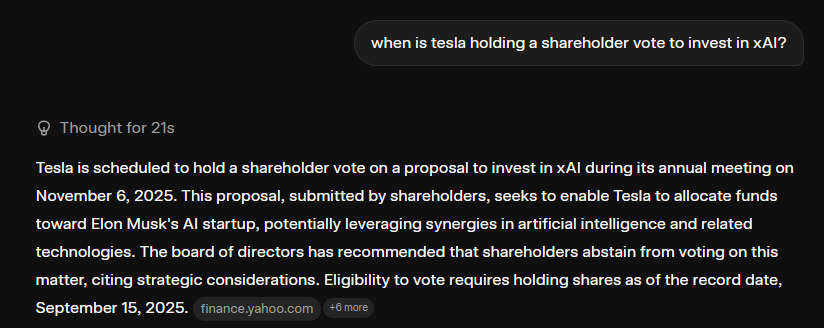
The Catalyst:
While the November 6th shareholder meeting, where Optimus 3 is expected to be revealed, is important, a more significant catalyst is the shareholder vote on whether to invest in xAI. Optimus will not bring significant revenue share for the next five years potentially, but xAI will become an integral part of the Tesla ecosystem and bring instant revenue share. The market reaction to this vote (expected to pass) holds higher precedence than product releases. A macro breakout in Tesla is anticipated to be supreme.
The NASDAQ Outlook: Buybacks, Seasonality, and Key Levels
With several catalyst events lined up to send individual companies higher, the NASDAQ index is inherently poised to rally along with them. The outlook for Q4 is extremely bullish due to a confluence of seasonal, fundamental, and technical factors.
The Pillars of the Q4 Rally
The extremely bullish bias going into the last quarter is supported by several main drivers:
Rate Cuts (Liquidity Source): A 25 basis point rate cut is anticipated when Powell comes out at the end of October.
Stock Buyback Windows: A massive tailwind for risk-on appetite as corporate buyback windows reopen in November.
Earnings (Revenue Acceleration): Expected revenue accelerations across tech companies (Google, Amazon, Meta, Netflix) driven by the AI boom and massive CAPEX spending.
Technical Patterns: Bullish technical patterns are present across major names like Microsoft, Apple, Nvidia, and the QQQ (Nasdaq ETF).
The Power of Corporate Stock Buybacks
The most significant driver for the historically strong performance of the index in November is the reopening of stock buyback window. These windows typically open after the earnings season concludes around the end of October/beginning of November.
This introduces a massive surge of liquidity into the market as big tech companies (Microsoft, Amazon, Apple, etc.) reinvest their profits by buying back their own stock. This creates a significant headwind for equities.
The Apple (AAPL) Example:
Apple is notorious for its massive stock buybacks. The size of their buybacks is equivalent to the GDP of countries in the African continent. “So they can buy back enough money which taken to be the size of an entire country, right? So you do not want to be fighting against that kind of a tailwind.”
The recent breakout in Apple, driven by the Inside Double Inside Monthly Candle pattern, was not catalyzed by the announcement of a $500 billion investment in the US economy. It was catalyzed by the announcement of a $100 billion stock buyback during the last earnings season.
Market Implications:
It often does not matter what kind of earnings they give out. What matters is the stock buyback window and how much stock they actually buy back after reporting. Institutional investors are aware of this phenomenon, leading to a herd mentality where everyone starts piling into stocks, which leads to outperformance in NASDAQ Index in the second half of October and the first half of November.
Historical November Seasonality
This buyback phenomenon explains the strong historical seasonality of November:
Last Year: November was a very strong month.
2022 Bear Market: The ultimate bottom of the entire bear market was printed when the stock buyback windows opened again in November.
November 2021: Part of a massive surge to all-time highs, driven by the stock buyback window.
November 2020 (Presidential Elections): Massive punch higher occurred during this month.
Given this context, the strategy is clear: Be long equities going into late October and November. Do not try to short the market against this massive bullish tailwind.
₿ Cryptocurrency Crossroads: Bitcoin’s Warning Signs vs. Ethereum’s Breakout
The strength in the NASDAQ is expected to affect the cryptocurrency markets, where long positions are held in Ethereum. However, the outlook for Bitcoin is significantly more nuanced and cautionary, presenting a divergence within the crypto space.
Bitcoin (BTC): Topping Patterns and the Inside Monthly Candle Failure
While a counter-trend rally is expected in Bitcoin due to the NASDAQ’s anticipated rise, the long-term swing outlook for BTC has shifted. The strategy is to treat Bitcoin’s counter trend rally as a day trade, targeting $120K, rather than a swing trade to new all-time highs. The larger timeframe support zone around $108K has been tested too many times (three tests), indicating weak support.
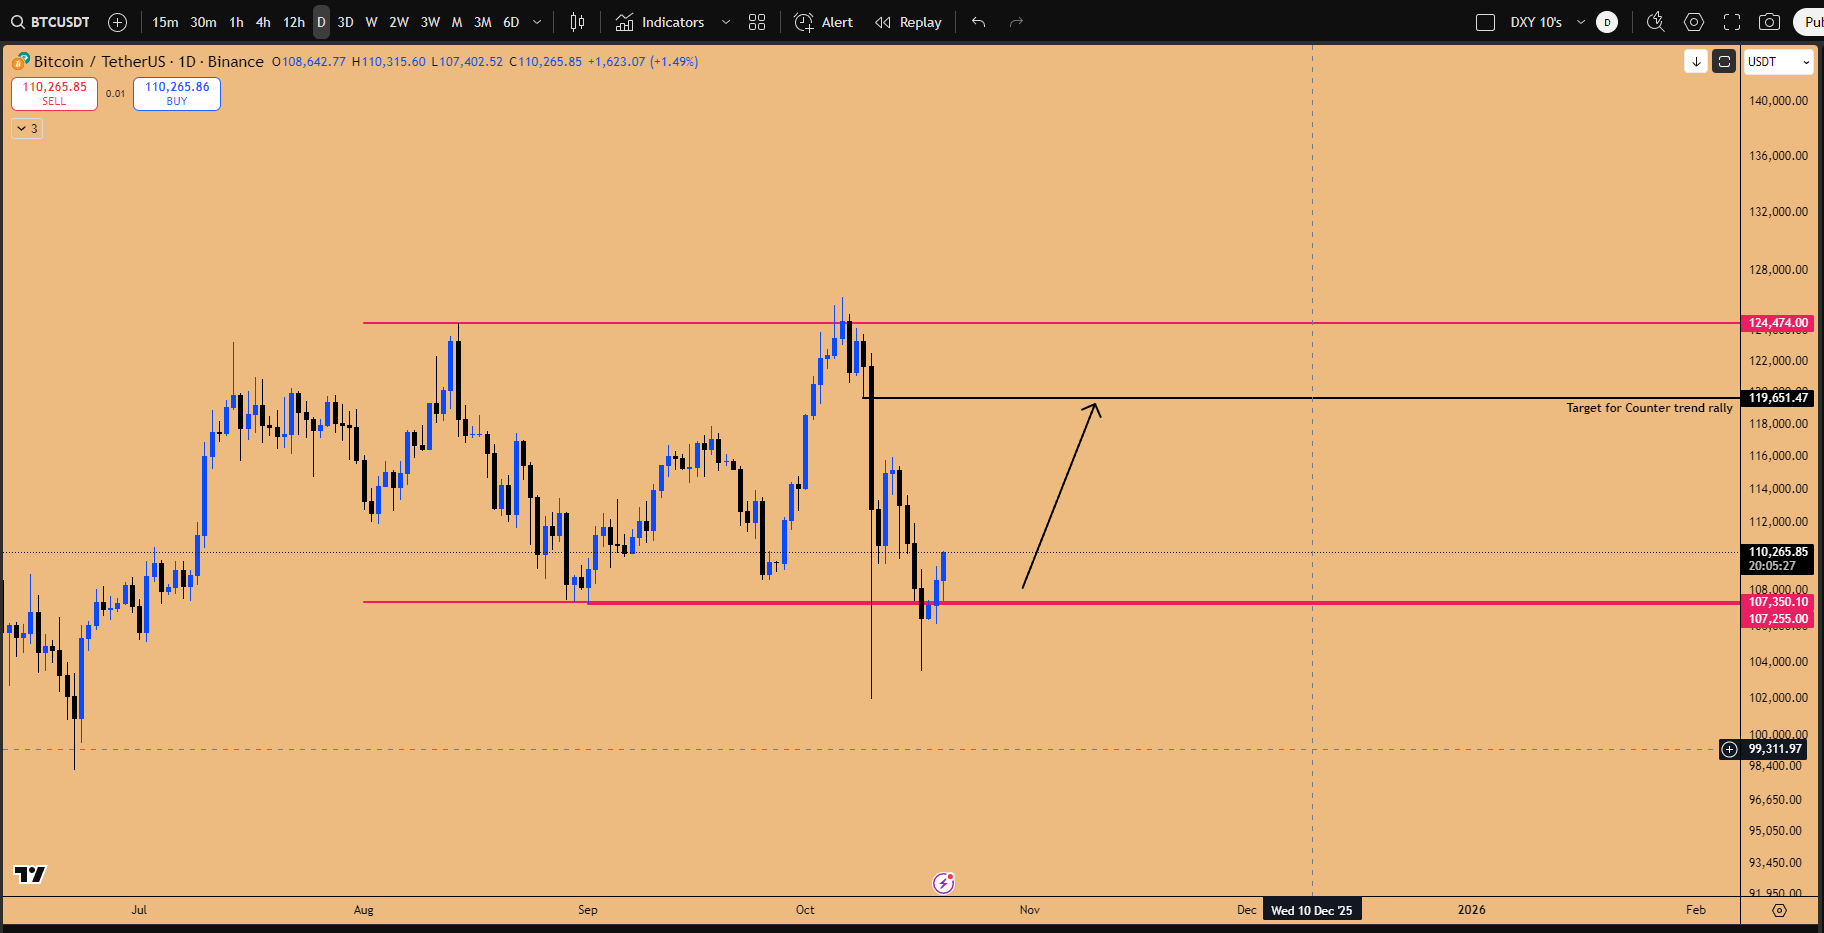
Figure 7: Counter trend rally long setup in play for BTCUSD, targeting 120k
Technical Warning Signs:
New developments on the monthly chart (using Coinbase data) indicate significant warning signs.
Violation of Higher Lows: The pattern of consistent higher lows since the bottom has been violated.
IBIT ETF Gap: A massive gap remains open on the monthly chart of the IBIT ETF, which was a reason for unwillingness to open long positions while BTC was pushing higher.
Inside Monthly Candle Failure (Topping Pattern): After taking out the all-time highs, Bitcoin rejected, broke market structure by taking out recent lows, and is now creating an Inside Monthly Candle Failure. This is identified as a topping pattern formation.
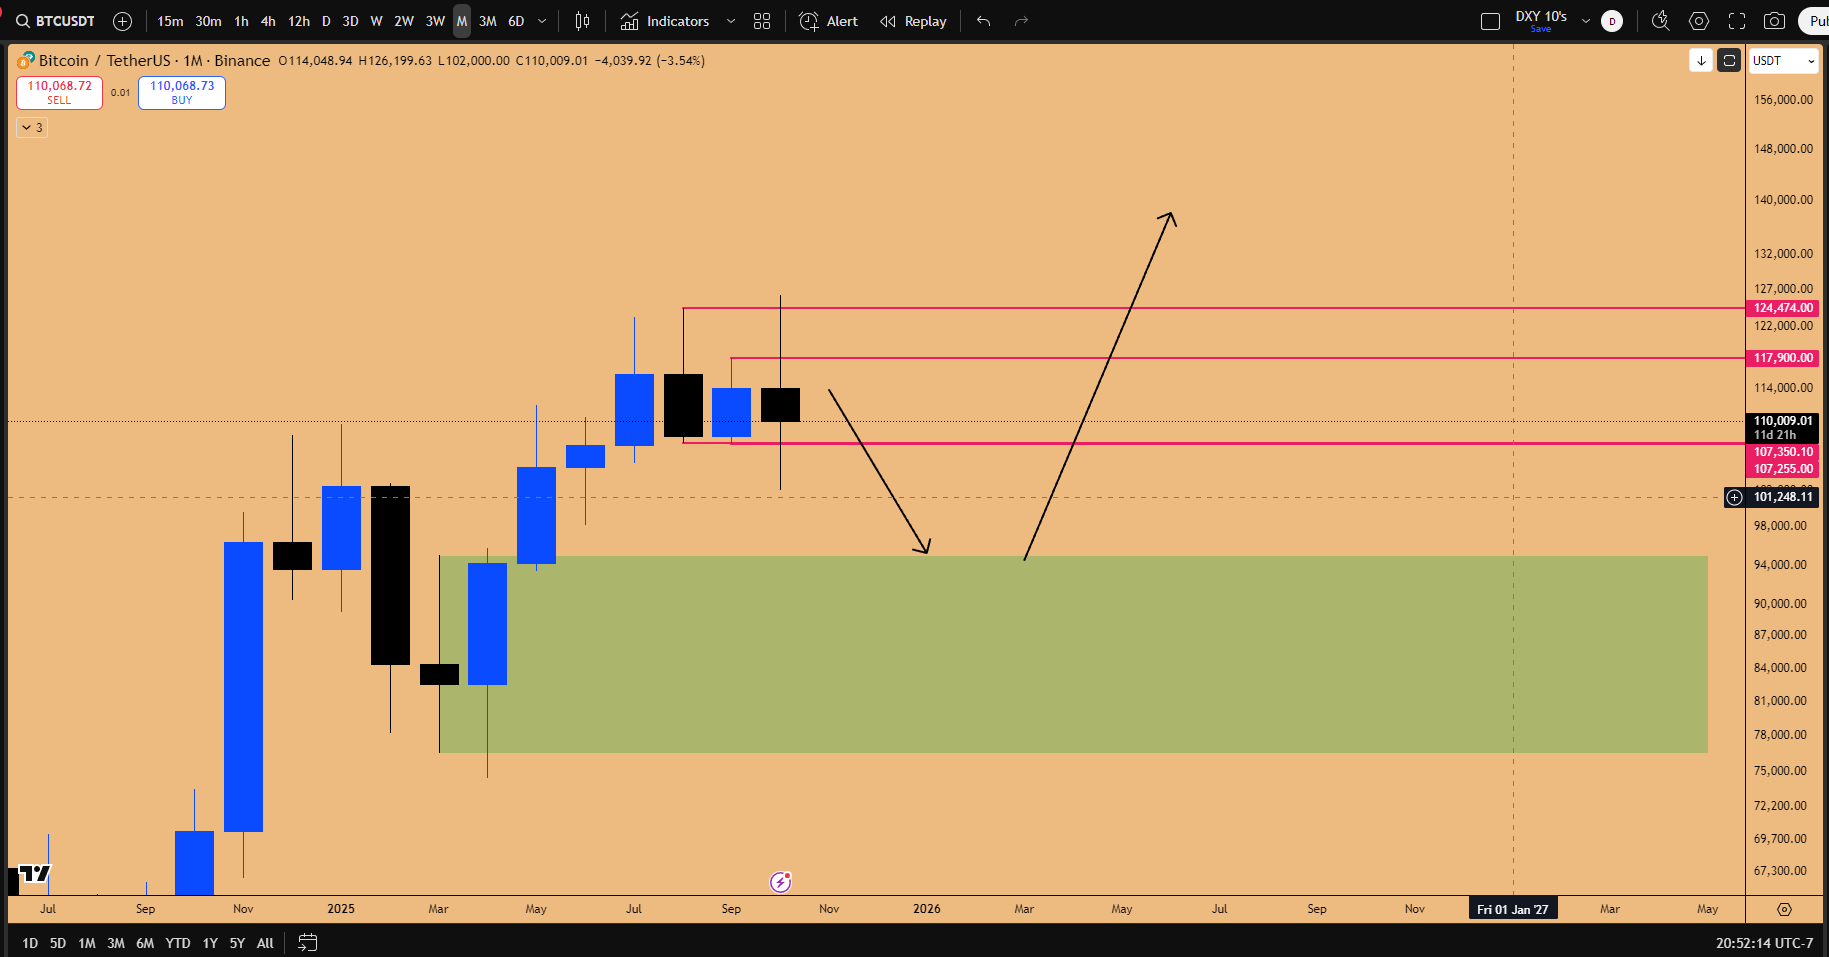
Figure 8: Inside Monthly Candle Failure in play for BTC, suggesting deeper pullback to support zone, while maintaining core Monthly Uptrend.
This presents a conundrum: Bitcoin’s technicals suggest caution, while the NASDAQ (the main driver for risk appetite) is poised to go higher.
Historical Precedents:
Similar topping patterns have emerged in the past:
An Inside Two-Week Candle Failure led to a massive, 6-month consolidation zone before the bull run resumed, even while NASDAQ performed well.
Another Inside Two-Week Candle Failure marked a top followed by a lower high and a massive flush.
The top that preceded the 2022 bear market (lasting a year and a half) was also signaled by an Inside Two-Week Candle Failure.
While a bear market is not anticipated, these patterns demand caution. The current structure suggests that the bounce from the weekly support zone will likely create a lower high (~120k S/R). The strategy involves taking a low-risk long for the counter-trend rally, but considering a low-risk short position once the rally completes, anticipating a potential pullback in NASDAQ around mid-November after earnings season concludes.
The MicroStrategy (MSTR) Anchor and Correlation
A major reason for Bitcoin’s pullback is the performance of MicroStrategy (MSTR), a levered form of Bitcoin. There is a massive divestment happening in MSTR as institutions realize they do not need to own MSTR at an inflated price; they can gain direct exposure through the IBIT ETF.
MSTR is displaying an Inside Quarterly Candle Failure, signaling a move toward $231. Historically, MSTR has acted as a bellwether, often leading Bitcoin.
October 2024: MSTR printed a new all-time high while BTC lagged; BTC subsequently caught up and broke out (leading to the hyper-bullish stance during the Nov 2024 elections).
November/December 2024: MSTR topped out first on Nov 18th; BTC topped out one month later on Dec 16th. MSTR signaled the pathway to the downside first.
Currently, MSTR printed a lower high while BTC printed a higher high. While this initially suggested a decoupling, applying the correlation in reverse suggests MSTR’s decline will likely lead Bitcoin down with a lag (20-30 days).
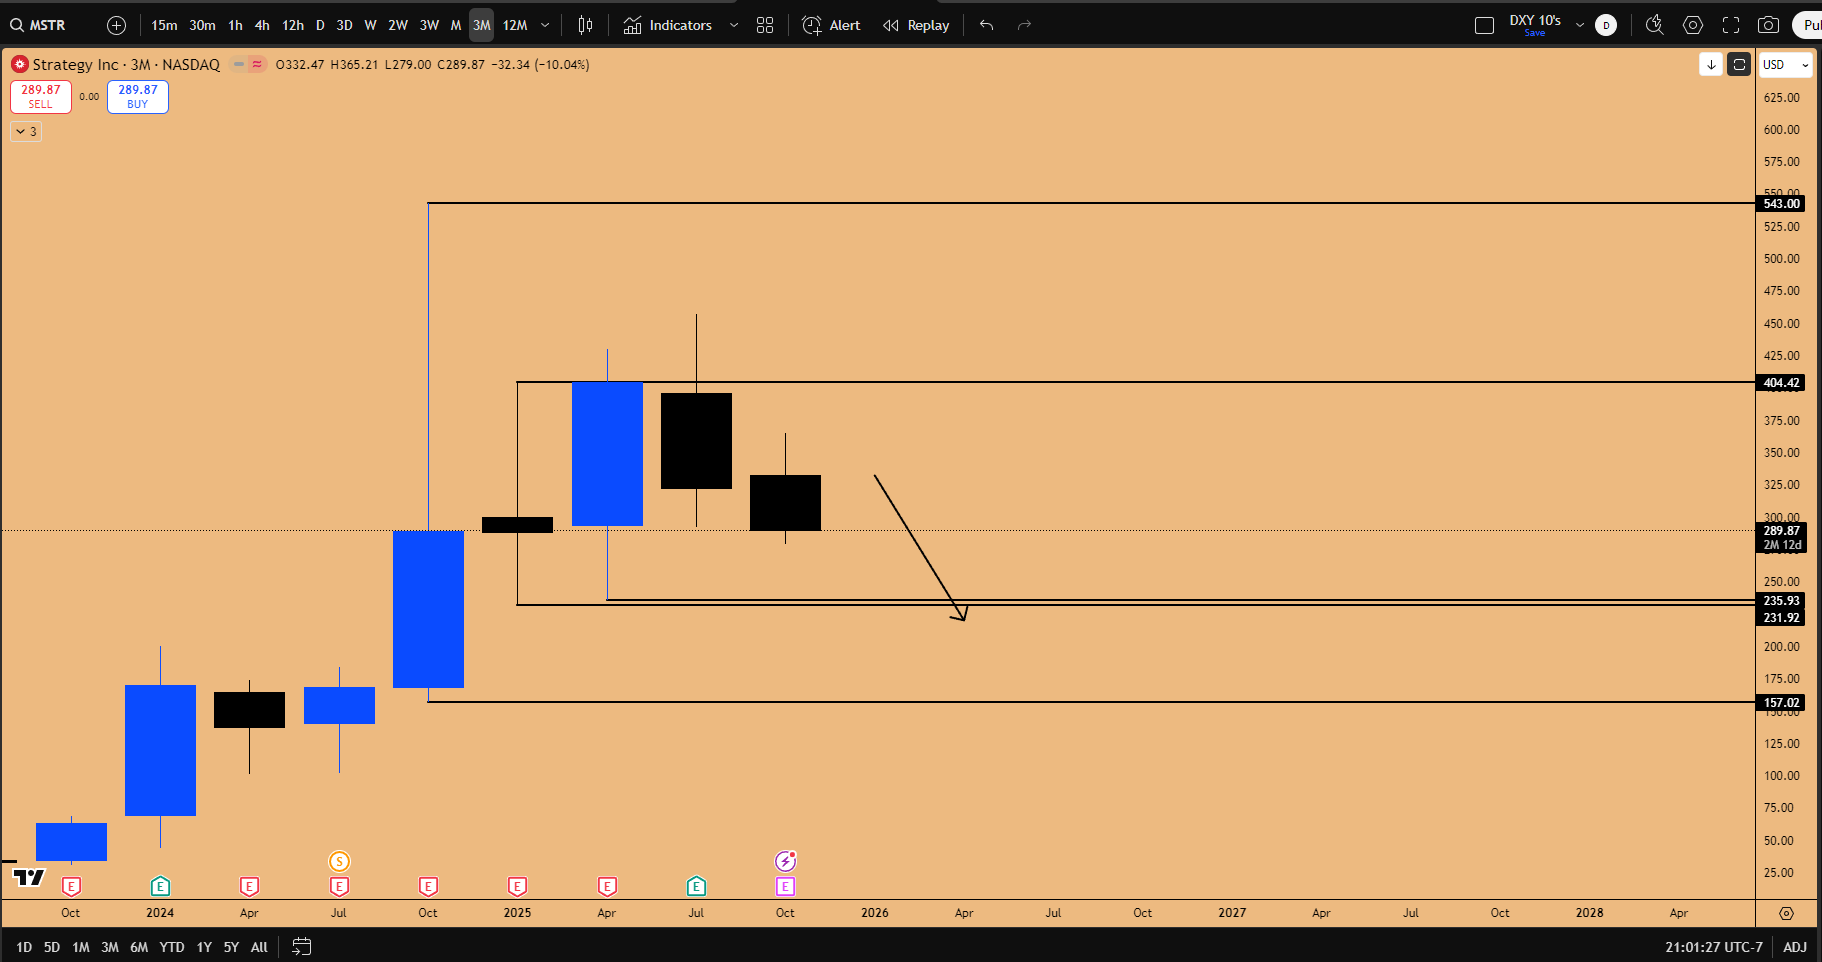
Figure 9: Inside 3-Month candle failure pattern in play, targeting 231$ swing low
The IBIT ETF and the Path to Independence
For Bitcoin to become a free-floating asset, similar to the Gold ETF (the main source of institutional liquidity since 2005) or the NASDAQ index itself, it must decouple from MSTR. The IBIT ETF needs to become the independent benchmark. “MicroStrategy has to just go off the map. It cannot be allowed to exist anymore.” Regulatory frameworks in the US (Clarity Act and The Genius Act Crypto bills introduced with the help of David Sachs) are helping institutions use IBIT directly, reducing the reliance on MSTR.
🚀 The Generational Buying Opportunity in Bitcoin
The anticipated pullback is not expected to be a major correction (e.g., 20-50%). It is viewed as a shallow pullback within a healthy long-term uptrend (maintaining higher highs and higher lows since the 2022 low). This pullback is necessary to gather energy for the next rally, potentially extending to 300K or 400K, eventually targeting a million dollars.
If Bitcoin revisits the higher timeframe support zone, it would be an opportunity to “load the truck” for a long-term spot position.
The Target Support Zone:
The key support zone aligns across multiple timeframes: Monthly, Weekly, and Quarterly (a proper quarterly bullish engulfing candle).
IBIT Target Support zone to buy: $50
Bitcoin Target Support Zone to buy: $90K
This zone also aligns with inefficiencies that need filling:
An open gap on the IBIT ETF chart.
A “flat open” (no wick) on the futures chart monthly candle—an inefficiency that often gets revisited.
Short-Term Strategy:
Focus on the counter trend rally which is about to be kickstarted with Nasdaq Tech earnings driving potential acceleration going into October End. The short term target on Bitcoin’s counter trend rally is 120,000$, which essentially captures 10% return from current levels.
Ethereum (ETH): Outperformance and Imminent Breakout
In stark contrast to Bitcoin, Ethereum presents a very special, bullish pattern setup and is expected to outperform significantly during the anticipated counter-trend bounce.
The Bullish Patterns:
Ethereum is displaying overlapping bullish patterns:
Inside Monthly Candle Failure
Inside 3-Week Candle Failure
If Bitcoin stages a counter-trend rally to $120K (a 10% move from $108K), Ethereum is expected to break out, go berserk, and potentially make a new all-time high, likely reaching $5,000. ETH/BTC is also expected to perform well.
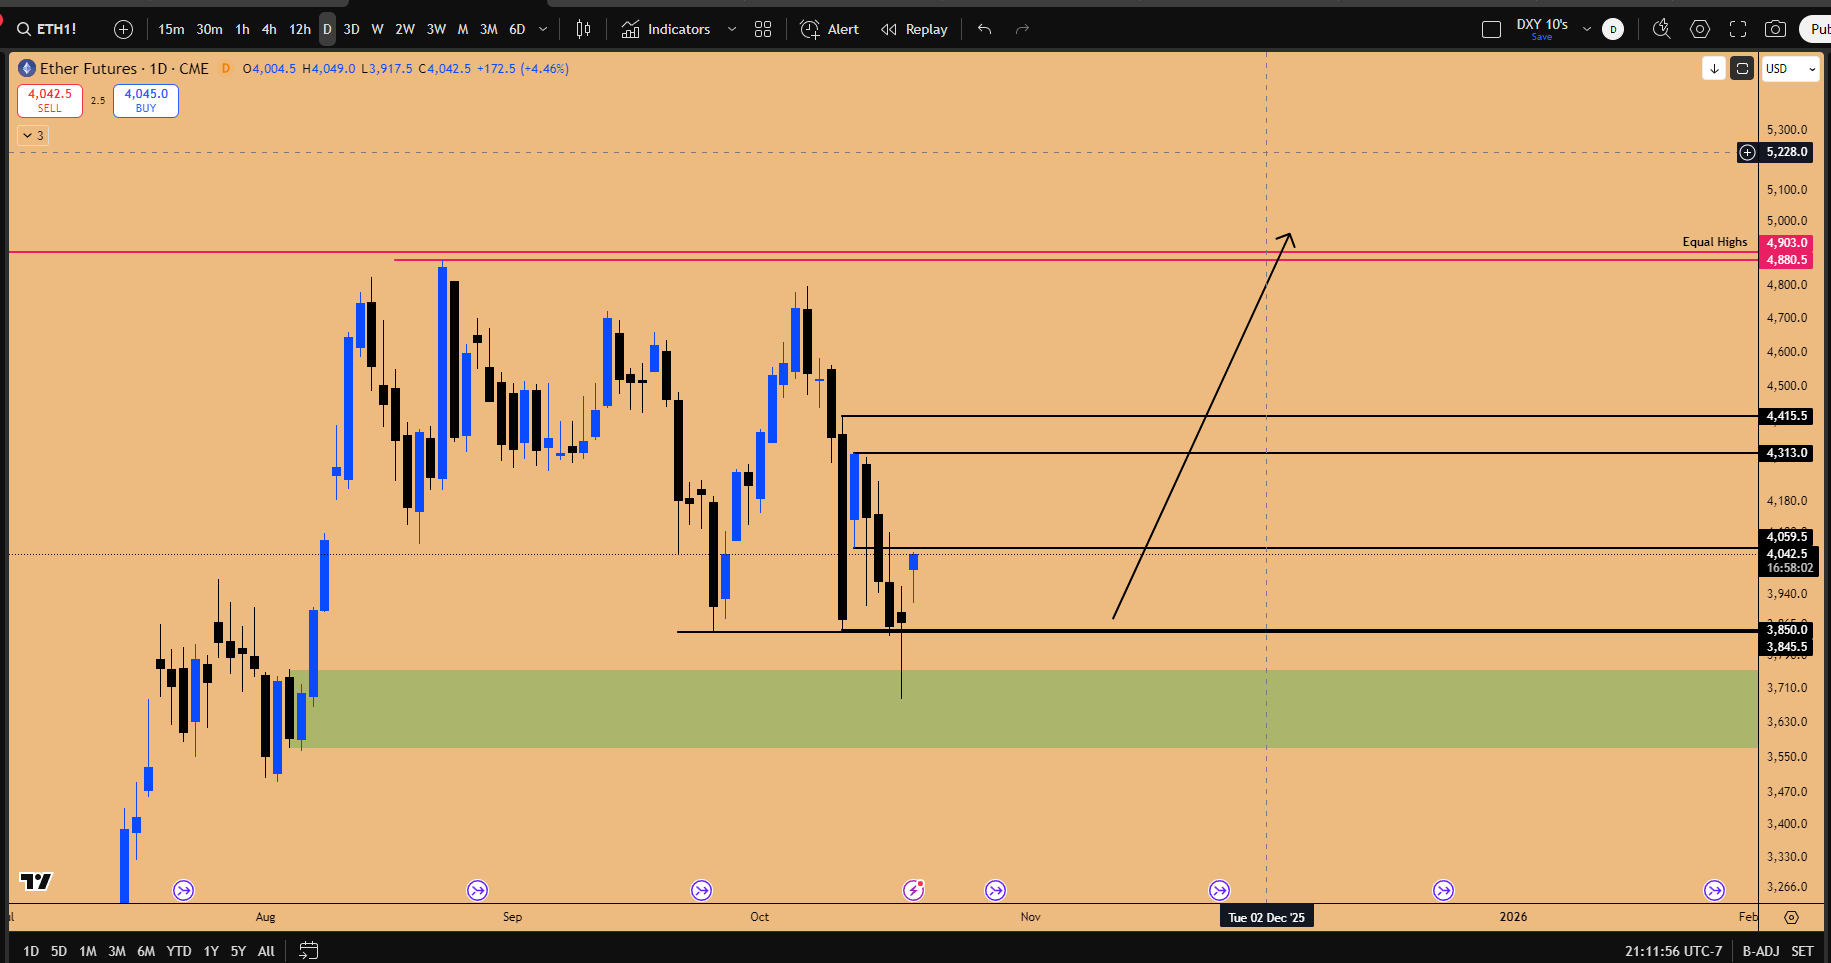
Figure 10: Inside Daily Candle failure triggering Long’s at Weekly Support zone ~3850$
The Weekly Trigger:
An Inside Weekly Candle is currently in formation. The coming week is crucial: the weekly candle needs to break out and close above $4127. This will confirm the Inside 3-Week Candle failure (as the 3-week candle closes in 7 days) and maintain the long triggers.
Reasons for Outperformance (CME Futures):
CME Futures Lag: The all-time highs were not actually printed on the CME futures chart. The recent pullback is a retest of a key support zone. (Futures being closed over the weekend also means they avoided the massive spike down seen on spot).
Daily Trigger: The market is testing and rejecting a daily support zone. An Inside Daily Candle Failure is in play, confirmed by a Daily SFP (Swing Failure Pattern) close on Friday. This has already triggered a long signal.
Strategy:
Ethereum offers a better “bang for the buck” than Bitcoin for long positions. The strategy is to be long risk-on appetite this week. Once Bitcoin hits $120K, the plan is to go hands-off and move to zero risk exposure to crypto altogether, adopting a “better safe than sorry” approach while monitoring NASDAQ.
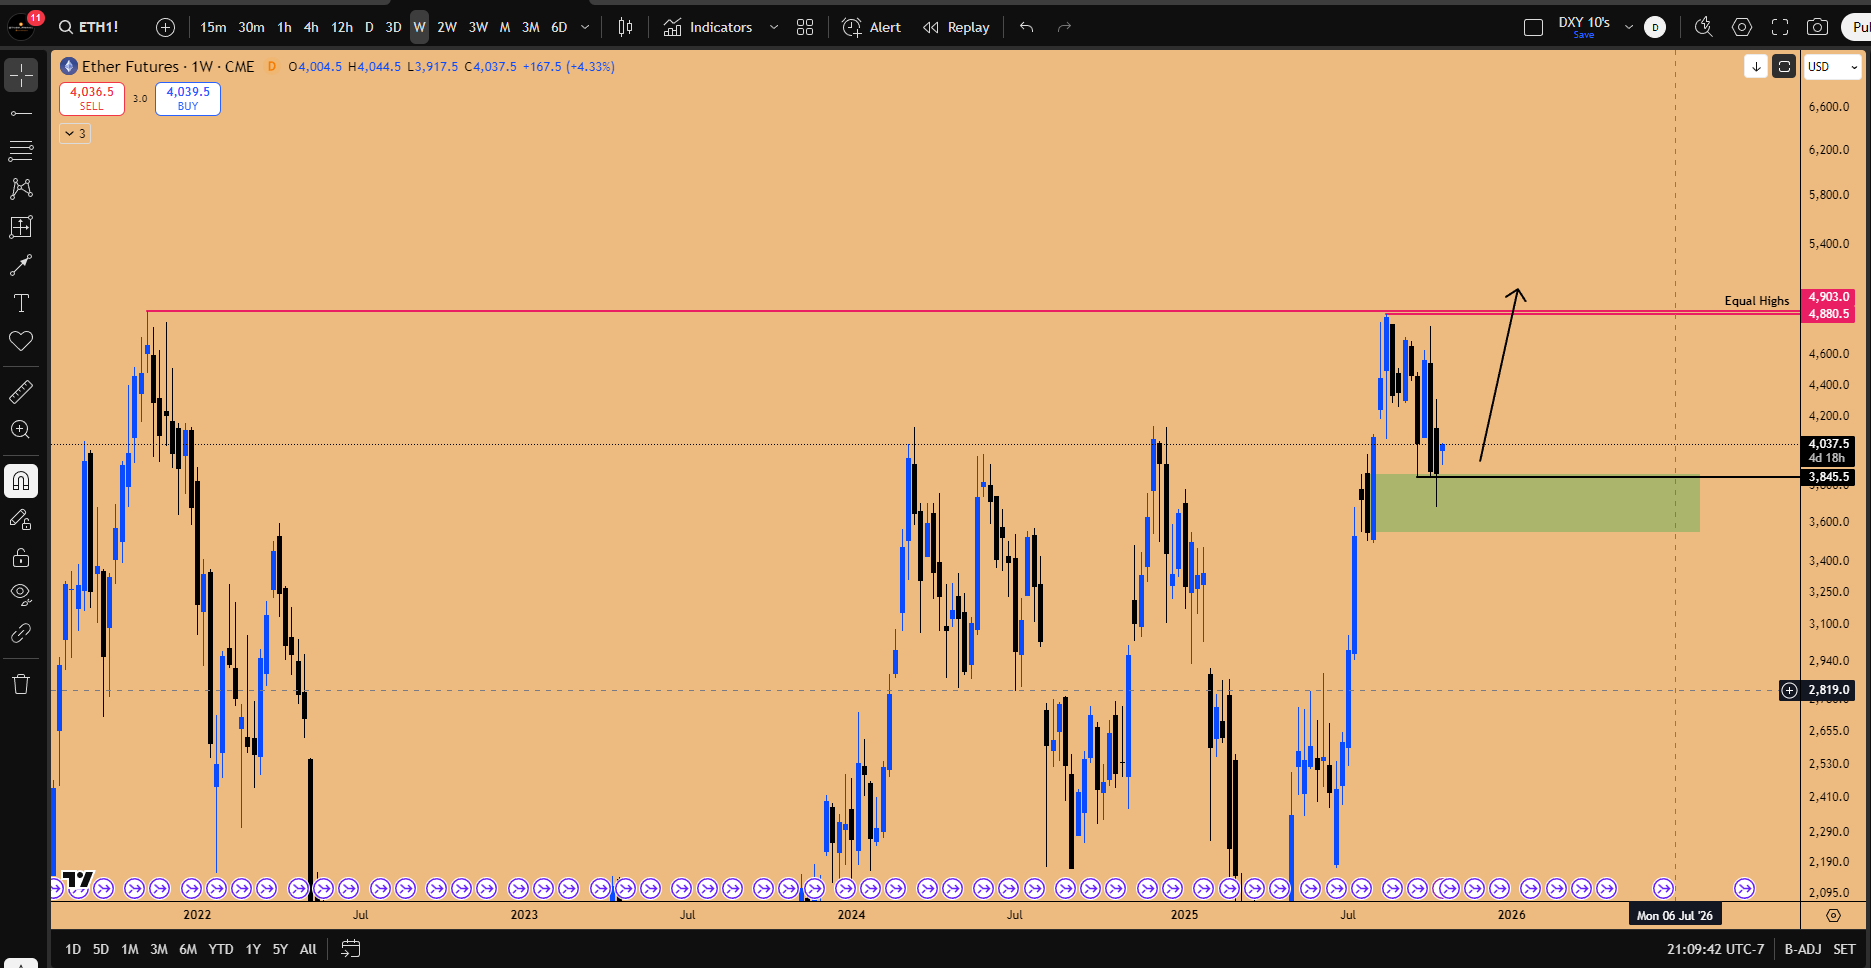
Figure 11: Weekly Bullish Orderblock must defend, Equal highs at All Time Highs are the target.
Solana (SOL): A Potential Short Candidate
Solana (SOL) presents an annoying price action, having taken out the previous month’s low and forming a bearish order block. Its structure mirrors Bitcoin’s weakness.
If Bitcoin bounces to $120K, SOL is expected to rally to the $216 resistance level. While this bounce is tradable, Ethereum is preferred for long exposure.
However, SOL is identified as a potentially better short candidate than Bitcoin if the market turns down. This is due to a clear market structure break and relative weakness.
Divergence/Relative Weakness: When Bitcoin went berserk and made a higher high, SOL made a lower high in comparison to its previous peak.
Structure Shift: SOL has now broken below a key low, making a lower low.
This structure (High -> Low -> Lower High -> Lower Low) provides an incentive to expect that any bounce will form another lower high, setting up a short opportunity. A short position would be entertained if SOL reaches the $220 area during the counter-trend rally.
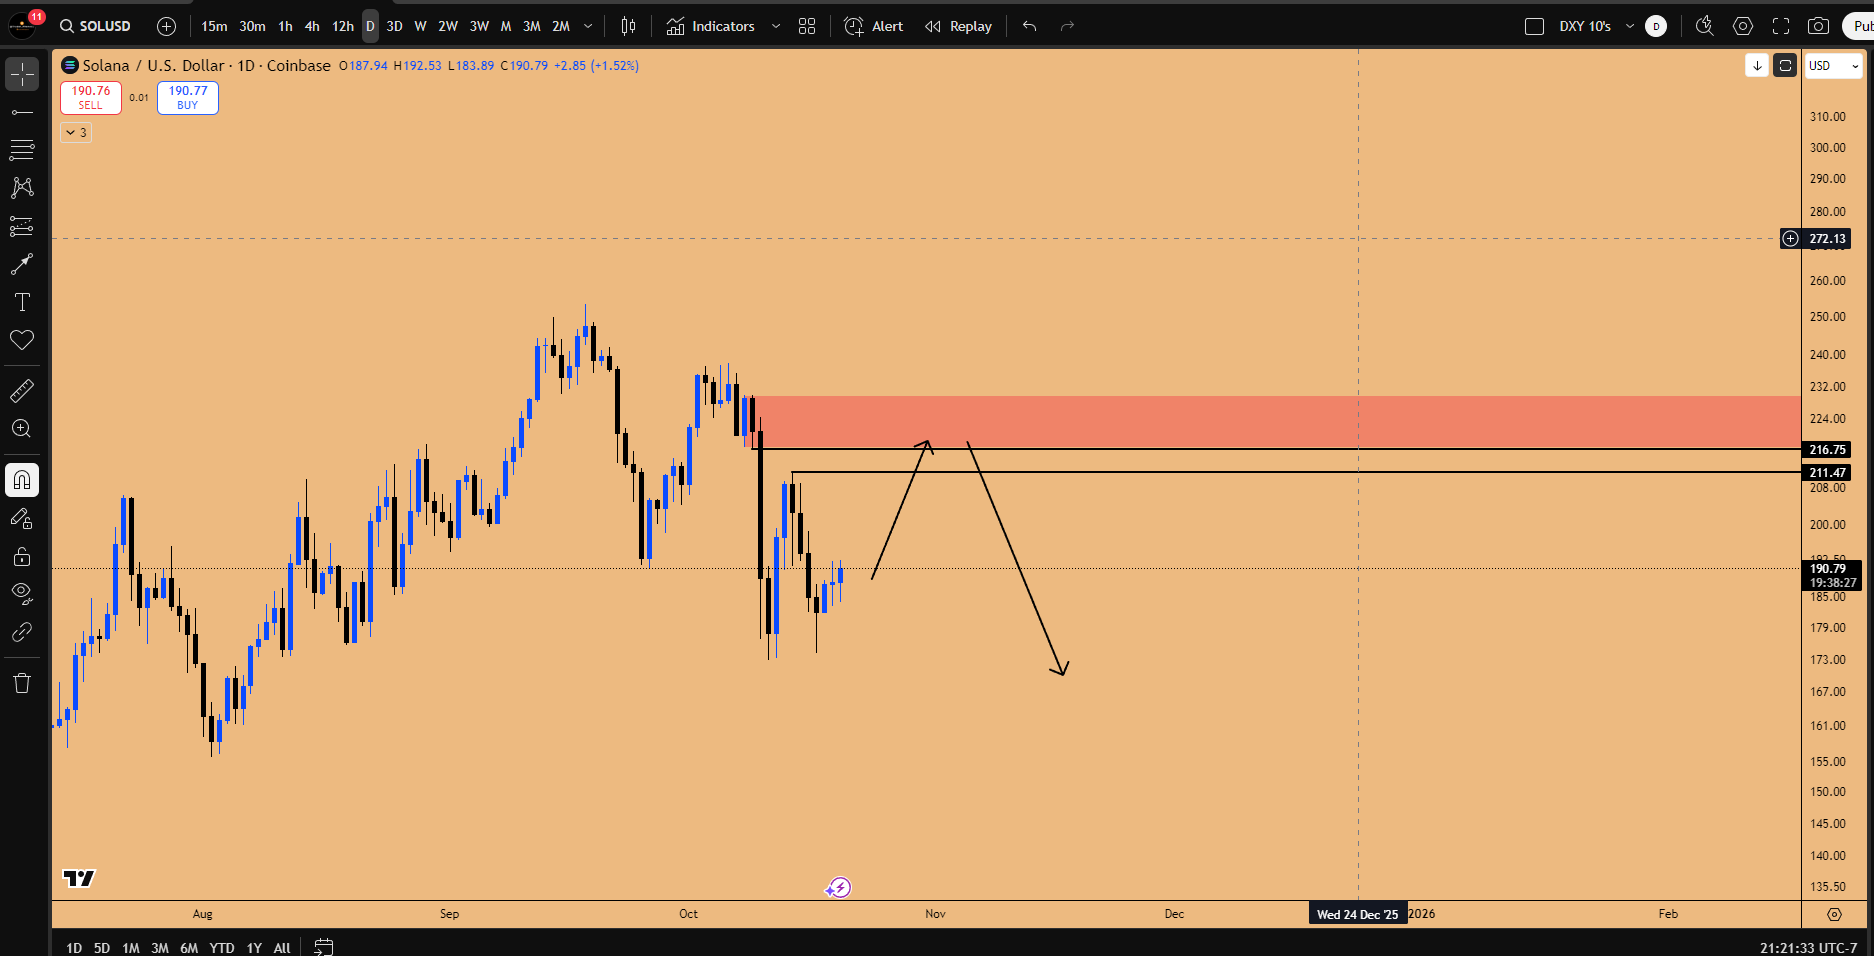
Figure 12: Key Resistance zone on SOLUSD for counter trend bounce to be capped
🎯 Portfolio Positioning and Other Equities
The current portfolio is heavyweight in equities, focusing on capturing the Q4 movements. Positions are held in Netflix, Meta, Amazon, and Microsoft (the heaviest position).
Key Takeaways and Outlook
As we navigate a pivotal earnings season, the market dynamics strongly favor a risk-on environment for equities in Q4 2025. The recent VIX spike (46% to 28), driven by institutional repositioning, appears to have set the quarterly lows for the NASDAQ and S&P 500, confirmed by the decisive reclamation of the quarterly open (24,617). Massive tailwinds are converging: anticipated rate cuts in October, the crucial reopening of corporate stock buyback windows in November providing a liquidity surge (exemplified by Apple’s $120B buyback), and continued revenue acceleration driven by the AI boom.
High-conviction setups are identified in tech leaders. Netflix, with its Inside Two-Month Candle Failure and strong October earnings history, is expected to lead the charge. Microsoft remains a core holding, targeting $555 based on Inside 3-Week and Monthly failures and its 15-18% average Q4 return. Meta offers a compelling 4.54 RR setup at trendline support, and Tesla is poised for a strong November driven by seasonality and the XAI vote catalyst.
The cryptocurrency market requires a divergent strategy. Ethereum is the preferred long, poised for a breakout to $5,000 based on strong technical failures and lagging CME futures. Conversely, Bitcoin is flashing major warning signs with an Inside Monthly Candle Failure (topping pattern) and headwinds from the institutional rotation out of MicroStrategy (targeting $231) into the IBIT ETF. The strategy is to ride the short-term crypto bounce until Bitcoin reaches $120K and then move to zero exposure, awaiting a potential “generational buying opportunity” near the $90K support zone.
As we head deeper into earnings reports and approach the November liquidity surge, maintaining long exposure to equities while employing a nuanced approach to crypto appears to be the optimal strategy. During our next 20th livestream we will explore QRA dynamics and pre-Santa rally, make sure join us here Livestream.
What’s your take on these setups? Are you prioritizing tech stocks or capitalizing on the Ethereum divergence? Share in the comments let’s discuss strategies. Subscribe for more market breakdowns!
Disclaimer: This isn’t financial advice – just market musings from the charts. Always do your own research.
If you enjoyed this deep dive, please share it with fellow traders!