



Executive Summary
Just in case you have been living under a rock for the past 2 weeks, Global financial markets have been under significant turmoil as a result of Asian Indices taking the Plunge.
Korean Kospi Index suffered it’s largest collapse in history, plunging -40% this month, currently undergoing a sharp rebound on the day.
US Tech Sector got dragged down to the woodshed as a result of Memory Stocks (Ticker: DRAM) and Chip Sector (Ticker : SMH) getting blown out of the water
NASDAQ had been in a free-fall stage as a result of concentration risk from DRAM and SMH companies in the Index. We had been mostly out of the asset class ever since our long position was stopped. I personally wanted to wait, observe the market structure and let the market turn around before taking another long opportunity. This is where timing is everything, this week we had a cluster chaos with FOMC meeting and Big tech companies (MSFT, AAPL, AMZN, META) reporting their earnings. This timing cluster around the FOMC meeting has now produced the first reversal structure I have witnessed which is looking to cause a VIOLENT SHORT SQUEEZE
Immediate setup: When the market drops hard during an FOMC event, the final five minutes of the trading day can offer an aggressive counter trend long entry, with the daily open and London open providing the next two opportunities. Given that FOMC events have a reputation of reversing their moves the next day, this technique generally renders a safe bet on capturing the reversal before it happens
Higher-timeframe confirmation: Nikkei needs to close back above its inside-weekly lows (64,127) and confirm that the breakdown failed. The S&P 500 has already taken the downside liquidity on its inside three-week candle structure and printed a daily SFP. This Daily SFP is now causing a VIOLENT SHORT SQUEEZE rally to pursue. A daily close back above roughly 7,400 would confirm the weekly SFP and the multi-week failure pattern would be trigger a broader risk-on rally trigger.
Preferred expression: My preferred way to express long exposure to ride this short squeeze rally is through AMAZON LONGS. I am opening a starter position with 5% portfolio risk in the March 19, 2027 $300 calls. If earnings produce a 5% or 10% drop, I am prepared to add another 5% risk. I closed my Apple long after it produced roughly three times the return on the original position, and I am recycling that capital into Amazon because Apple’s quarterly move has already expanded while Amazon’s has not.
Active exposure: Google remains an active long position that I expect to hold all the way through to December. I am also holding the second half of my BTC spot position. BTC is in a bottoming process, and I remain bullish, but the expansion has not started and I do not know exactly when it will. Except for the fact that I want to keep full exposure behind BTCUSD between 65k-70k levels.
The thesis still needs confirmation. Apple and Amazon earnings must not collapse the indices, Nikkei must close the inside-weekly failure and produce follow-through, and the S&P 500 must hold the reclaimed multi-week lows. If Amazon knocks it out of the park, we will likely be facing a rip roaring rally to finish the month and the week on a high note in Global Indices.
Market-wide invalidation: The current FOMC daily low is the market-wide invalidation I am using.
The FOMC Reversal Has Reopened the Long Side
NASDAQ had been in a free-fall stage, and I had been mostly out of the asset class ever since my long position was stopped. The low that was taken out was my stop loss. Once it gave way, I was out of the long position and waiting for the market to turn around before I considered another opportunity.
My thinking was that a significant number of stops would be triggered after that low gave out. The market moved into full free-fall mode, but it was also entering a daily support zone where I expected it to defend itself. That defense arrived during the FOMC meeting.
Why the Last Five Minutes Matter
This is what the market looked like going into the FOMC meeting: it had already reached the daily support zone we mapped out, and the hourly price action was dropping into the New York session. Rates were left unchanged. The market had talked itself into expecting a hike, but I did not believe that premise made sense given the political alignment and pressure around keeping rates lower.
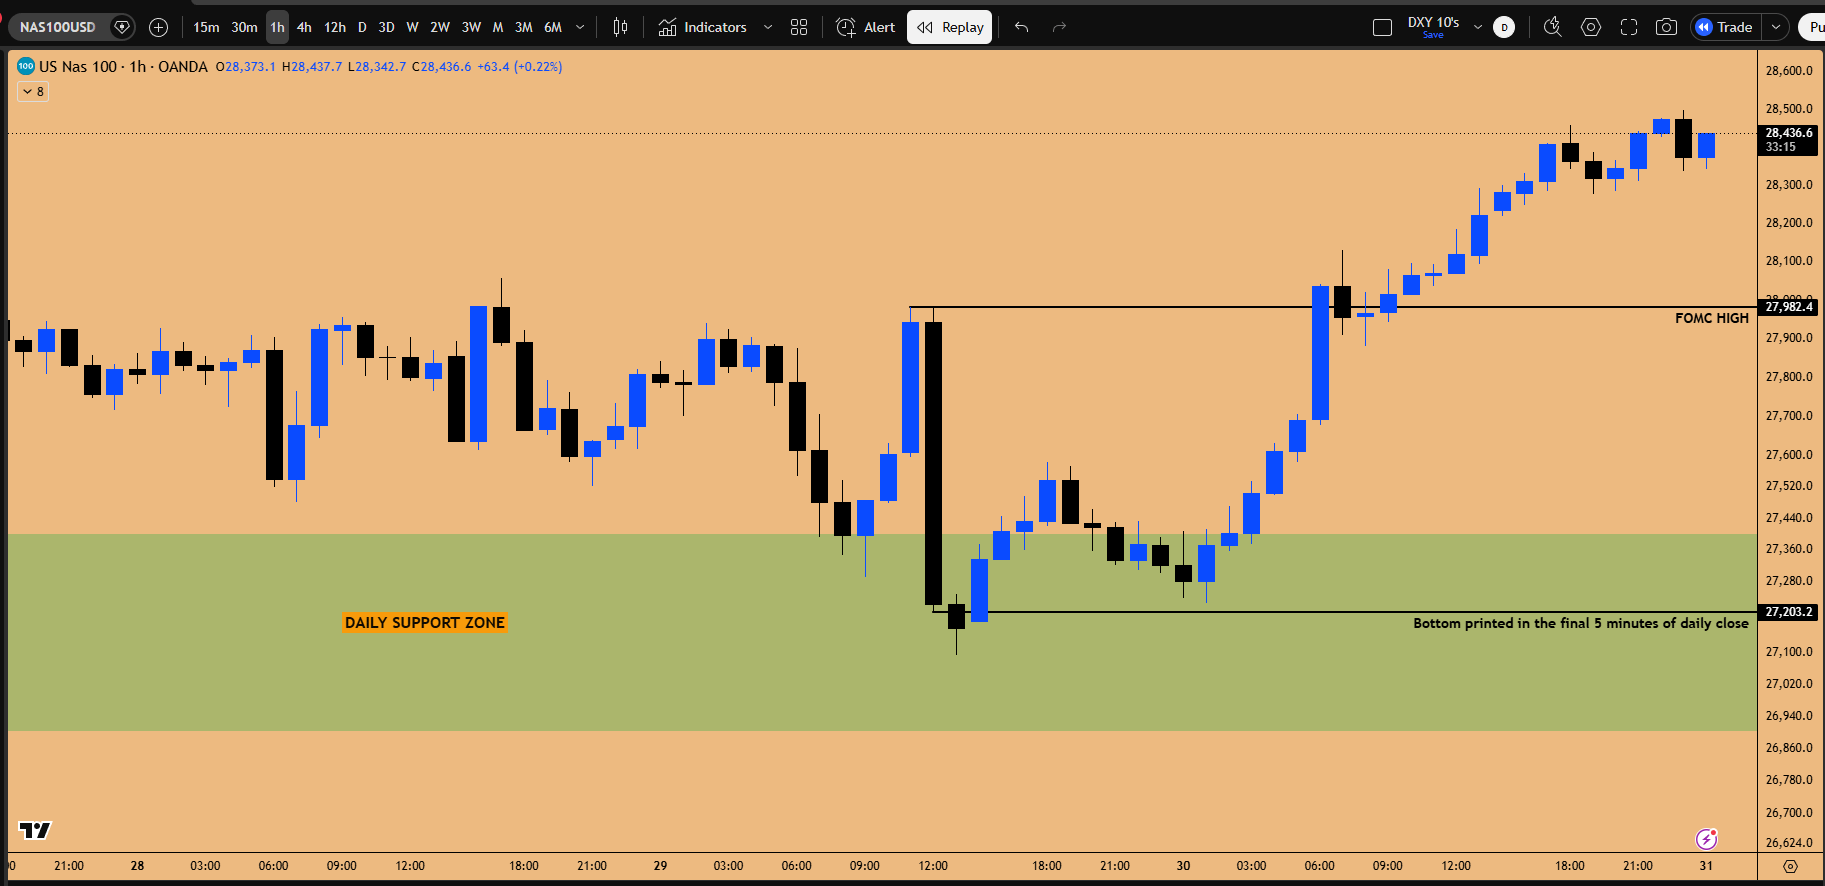
Figure 1: Initial bullish reaction → Bearish spike down in final hour → Bottomed in the final 5 minutes of Daily Candle Close
The unchanged decision produced the initial reaction, but that is not generally how an FOMC reversal completes. If the market is going to turn around the next day, I actually want to see a massive drop during the event. I want the fear to come into the market because that is when everybody and their emotions are screaming to go short.
The reversal sequence creates three distinct opportunities:
Final five minutes: When that drop happened, I was thinking about going long into the last five minutes. I have seen this many times: if the market sells off in the final hour of the FOMC event and you buy the position in the last five minutes, chances are the position reverses over the next 24 hours and targets the upside liquidity created during the meeting. The stop belongs below the daily support zone.
Daily open: The daily open is the next cue. When the FOMC day closes down and the new daily candle opens, the algorithm can switch. The market often does not revisit the event low. It begins moving toward the upside liquidity pool instead, usually wanting to target FOMC high’s without giving up the daily open level.
London open: London open can then provide the second entry. In this case, the overnight move retraced into London, printed the intraday bottom and formed a swing low. That gives you the opportunity to move the stop from the FOMC event low to the new intraday low. New York session then reverses the FOMC move and attacks the absolute high created during the meeting.
The Lower-High Break Is the Structural Turn
The FOMC lower high matters because it is a key lower high. If the market is still bearish, there is no reason for it to trade above the high created during the meeting. If it clears that level, it is telling you the market no longer wants to remain bearish.
The drop into the event created a proper bearish order block on the hourly time frame. If the market were bearish, it should have respected that resistance zone on the bounce. Instead, it squeezed above it and removed the nearest lower high, flipping the market structure back to bullish in the process.
That high qualified as a lower high because market continued to drop and made a new low. This is the sequence the market had followed throughout the decline: each swing high produced another lower low. I stayed on the sidelines while those lower highs and lower lows remained intact.
Now the sequence is changing. The market has taken out the lower high and made a higher high. At some point, it should come back down and test the broken resistance as support. If that test forms a higher low, the structure begins to shift from lower highs and lower lows into higher highs and higher lows.
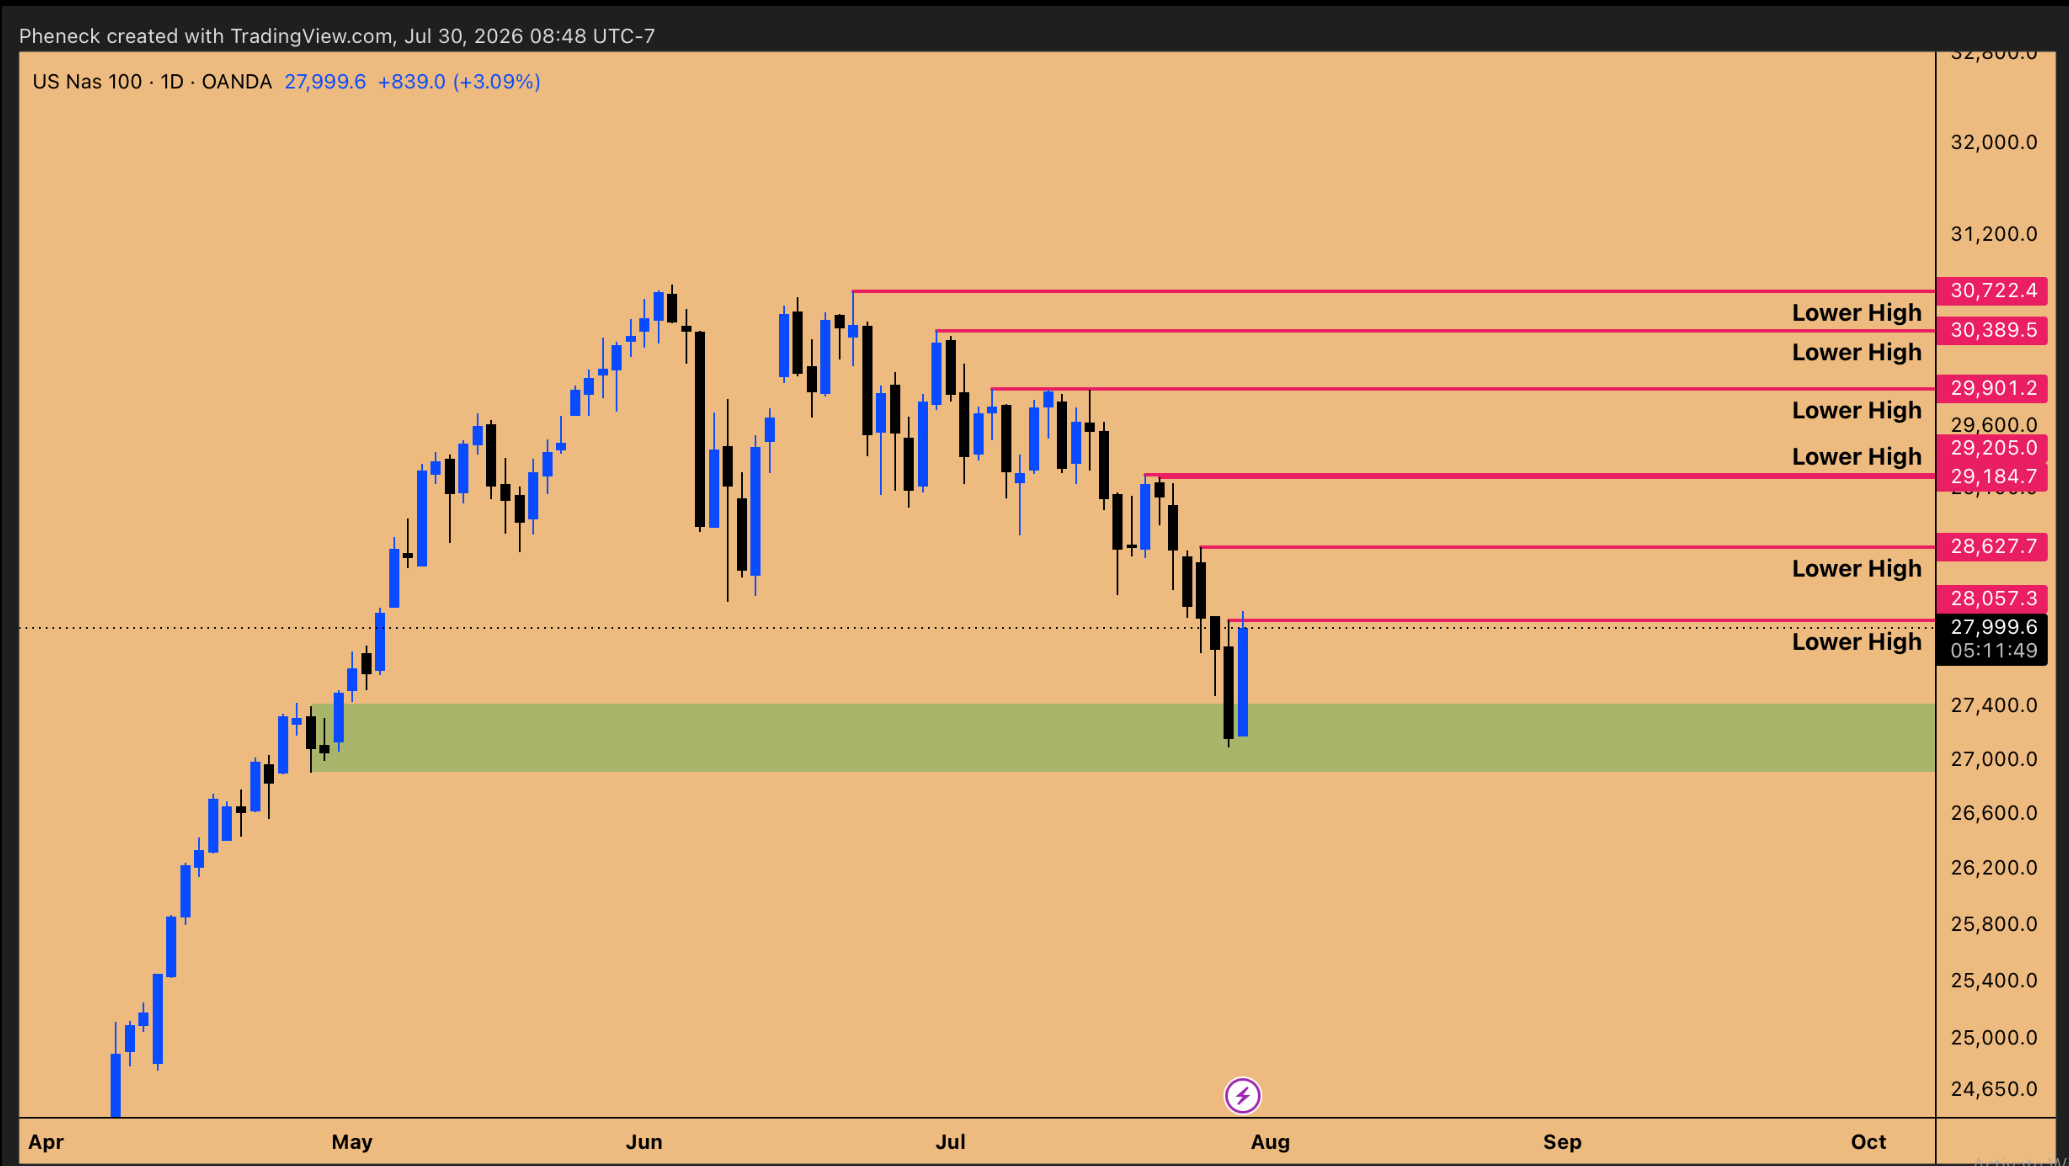
Figure 2: Series of Lower Highs breached on FOMC reversal → Daily Support defended → Market Structure Flipping back to bullish
I am not calling the entire bottom from that intraday move alone. The weekly candle still needs to confirm it. That is why I am looking to Nikkei and the S&P 500 rather than treating one NASDAQ squeeze as sufficient evidence.
Nikkei and the S&P 500 Hold the Higher-Timeframe Trigger
The FOMC move is the immediate reversal signal. Nikkei and the S&P 500 determine whether it survives on the higher time frame. The confirmation contract is parallel:
Nikkei: Close back above the inside-weekly lows, hold the bullish-engulfing reaction and produce follow-through.
S&P 500: Close above the reclaimed multi-week lows at roughly 7,400 and confirm the weekly SFP, inside three-week failure and inside four-week failure.
Nikkei Must Confirm the Inside-Weekly Failure
The pattern in Nikkei is an inside weekly candle. I expected the drawdown to extend lower and remove the obvious weekly liquidity pools. It came very close but did not complete that move. We now have a short-squeeze rally immediately after the FOMC event. The timing makes this a compelling potential bottom, but I am not calling it a confirmed bottom yet.
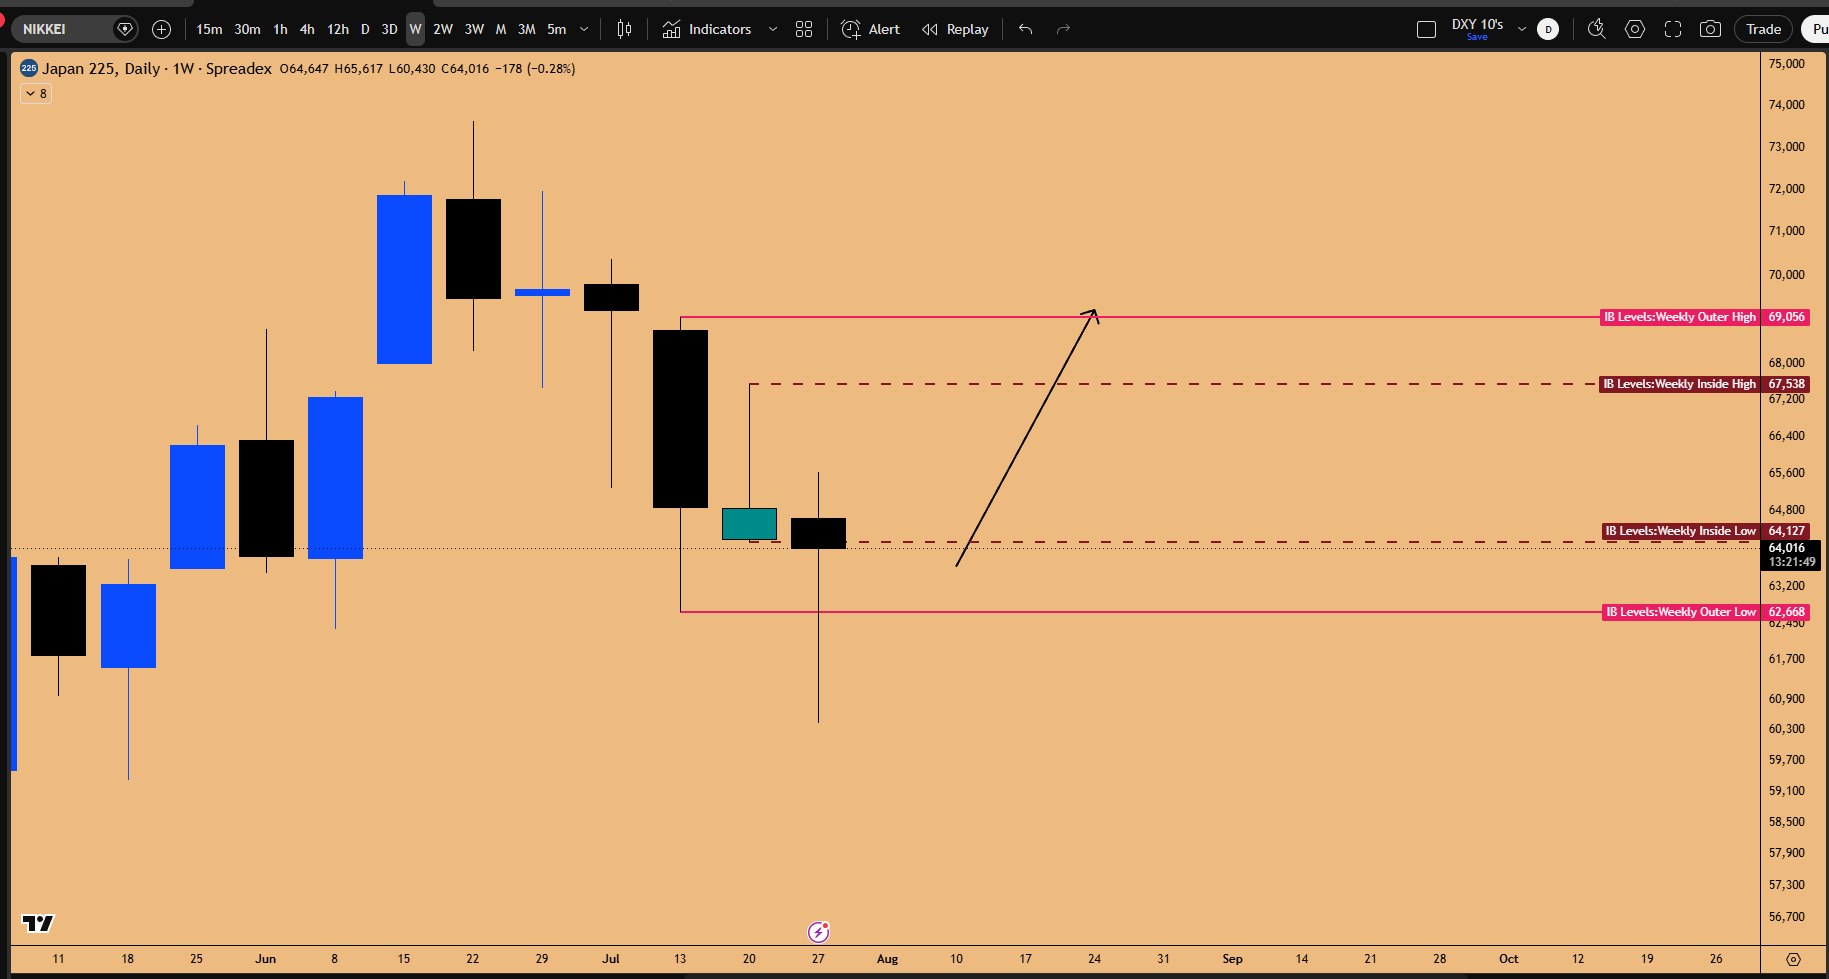
Figure 3: Inside Weekly Candle Failure pattern being triggered in NIKKEI 225, targeting upside Liquidity Pool at $69,056
The weekly candle needs to close back above the inside-weekly lows, specifically above 64,127. If it closes above those lows, the breakdown becomes an inside-weekly candle failure. In my opinion, that would be bottoming price action because it is happening during a high-volatility week with heavy volume, major liquidations in Asian markets and historic fear around the KOSPI, Nikkei and NASDAQ are all strong signs of a capitulatory low to be carved in.
If the breakdown fails, the positioning becomes important. A large number of traders have been leaning short because of the sentiment and the visible damage. A weekly failure would catch those positions off guard and give the SHORT SQUEEZE room to continue into the following week.
We also want to see follow-through happen:
A bullish-engulfing daily close would provide the Nikkei long trigger.
The next day then needs to hold the move, and the weekly candle must finish as an inside-weekly failure.
If that happens, it also supports continued NASDAQ strength because NASDAQ follows Nikkei closely.
There is a precedent behind the correction as well. When NASDAQ previously printed an inside-weekly failure but could not continue higher, the market broke down and spent roughly three weeks correcting. We do not want a similar thing happening with Nikkei, which could tarnish the chances of a proper SHORT SQUEEZE RALLY
Major Liquidity Grab on S&P500 3-week time frame
The S&P 500 carries the same idea through its inside three week candle structures. The four-week chart makes the liquidity easier to see over 3-week chart. The outer upside liquidity remains near 7,312, while the downside liquidity was taken first.
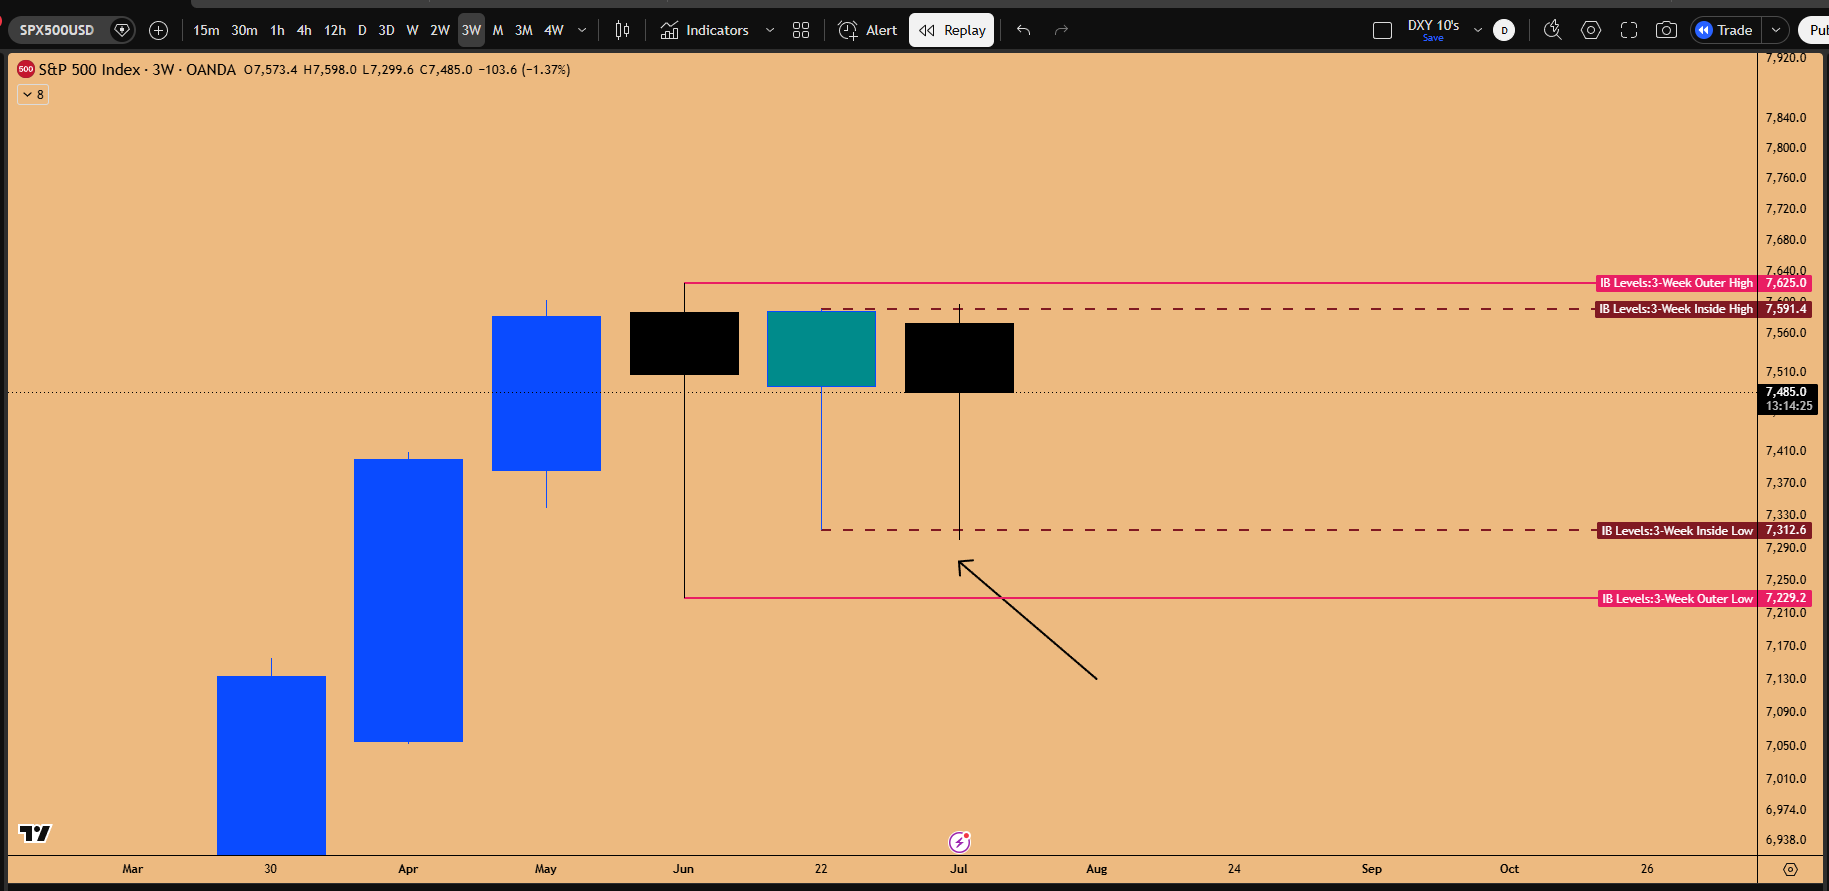
Figure 4: FOMC Drop caused SPX500 to grab liquidity below 7312, reversing violently after liquidity pools were swept
The higher-timeframe pattern is very clear. The inside three week candle structures had not taken their outer upside liquidity. Instead, they ran the downside first. That can happen when leverage breaks down in the system and a deleveraging phase pushes through support that would normally be difficult to break.
We have seen this before. During the January 2025 DeepSeek event, Nvidia dropped -16% sharply overnight and the S&P 500 ran the low of an inside three-week structure. The long trigger came from the daily SFP that immediately reclaimed the level. The market then reversed and eventually took the outer highs.
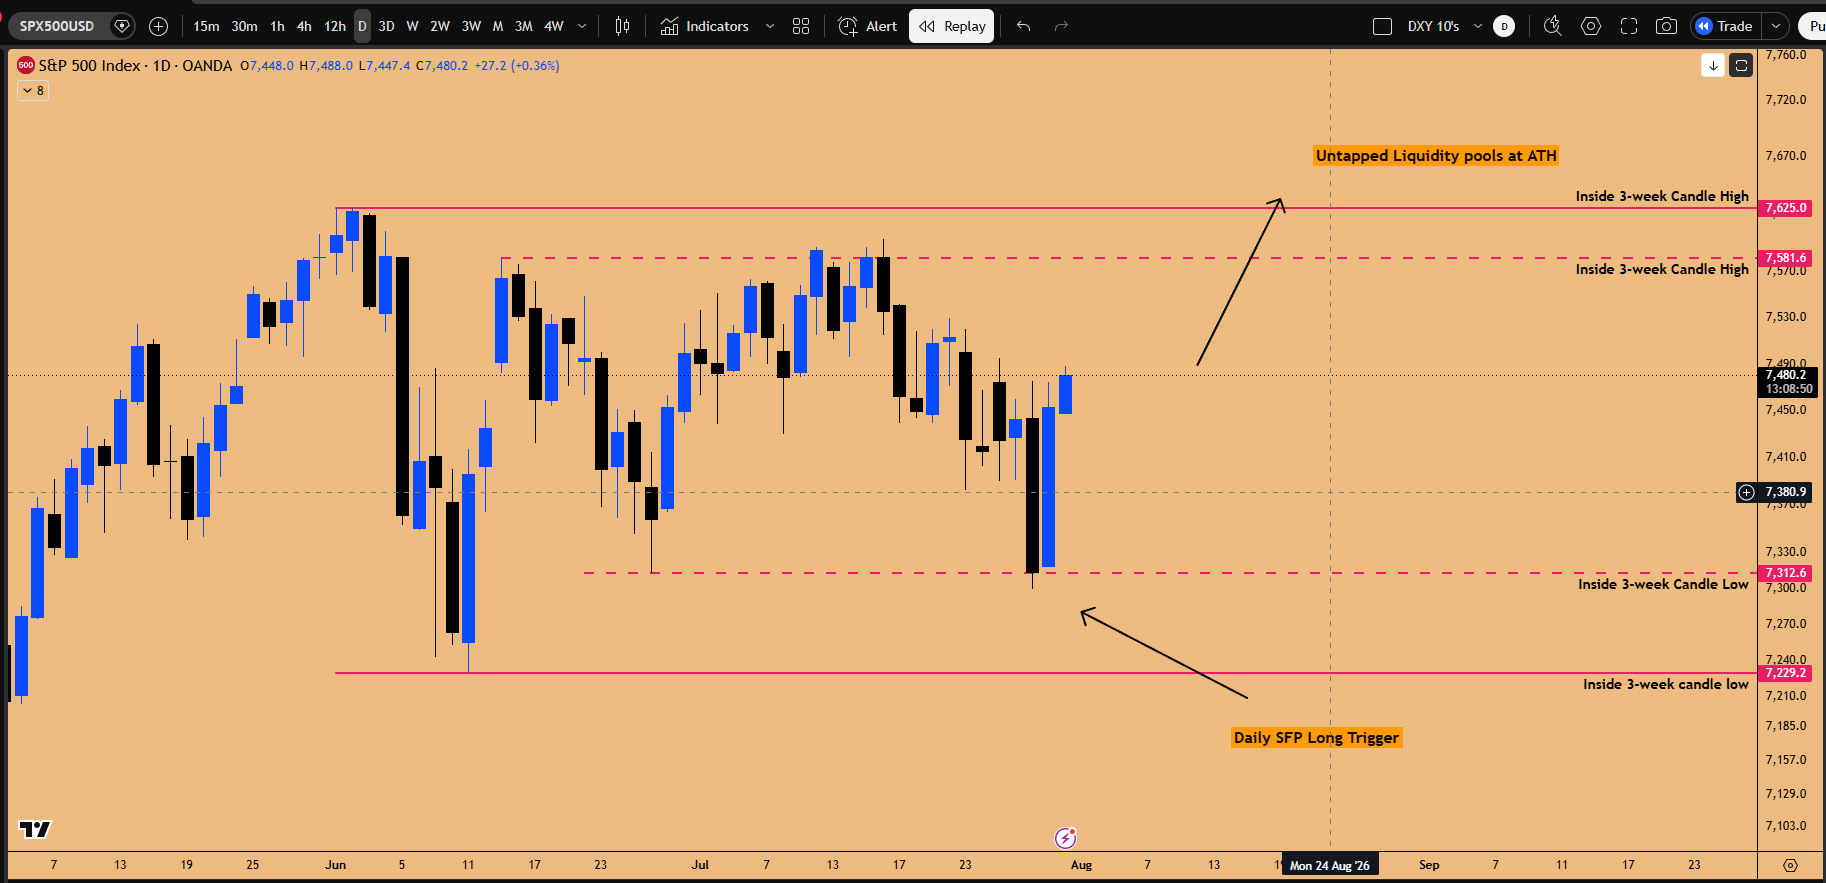
Figure 5: Daily SFP providing a long trigger for Inside 3-week Candle Failure Pattern
The current pattern is similar. The FOMC daily candle did not close below the previous three-week low, and the market has produced a proper bullish reaction. That is a daily SFP and a bull trigger.
S&P 500 confirmation: I want the daily candle to close above the reclaimed lows at roughly 7,400. That would confirm the weekly SFP, the inside three-week failure and the inside four-week failure. Apple and Amazon earnings also need to support the move. If both companies disappoint and the indices collapse, the multi-week failure thesis goes out the window.
Amazon Is My Preferred Catch-Up Trade
The reversal gives me a reason to look for long exposure. Amazon is where I want to place the new risk.
Position status (Opened): I am opening the March 19, 2027 $300 calls with 5% portfolio risk. This is being done before daily candle close ahead of Earnings Call For AMZN
The Three-Week Failure and the Open Gap
Amazon has an inside three-week candle that closes in one day. If earnings provides a strong boost and the candle closes above $245, it triggers an inside three-week candle failure. That pattern is a strong long trigger by itself, but it also has an open inefficiency above it. The three-week gap between $266.29 and $269.83 has been sitting open for a long time, and the same gap is visible on the monthly time frame. Higher-timeframe gaps do not normally remain open indefinitely.
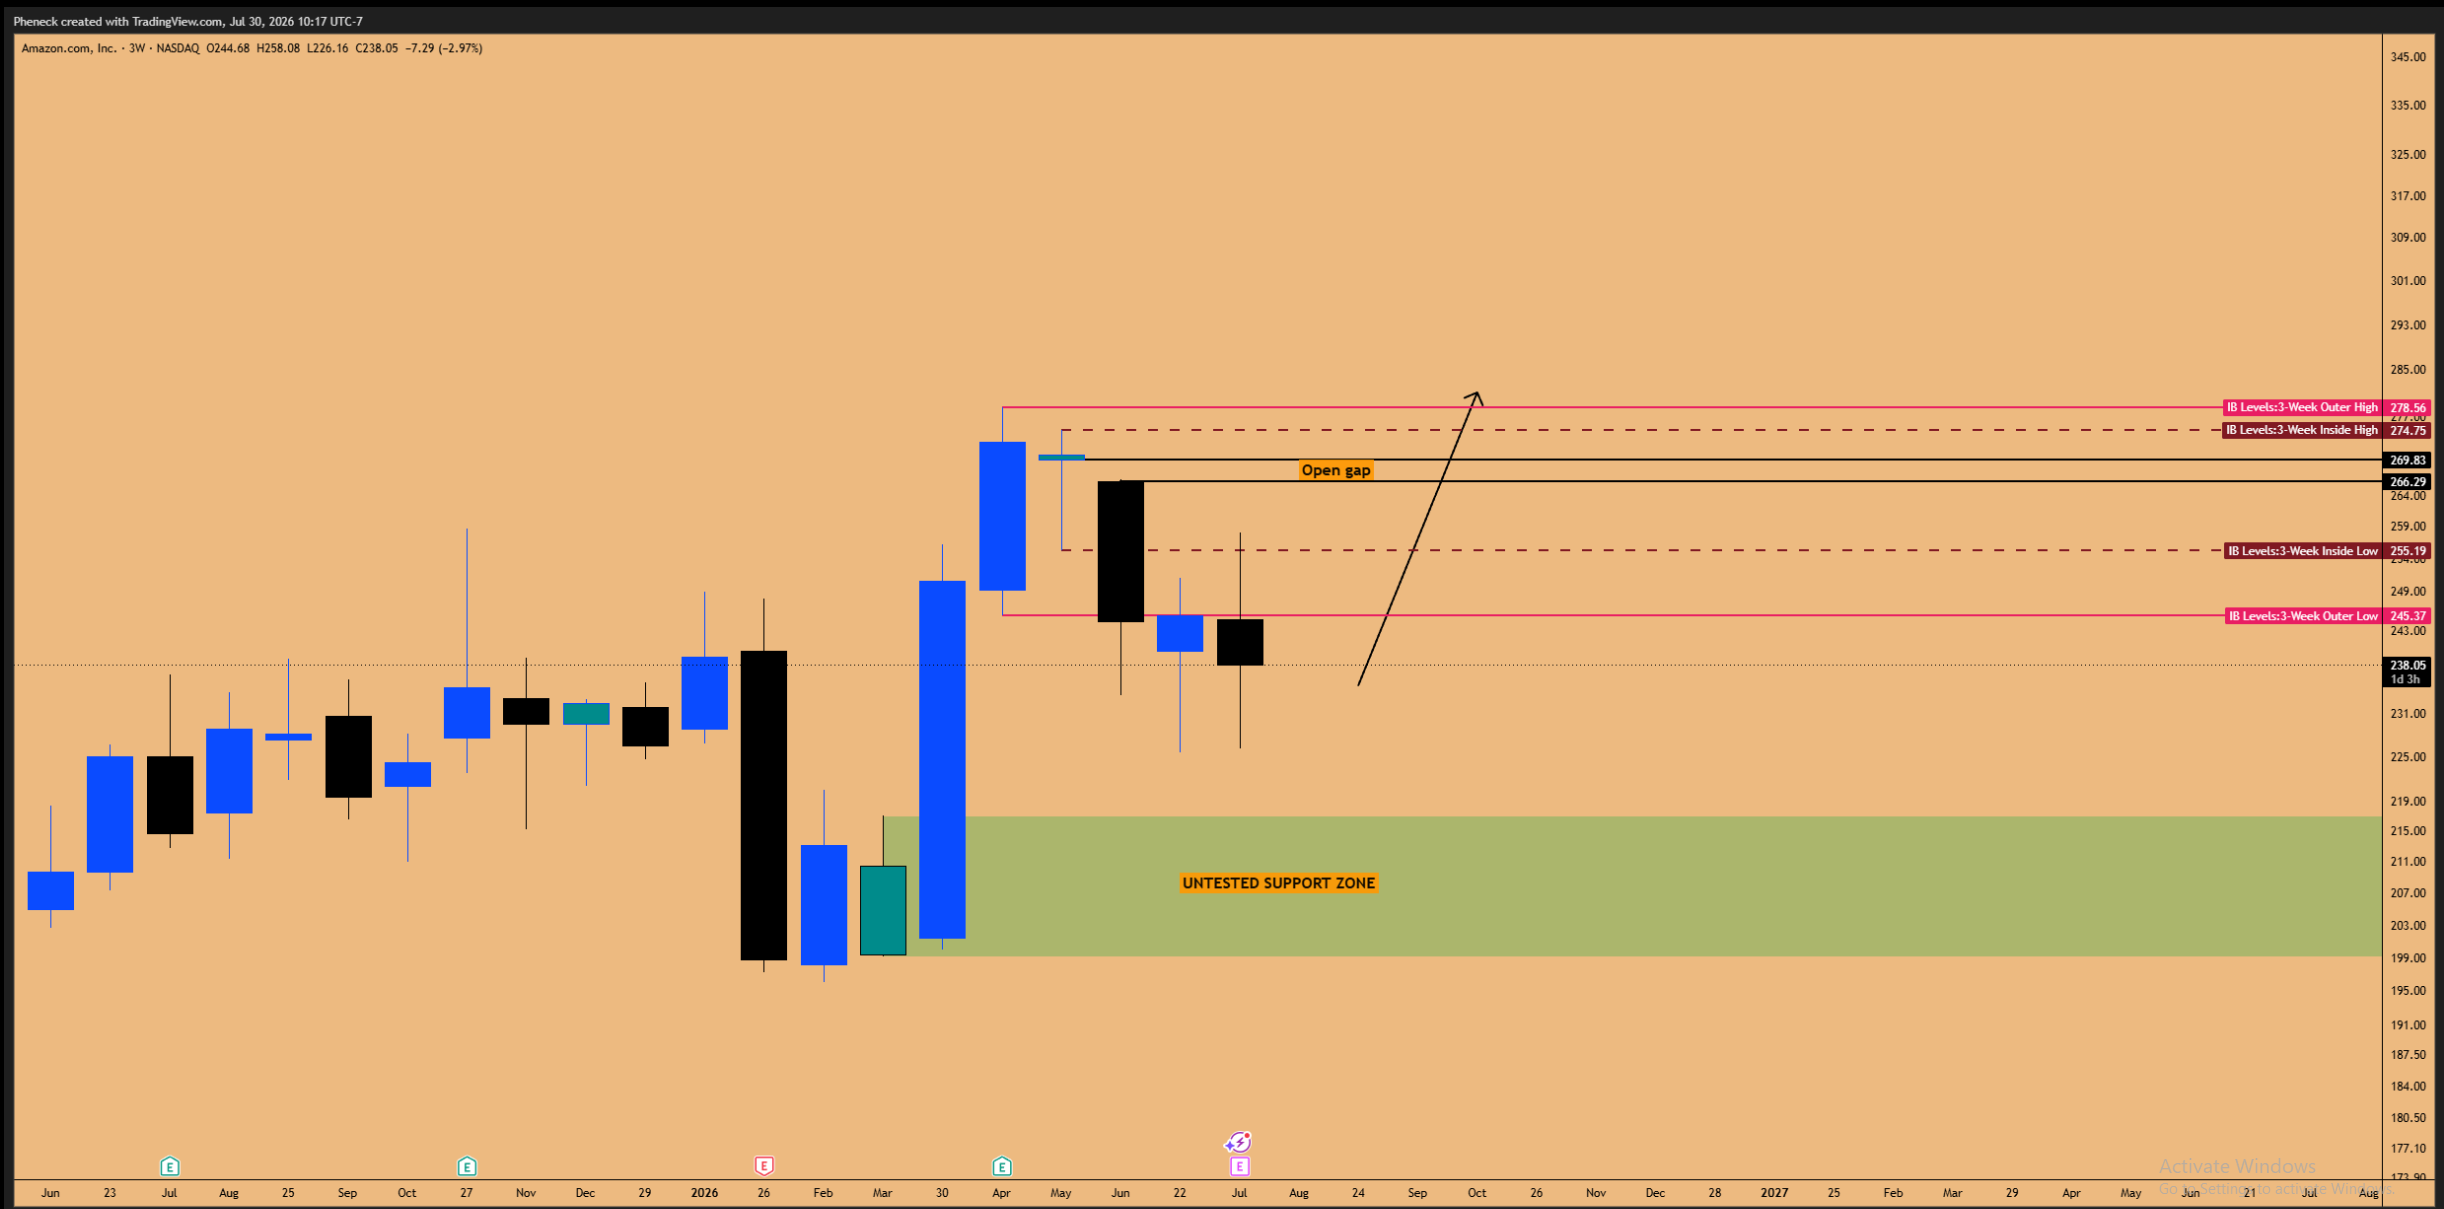
Figure 6: Inside 3-week Candle Failure Pattern in play for AMZN, just like SPX500
The quarterly structure also matters. Amazon has spent roughly two years moving sideways in an ascending triangle while the underlying fundamentals have continued to improve. The current quarterly candle has barely begun to expand. You are effectively still buying around the prior quarterly close.
That is the type of trade I prefer: the technical structure and the fundamental direction are aligning. The market has not priced Amazon in the same way it has priced the most crowded parts of the AI trade, and the higher-timeframe target remains open.
The March 2027 LEAPS Position
The trade contract is explicit:
Instrument: I am buying the March 19, 2027 $300 calls.
Starter risk: I will open a starter position with 5% portfolio risk.
Reference price and first path: The current contract was around $11.70 when I discussed entering the position. A move back toward the all-time highs around $280 could put the contract near $30, which would be roughly a 150% to 160% return.
Quarterly target: I do not believe Amazon necessarily stops there. My quarterly target remains $350.
Time horizon: This is a swing trade, not a day trade. The position can be held going into January, and the March expiration gives it roughly a six-month operating window with multiple earnings events.
Duration logic: I am buying time because the quarterly candle has not started its expansion. A short-dated option would force the trade to be right immediately. The March 2027 call allows the higher-timeframe structure and the earnings cycle to do the work.
Earnings Determine the Pace, Not the Thesis
Amazon may react positively to earnings, but it may also sell off if the company discusses more debt or higher capital expenditure. The market tends to hear the word capex and react first, as it did with Google. That would not automatically invalidate the six-month thesis. If Amazon drops 5% or 10% on earnings, I am prepared to add another 5% portfolio risk using the same March 2027 $300 calls. The initial position is 5%; the conditional maximum is 10%.
Earnings determine the pace, not the thesis: The immediate report changes the pace and entry price. The controlling thesis is still the higher-timeframe failure pattern, the open gap and the unexpanded quarterly structure.
I Am Rotating Apple Profits Into Amazon
I am not using excess cash to build the Amazon position. I closed my Apple long and freed the capital so it could be recycled.
Apple — CLOSED: The position produced roughly three times the return on my original exposure.
Amazon — PLANNED: The Apple profit is being recycled into the March 19, 2027 $300 calls.
Apple Has Already Completed Its Quarterly Move
I opened the Apple position when the consolidation breakout was retesting, and I rode it back toward the highs. The trade produced roughly three times the return on my original position. Closing it is not a bearish call on Apple. I have traded the company for years, and I still understand why it sits at the centre of the modern consumer culture. The issue is the quarterly range.
Apple completed essentially the entire quarterly candle’s move in one month. Holding the position for another two months would leave it sitting there while the option value eroded. The move I wanted has already happened.
That makes profit realization an allocation decision. I would rather recycle completed exposure than keep capital in a position whose expected quarterly expansion has already been delivered.
Amazon and Google Still Have Expansion Left
Amazon’s quarterly candle has not started expanding. Google’s has not started expanding either. Apple has already shown what the hyperscaler cohort can do during the quarter. I think of these companies as a pack of wolves inside the MAGS ETF. They often move in the same broad quarterly direction, even when the timing is different. Apple has already supplied the North Star signal. Amazon and Google are the laggards that still have room to catch up.
That does not mean the timing is guaranteed. Earnings still matter, and the failure patterns still need to confirm. It means the relative opportunity is better in the companies whose quarterly moves are still coiled. Google has followed a similar quarterly rhythm to Apple since the 2022 bottom. Apple has already completed the current push, while Google still has two months left. I expect Google to catch up and make a new all-time high.
The same principle applies to Amazon. I am moving the Apple profits into the part of the cohort where the expansion has not occurred, with enough time in the option contract to survive an uneven first earnings reaction.
DAX and Forex Confirm a Broader Risk-On Turn
The reversal is not confined to NASDAQ. DAX and the currency market are showing that the risk-on shift is broader. The cross-asset confirmation is visible in three places:
DAX: Higher lows on the three-week time frame remain intact, and price is pushing toward another breakout.
Forex: GBP/USD and EUR/USD are rising as the dollar structure turns bearish.
Broader liquidity response: VIX is red while crypto, gold, silver and equities are participating together.
DAX Never Broke Its Higher-Timeframe Trend
Most traders have been focused on the KOSPI and Nikkei damage. DAX has not been breaking down. It has continued to print higher lows on the three-week time frame. That is where I decide whether an asset class is bullish or bearish. If the three-week close is taken out, I want to be out. That is exactly why I exited NASDAQ.
DAX came close to invalidating the long thesis when it tested the daily support and the tightly grouped three-week lows. It did not break them. The bullish reaction arrived before the weekend, and Monday confirmed that low. While the KOSPI and Nikkei were selling off, DAX was mostly moving sideways. Now that the FOMC event is complete and NASDAQ and Nikkei are trying to bottom, DAX is pushing higher again.
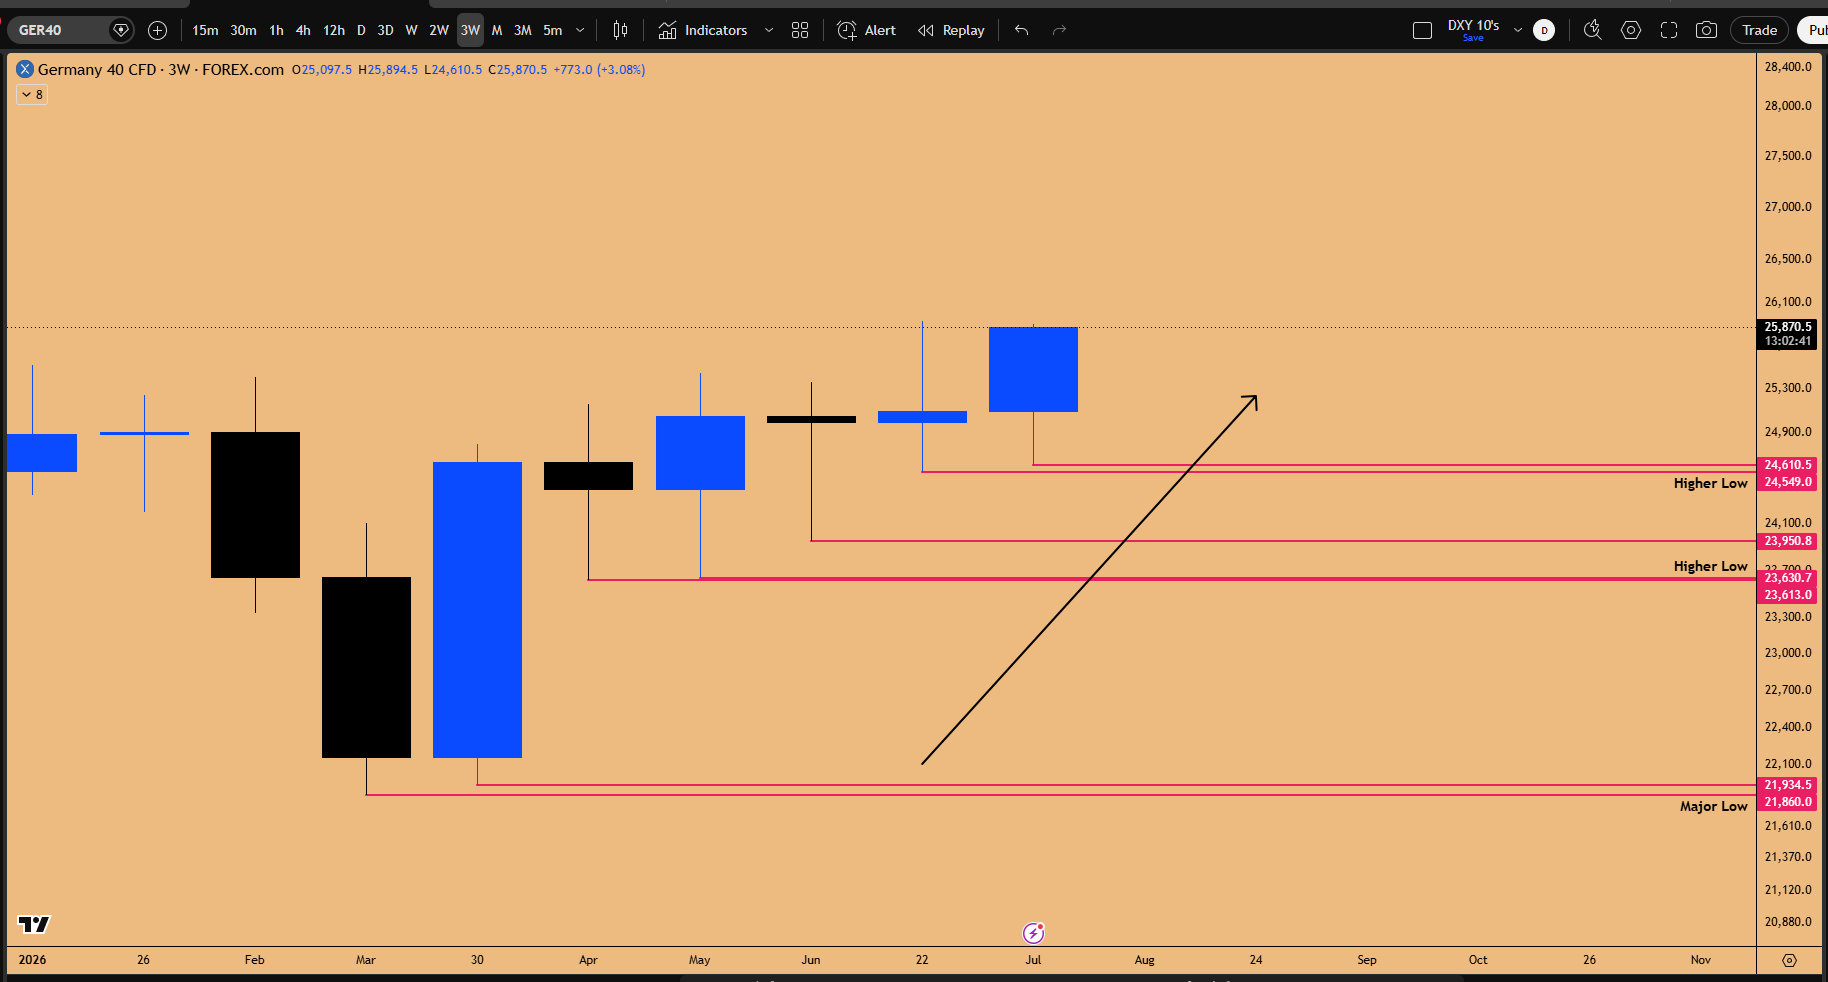
Figure 7: Higher Lows Maintained on DAX on 3-week time frame → Hyper Bullish trending environment intact.
If the move holds through the close, DAX can finish above the previous all-time high and above the inside three-week highs. That would confirm another breakout and signal continuation into the next three-week window. The important point is simple: this is not a bearish higher-timeframe market while the higher lows remain intact.
A Softer Dollar Broadens the Signal
GBP/USD and EUR/USD are also pointing toward a broader risk-on appetite. Their reaction after the FOMC suggests the dollar has topped and the current dollar structure is turning into a bearish order block. I had GBP/USD wrong. I tried to short it and stopped myself out early. I was more focused on the indices, but the currency move now adds evidence to the same reversal.
When the dollar comes down, GBP/USD and EUR/USD rise, VIX turns red and the major risk assets turn green, the shift is not localized to one US index. Crypto, gold, silver and equities are participating together. I did not fully investigate the USD/JPY intervention during the stream, so I am not using it as the explanation for the whole move. What matters is the direction of the broader liquidity response after the FOMC.
I had not seen a day like this through the sideways period since mid-June. If this were a broad risk-off continuation, GBP/USD, the S&P 500, BTC and gold should have been breaking down together. They were not. That is why I believe the FOMC event marked a proper turn in the drawdown and why I am thinking about how to regain long exposure.
The Hyperscaler Catch-Up Is the Real AI Trade
The most crowded AI exposure has been in memory and semiconductor stocks. Amazon and the other hyperscalers have not carried the same leverage. The relative-value map is:
Crowded exposure: Memory and semiconductor stocks have carried the most leveraged AI positioning.
Amazon: The quarterly candle remains unexpanded, the higher-timeframe gap is open and the technical structure is catching up with improving AWS fundamentals.
Google: The position is already active; its quarterly bottom and reclaim path provide the second catch-up expression.
Amazon’s Fundamentals Are Catching Its Technicals
Amazon has gone through a long sideways period while its fundamentals have continued to improve. The capital expenditure is expanding its ability to service AI demand through Amazon Web Services.
Google offered the recent example. The market initially punished Google for higher capex, then reversed when it recognized the demand, backlog and profit engine behind the spending. Google needed the infrastructure because it did not have enough capacity to service the demand for its AI products and cloud services.
Amazon is in a similar position. Microsoft has already shown that AI and cloud demand are strong. The market may not be pricing the same kind of AWS beat because investors remain focused on the most obvious memory and chip trades.
That creates the relative-value opportunity. A heavily levered memory stock can fall more than 50% when positioning unwinds. Amazon fell much less through the same period. It does not look like an asset where everybody is already leaning into the same leveraged bet.
The companies that can make a real impact with AI in the real economy are not necessarily the companies receiving the most leveraged ownership today. Amazon combines that under-ownership with an ascending triangle, an open higher-timeframe gap and an unexpanded quarterly candle.
Google’s Quarterly Bottom and Short-Squeeze Path
Position status is currently ACTIVE: Google remains one of my active long positions, and I expect to hold it through December. The quarterly support is unlikely to break in my opinion.
Google has rarely printed four consecutive bearish three-week candles. The comparable periods occurred in the 2022 bear market and around the 2025 trade-war decline. Those sequences eventually produced the bottom and a major bullish turn.
Google short-squeeze path: The real short-squeeze trigger is the reclaim above 350. Once Google trades back above that gap-fill and support/resistance region, I expect the move to target 375 first and then 400.
I want to add more leverage to the hyperscaler catch-up, but I prefer to place the new leverage in Amazon rather than increase Google. Google is already active. Amazon offers the better unexpanded structure and receives the recycled Apple capital.
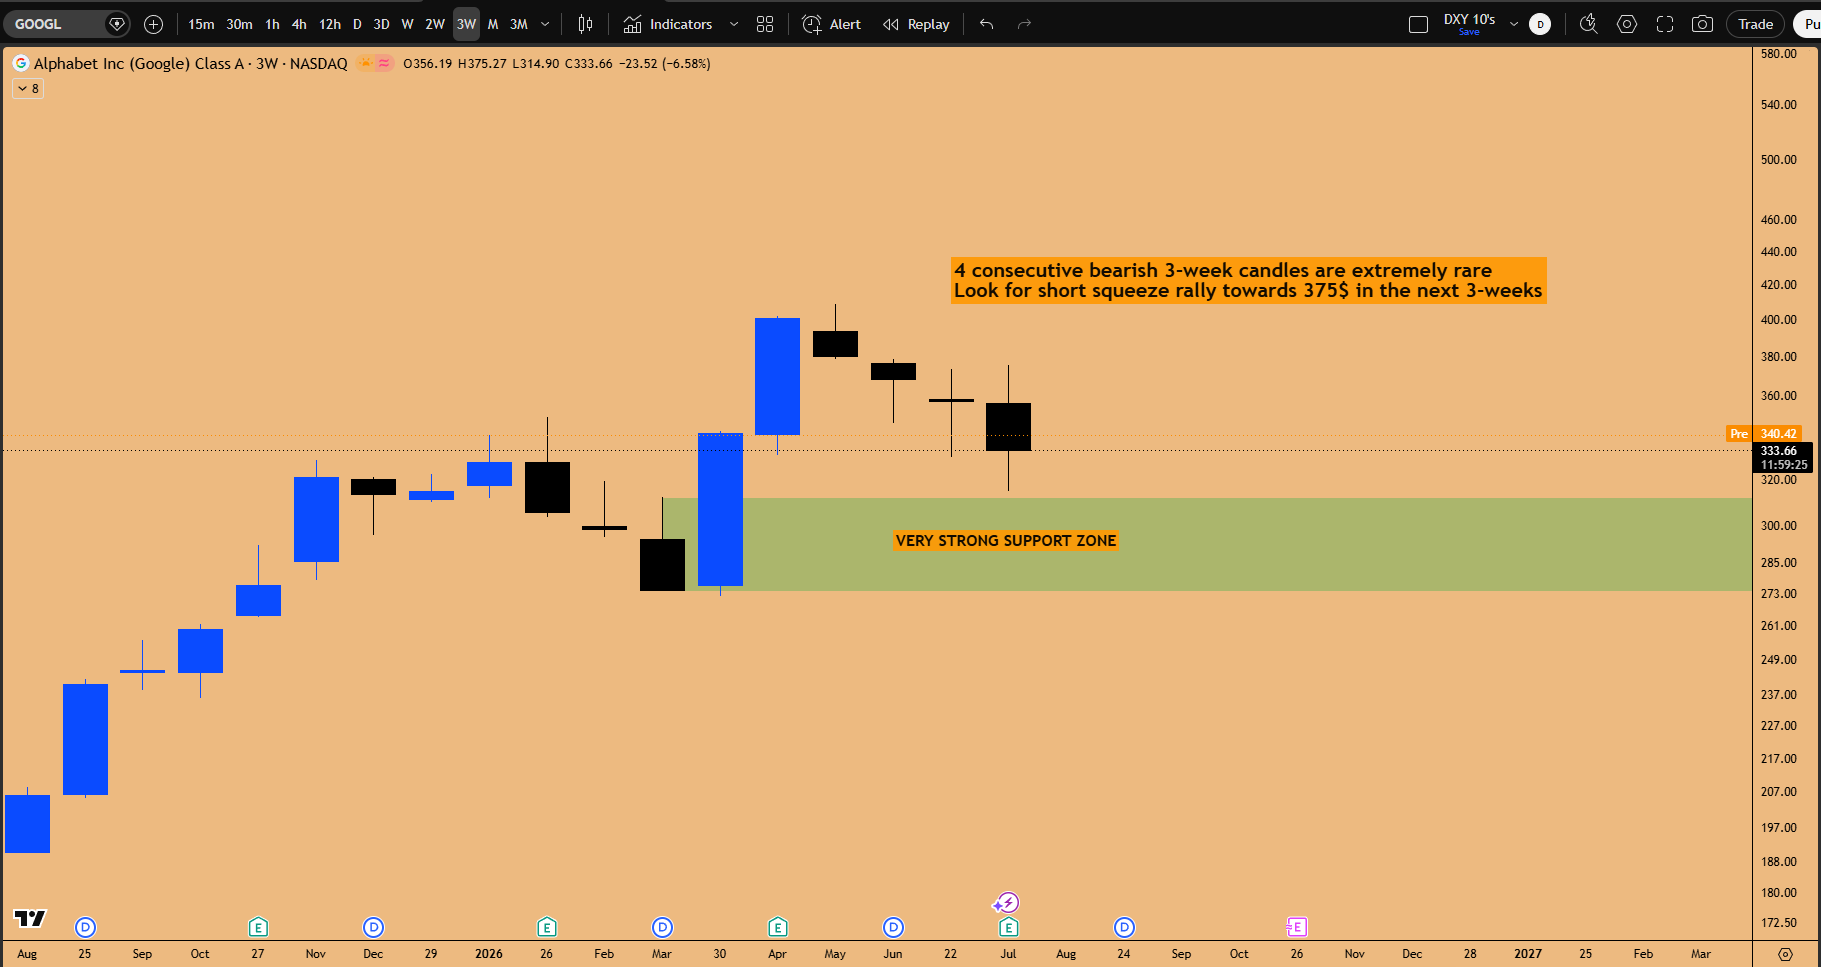
Figure 8: GOOGL About ready to take off, correction is nearly over
The Position and Invalidation Ledger
The market view and the position state are not the same thing. These are the positions and decisions I am carrying from this analysis.
What I Own and What I Am Opening
Google (Position ACTIVE): I am long and expect to hold the position through December.
Amazon (Position ACTIVE): I am opening the March 19, 2027 $300 calls with 5% portfolio risk, and I am prepared to add another 5% if earnings produce a 5% or 10% drop without breaking the higher-timeframe thesis.
Apple (Position CLOSED): The position produced roughly three times the return on my original exposure, and the profit is being recycled into Amazon.
BTC spot (Position ACTIVE): I opened the second half of the spot position when the inside two-week failure printed.
NASDAQ futures (NO AUTOMATIC ENTRY): If you want to use futures, I would wait for the weekly candle to close and confirm the long trigger rather than chase the first short-squeeze day.
What Must Confirm and What Breaks the Thesis
Nikkei: Must close above the inside-weekly lows and hold the bullish-engulfing reaction. The next session needs to show follow-through.
S&P 500: Must close above the reclaimed multi-week lows at roughly 7,400 and confirm the weekly SFP, inside three-week failure and inside four-week failure.
Apple and Amazon earnings: Cannot collapse the indices and erase the reversal. If both behemoths disappoint and the market rejects the reclaimed levels, the long-trigger sequence goes out the window.
Final market-wide invalidation: The current daily low is the final market-wide invalidation I am watching. If the market gives that low out, the reversal thesis has failed.
BTC Is Bottoming, but Expansion Has Not Begun
I have been bullish on BTC. There is nothing structurally wrong with the asset in this analysis; it is going through a bottoming process. The important relative-strength signal appeared while NASDAQ was breaking down. BTC did not follow it lower. It stayed sideways. That tells me the selling that needed to happen in BTC has largely already happened and that there are fewer sellers left.
That is how BTC often bottoms. It gets left for dead, the selling pressure disappears, and the lack of additional sellers creates the base for the next move. The inside two-week failure is the trigger I have been using. Similar failures have marked important BTC bottoms in the past. When the current pattern printed, I opened the second half of my spot position.
I remain bullish and think BTC can trade toward 74,000 in the immediate move. I do not know exactly when that move begins.
Position status is currently ACTIVE: The trigger exists on the higher time frame, and my spot position is active, but the market is still sideways. Expansion has not started. The correct response is patience rather than pretending the timing is known.
What I Am Watching Next
Next evidence: Apple and Amazon earnings, Nikkei’s weekly close, the S&P 500 reclaim around 7,400 and follow-through after the FOMC reversal.
Continuation case: If those conditions hold, I expect the short squeeze to continue across NASDAQ, the S&P 500 and the broader hyperscaler cohort.
Position map: Amazon is the new position I am opening. Google an
d BTC remain active. Apple is complete.
Next decision point: The weekly outlook will determine whether the first reversal becomes a durable expansion.
Non-negotiable invalidation: If the current daily low gives way, the reversal thesis is invalid.
This report reflects market commentary and trade planning from Weekly Market Outlook episode shared in Speculators Trading Discord Server. It is provided for educational purposes and does not constitute individualized financial advice. Every setup carries risk; position sizing and execution remain the reader’s responsibility.