The Great Rotation: Energy Shocks, CTA Liquidations, and the Trade Setup Nobody Believes In


Executive Summary
What happens when the largest algorithmic trading systems on the planet are forced to liquidate at the exact moment geopolitical headlines flip from doom to hope? You get the kind of violent, disbelief-fueled rally that separates the prepared from the paralyzed.
This week delivered exactly that scenario. The S&P 500 surged over 3%, adding roughly $1 Trilion in market cap in a single session, while the NASDAQ ripped nearly 4% off its lows. The catalyst on the surface was President Trump signaling that the US could exit the Iran conflict within two to three weeks. But beneath the headlines, a far more mechanical force was at work: CTA liquidation triggers firing as both indices breached the critical 10% drawdown threshold, forcing rule-based systems to unwind long positions into an already panicked market. The result was a snapback rally that caught most traders flat-footed.
Yet here is the paradox that should keep every macro trader awake this week. Nobody believes it. Institutional commentators are publicly stating they are “not convinced.” Investors are demanding “concrete evidence” before re-engaging. And that, historically, is precisely the environment where the most powerful rallies are born, in the fog of collective disbelief, and we are getting close tot hat sentiment.
Meanwhile, the real story is unfolding across an entirely different axis. European inflation has surged to 2.5%, forcing the ECB into rate hikes not because the economy is thriving, but because an energy shock is threatening to spiral out of control. Real interest rate differentials between the US and Europe are screaming that EUR/USD is mispriced by as much as 500 pips. Asian economies, starved of Gulf oil by Strait of Hormuz disruptions, are setting up for sustained underperformance against US equities. And through all of this, the 6-week FOMC cycle indicator is flashing signals that could define portfolio positioning for the next six weeks.
The confluence is extraordinary. What looks like a relief rally may actually be the opening act of a much larger capital rotation, one that funnels global flows back into the US dollar and punishes energy-dependent economies from Frankfurt to Tokyo. But the highest-conviction trade of them all? That reveal is still ahead.
Here is what you need to know:
S&P 500 and NASDAQ bounced violently off the 10% CTA drawdown trigger, a pattern with decades of historical precedent
President Trump delivered a critical speech Wednesday on the Iran War, with Polymarket pricing boots on the ground above 60%
The 6-week FOMC cycle indicator has been released, automating range and Fibonacci level identification across all assets
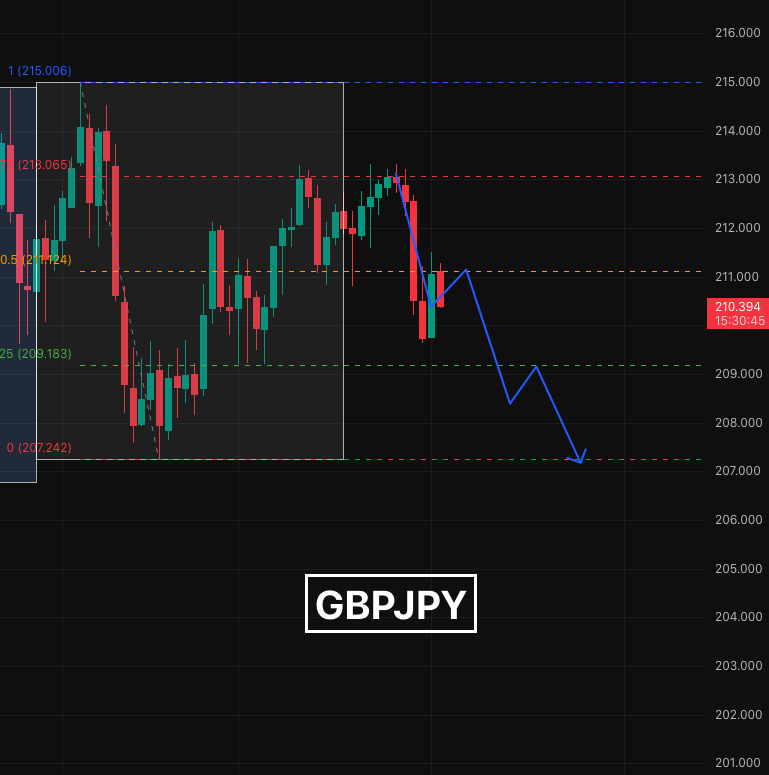
GBPJPY is being actively shorted in a layered position strategy targeting 198
ECB rate hikes into an energy-driven inflationary scare are not bullish for the euro, despite conventional rate differential logic
Real yield differentials suggest EUR/USD should trade closer to 1.10, not 1.15
Asian markets face sustained underperformance as Strait of Hormuz closures choke oil supply lines
A generational convergence of macro forces is building toward one decisive directional bet
The 6-Week Cycle Indicator: Automating the Edge
How the Cycle Works
For those new to the framework, the 6-week FOMC cycle captures a powerful structural pattern: between each Federal Reserve meeting, price creates a defined high and low, establishing a complete range. Through rigorous backtesting, the data reveals that once price breaks out of one side of this range, there is less than a 10% probability of reaching the opposite side before the next Fed meeting. This asymmetry is the foundation of the entire trading approach.
The newly released TradingView indicator automates what was previously a manual process, drawing the cycle boxes and Fibonacci levels across any chart. For traders rotating through 20, 30, or even 80 charts daily, this removes significant manual labor while preserving the analytical edge.
The power of the 6-week cycle lies in its simplicity. Between each Fed meeting, price creates a high and low. Once a breakout occurs, the probability of reversing to the other side drops below 10%. This is the framework that governs every position we build.
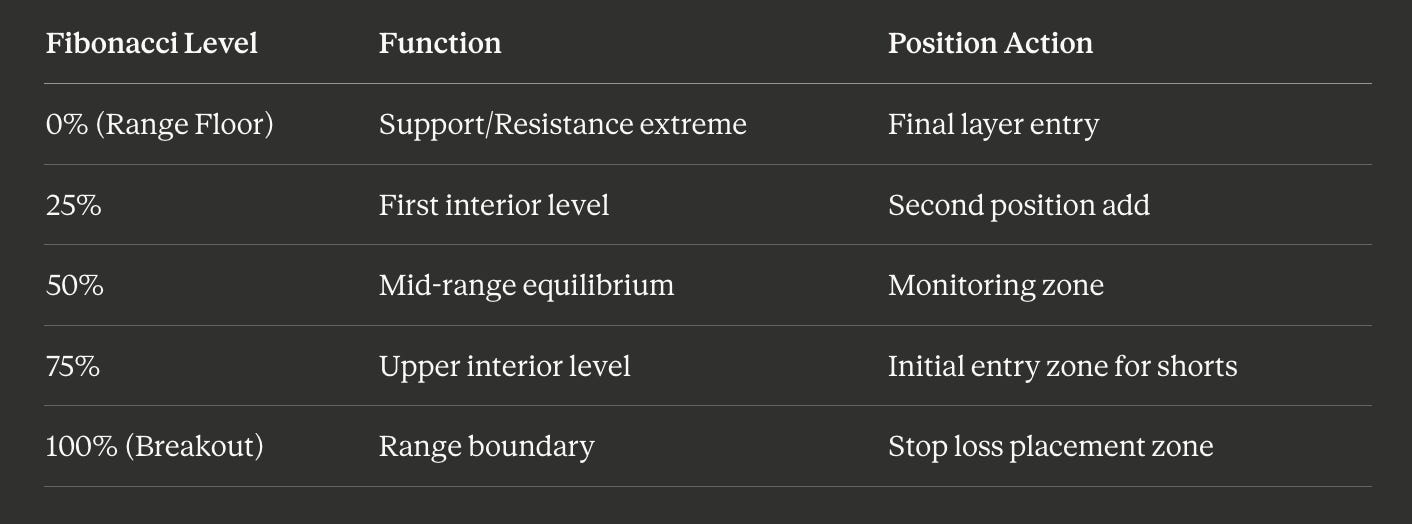
The range is subdivided into four Fibonacci levels: the 0% floor, the 25% level, the 50th percentile, the 75% level, and the 100% breakout zone. These levels serve as systematic entry points for position accumulation rather than simple breakout triggers.
You can find the indicator on Tradingview by searching:
Spec Trading 6-week cycle
GBPJPY: The Live Trade in Action
The live application of this framework is currently playing out on GBPJPY. The new cycle started on March 18th. Price eventually reached the upper band, where the first short position was initiated. The stop loss was placed conservatively outside the range bound, though in this scenario a slightly more aggressive placement between 214 and 215 was justified given the low probability of price getting “sucked above” that zone.