

The Persian Gulf Paradox: Real Yields, Oil Flows, and the Two Paths to a Bearish 2026


Executive Summary
What happens when every road leads to the same destination, and that destination is lower?
The first quarter of 2026 is days from closing, and the market sits at a crossroads defined not by earnings revisions or rate guidance, but by something far more primal: oil, geopolitics, and the psychology of fear itself. Real yields on US 10-year bonds are climbing, driven by a widening gap between what the market expects on inflation and what the bond market is actually pricing. The US dollar is gathering strength in precisely the environment it thrives: rising real yields and falling equities. And yet, beneath the surface, a deeper tension is building. Two geopolitical scenarios are emerging from the Persian Gulf conflict, and here is what makes this moment so remarkable. Both of them point to the same outcome for equities by year-end.

But before we get there, execution itself deserves the spotlight. How many times have you stared at a textbook setup, felt the conviction in your bones, and then watched your finger hover over the button while your brain invented reasons not to press it? The six-week cycle on GBPJPY just entered its initiation zone, and a live short has been placed with 2% risk. The method behind that confidence, a brutally simple repetition protocol, is the kind of edge that separates traders who see opportunities from traders who actually capture them.
On the macro stage, EURUSD is being set up for a short from the 1.17 to 1.1775 region, driven by Europe’s vulnerability to elevated energy prices and the demand destruction that follows. Oil itself may be closer to a local top than most models suggest, because the flow calculations through the Strait of Hormuz tell a different story than the headlines. Central banks, from the Fed to the BOE to the ECB, are beginning to price rate hikes into December 2026 futures, and credit spreads are quietly widening.
The S&P 500 has already poked outside its six-week cycle to the downside. Silver has continued its descent since positions were halved in late January. And the convergence of all these forces, the real yields, the dollar, the oil dynamics, the central bank repricing, builds toward one high-conviction call that frames the entire year ahead.
What looks like noise today is actually the market telling you exactly where it wants to finish. You just have to be willing to listen.
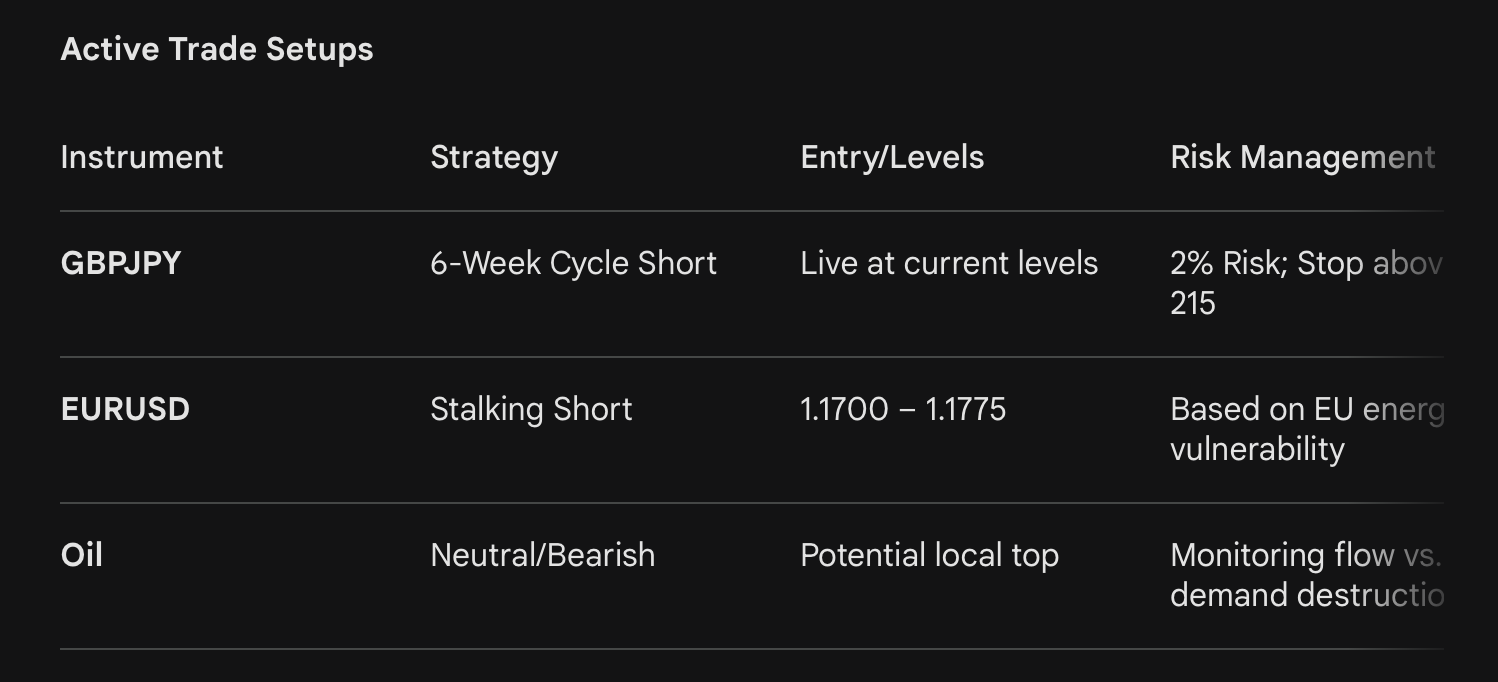
GBPJPY six-week cycle short initiated at current levels with 2% risk, targeting a breakdown lower
Real yields climbing to 2%, creating a textbook bullish dollar, bearish equities environment
EURUSD short setup developing near 1.17 to 1.1775, driven by European energy vulnerability
Oil potentially topped out as Strait of Hormuz flow calculations diverge from consensus
Central banks repricing: BOE rates projected 78 bps above the Fed by year-end, ECB futures at 2.8%
Credit spreads widening, signaling a shift from risk-on complacency to risk-off vigilance
Two Persian Gulf scenarios converge on the same S&P 500 outcome, and that outcome changes everything
Execution Mastery: The 10-Repetition Protocol
Why Your Brain Sabotages Your Best Setups
Every trader has experienced it. The setup is clean. The levels are defined. The edge is cataloged. And yet, in the moment of execution, something shifts. The mind intervenes with doubt, with “what if,” with the memory of a loss that has nothing to do with the current trade. This is not a flaw in the strategy. It is a flaw in the wiring, and it can be fixed.
The goal is not to train until you get it right. The goal is to train until you simply cannot get it wrong anymore. It becomes so obvious that you just continue doing the same things. When a trade shows up, you just keep hitting it.
The protocol is deceptively simple. Take a trade that fits your edge, one that has been cataloged in your dataset of previous setups. Load it into a simulator. Execute it from entry to exit exactly as you would in a live environment: position sizing, stop placement, take profit, the full sequence. Then do it again. And again. Ten times total.
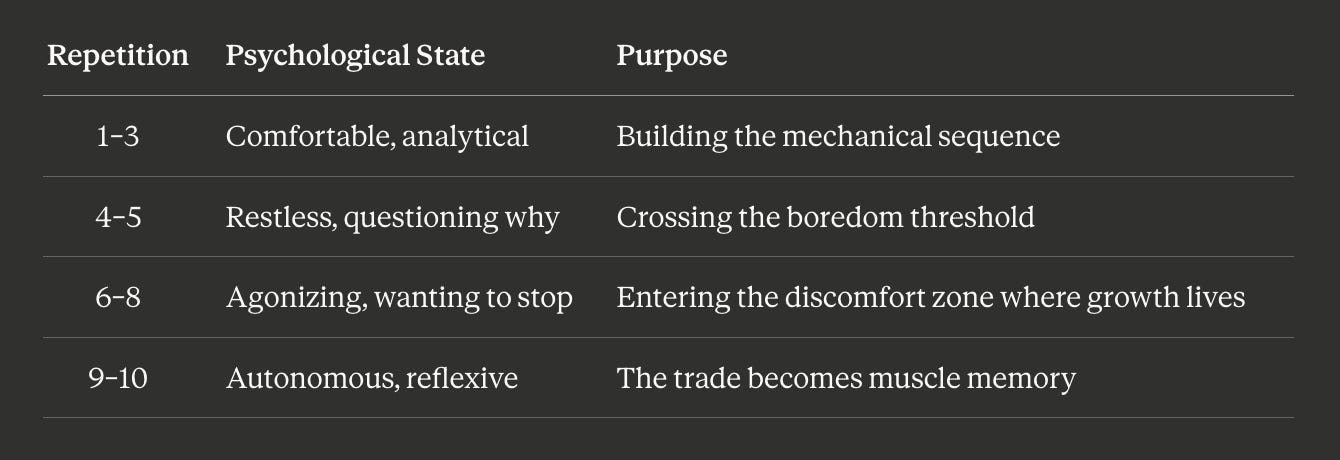
The sweet spot is ten repetitions because somewhere around the fourth or fifth attempt, it becomes agonizing. The brain resists pure repetition. It wants novelty, complexity, a reason to deviate. That resistance is the signal. When the exercise feels painful, particularly psychologically, you are in the discomfort zone. That means you are growing. By the tenth repetition, the execution pathway has been carved so deeply that when the live setup appears, your body responds before your doubts can intervene.
Usually, when you feel pain, particularly psychological pain, that means you’re in a discomfort zone. That means you’re likely growing and learning something.
This is not theory. This is the method that was applied before initiating a live GBPJPY short this very session. The six-week cycle had price entering the zone of interest, and the first short was placed with 2% risk. No hesitation. No second-guessing. The repetitions had already been done.
GBPJPY Six-Week Cycle: Live Trade Initiation
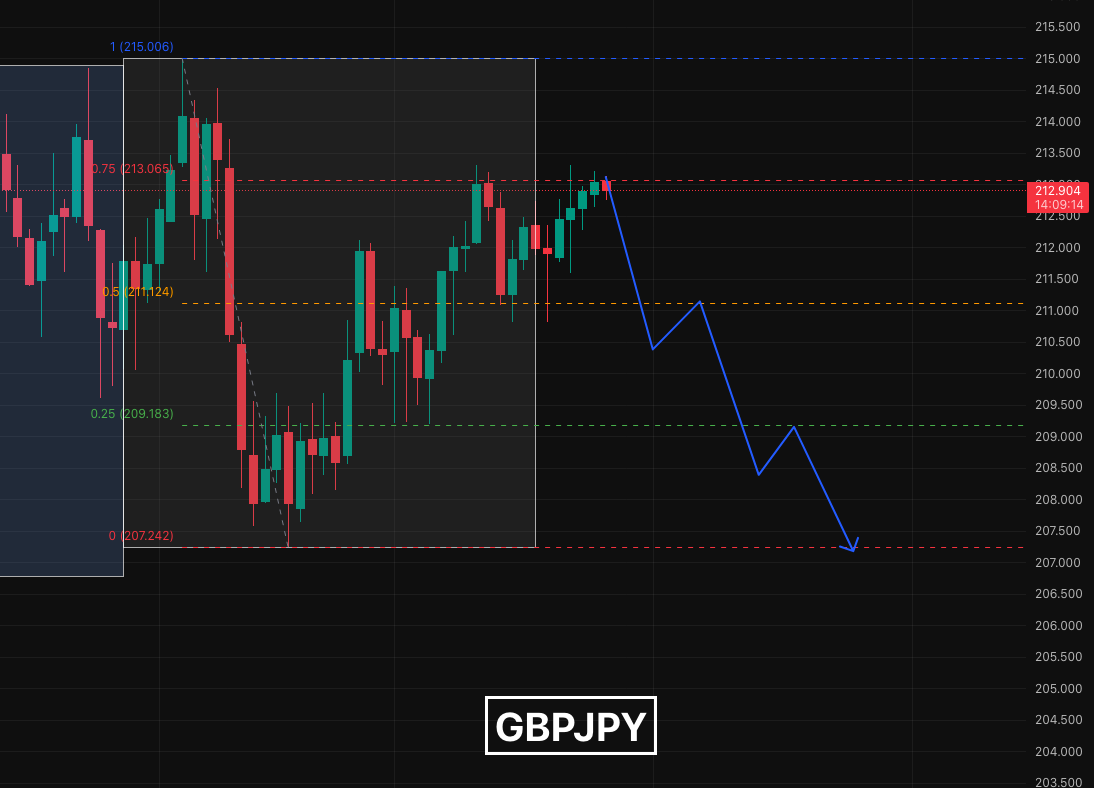
The six-week cycle on GBPJPY operates with a clear hierarchy of levels. In a bearish cycle, the green line marks the first initiation zone, the yellow line offers the second scaling opportunity, and the red line defines the outer stop boundary. Position building begins at the green line with stops placed behind the red line, targeting a breakdown lower.
The current environment is not yet ripe for a high-probability collapse, which is acknowledged openly. The last time conditions aligned for a sharp decline, it happened too quickly and without the usual structure. Nonetheless, the first position is live, and lower levels will invite additional entries. The key principle: you do not wait for the perfect environment to execute on a cataloged edge. You execute, manage, and let the cycle do its work.
Real Yields, the Dollar, and the Macro Engine
Dissecting the 10-Year Real Yield
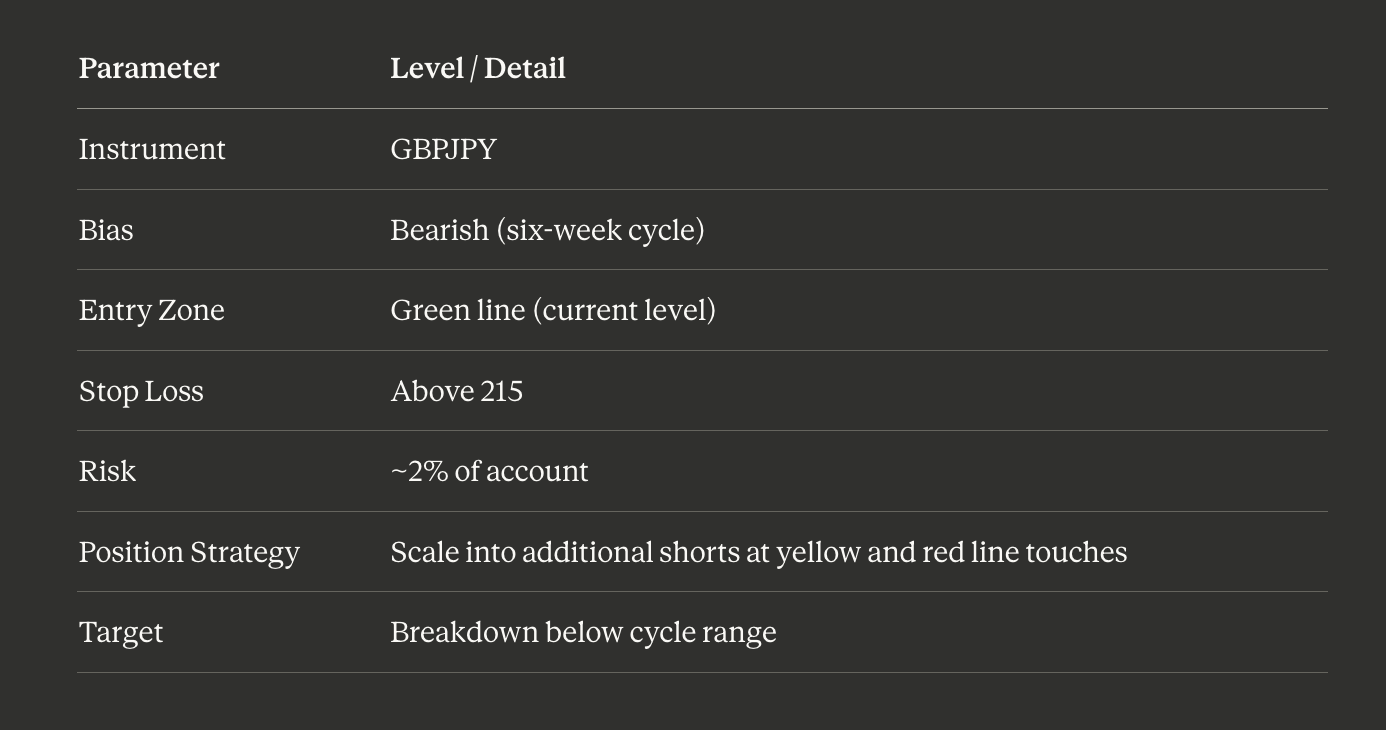
The real yield on the US 10-year bond currently sits at 2%, derived by stripping the inflation component from the nominal yield of 4.35%. This single chart functions as a master signal for risk appetite, dollar direction, and equity performance simultaneously. Before the Persian Gulf conflict escalated, the call was for real yields to decline. That call was correct, and the move lower shook out anyone positioned for higher yields. Now, with war reshaping the inflation narrative, the dynamics are shifting again.
The inflation break-even chart, a forward-looking measure of what the market expects average inflation to be over the next decade, currently reads approximately 2.3% and has actually declined recently. The market is telling us it does not see inflation as a structural problem. In the past, when this measure spiked sharply, the Fed responded with rate hikes.
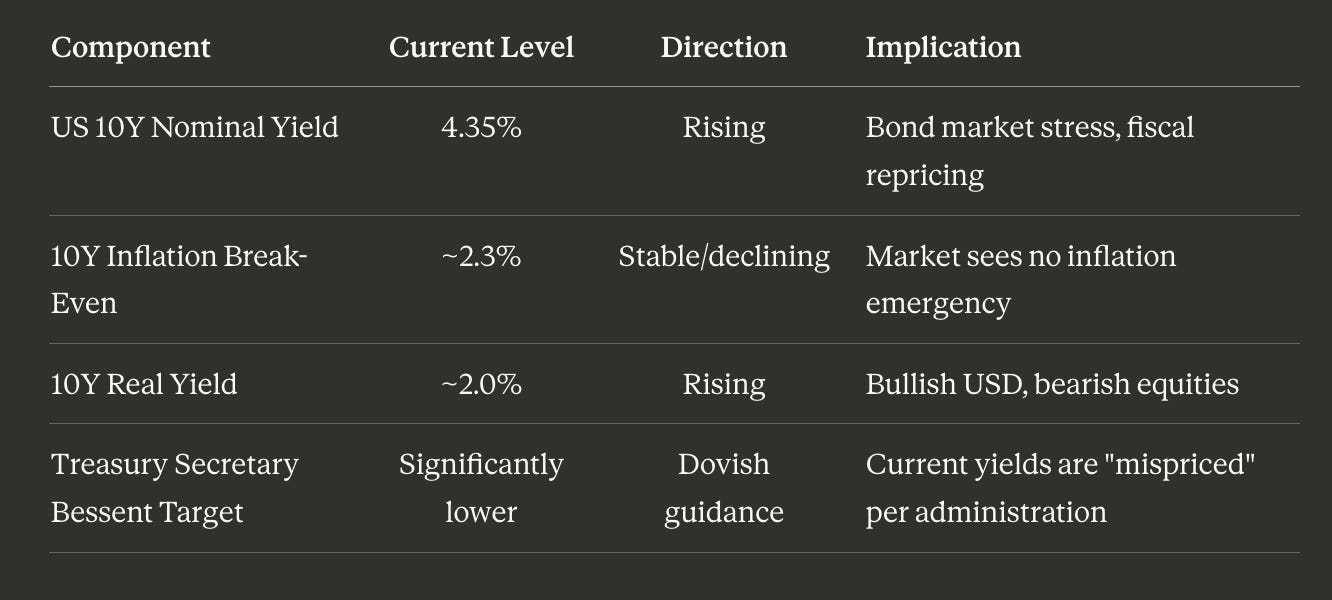
Real yields have been going up, stocks have been going down. This is a dream scenario for a dollar rally. Once this changes, once real yields come down and stocks pick up, that is when you want to short the dollar.
The tension here is critical. Treasury Secretary Bessent has publicly stated he wants the 10-year yield to trade substantially lower. That means the administration views current levels as mispriced. But the war premium and potential central bank tightening are pushing in the opposite direction. The ceiling for this move higher remains unknown, and it could inflict significant pain before any reversal.
EURUSD Short Setup: Europe’s Energy Trap
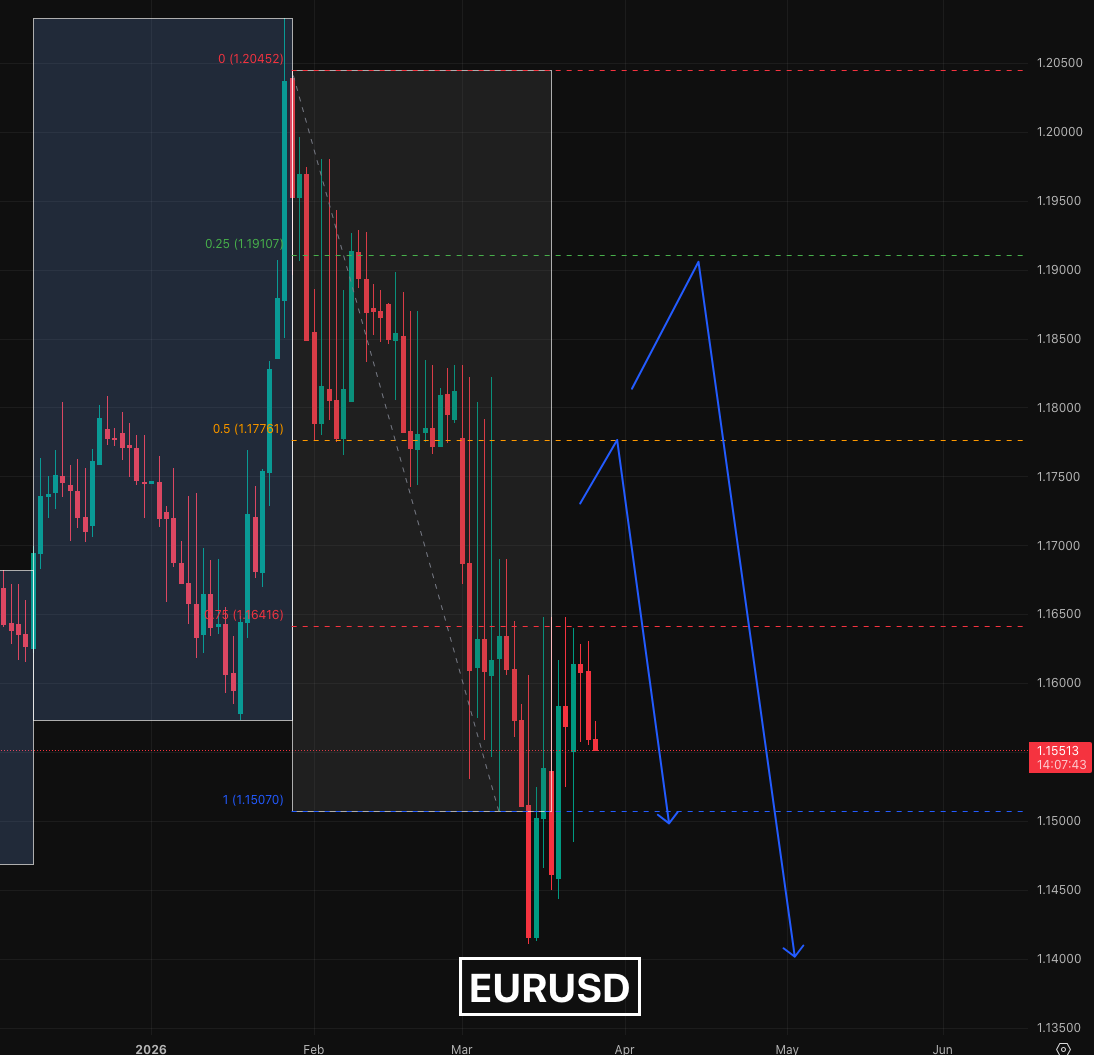
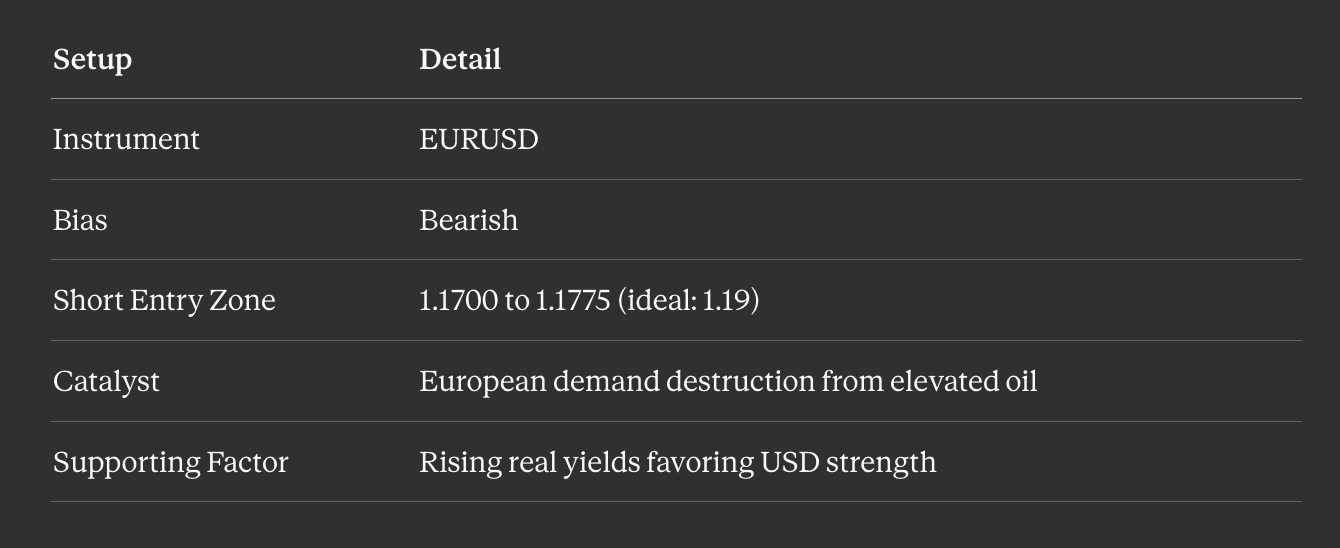
The dollar’s strength translates directly into a EURUSD short thesis, but timing matters. The six-week cycle points to a climb back toward the 1.17 to 1.1775 zone before shorts become attractive. A push to 1.19 would be even better.
The reasoning is structural. Europe imports enormous quantities of energy. With oil trading at elevated levels above 70 to 80, the continent faces not just higher costs but something more destructive: demand destruction. Manufacturers, farmers, and utility companies cannot absorb these prices indefinitely. They do not raise prices forever. They simply stop operating, and competitors elsewhere absorb their market share.
Oil, the Strait of Hormuz, and Two War Scenarios
Why Oil May Have Topped
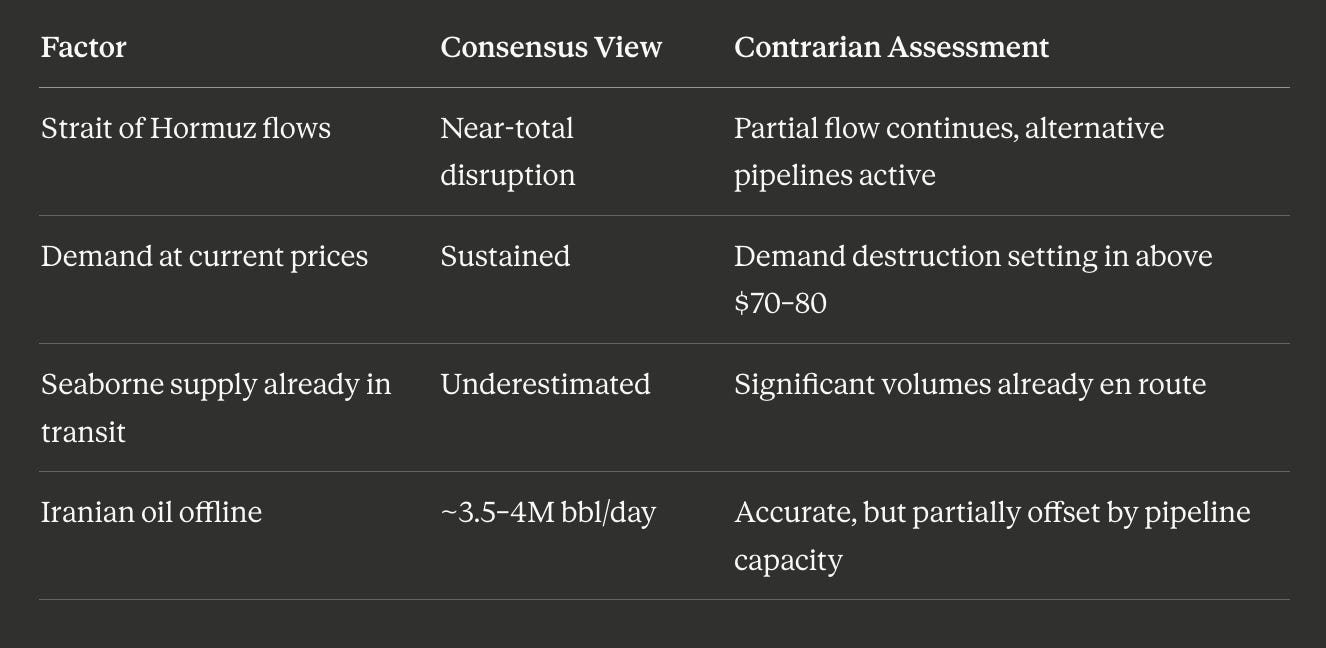
The consensus narrative on oil supply disruption is overstated, according to a detailed calculation of actual flows through the Strait of Hormuz. The trading community, guided by headline risk, is miscalculating the volume of oil still transiting the waterway, the quantity already seaborne, and the timeline before disruption becomes critical. At elevated prices, buyers are stepping back. Operations that depend on affordable energy simply cannot function at these levels, reducing demand even as supply tightens.
Additionally, Arab nations have alternative pipeline capacity running at maximum output. Iran itself is permitting certain vessels, particularly Indian-flagged ships, to pass. The strait is not at a full 12-million-barrel-per-day standstill.
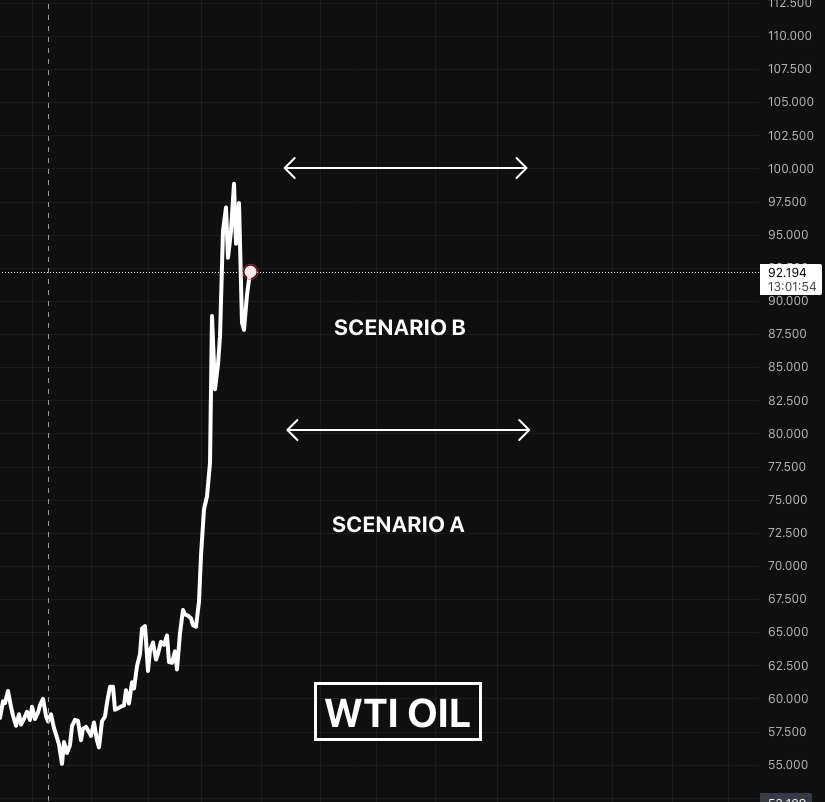
Scenario A: Amphibious Assault and Oil Relief
The first scenario involves a US amphibious operation targeting southern Iran and the Kharg Island oil export hub. Troop deployments and aircraft movements suggest this is not mere posturing. The logic: occupy the southern border, force Iran’s military focus away from the strait, and re-establish safe passage for commercial shipping.
Under this scenario, oil prices decline. The strait reopens. The only oil offline is Iran’s own production of roughly 3.5 to 4 million barrels per day, and even those fields could potentially be occupied and restarted. The nuclear option, once priced into betting markets at non-trivial odds, becomes effectively impossible with US troops on the ground. The conflict likely devolves into protracted but contained fighting, as Iran’s mountainous terrain and estimated military manpower make full occupation untenable.
Scenario B: Protracted Blockade and Demand Destruction
The second scenario sees no invasion. Iran maintains its chokehold on the strait, permitting only allied or neutral-flagged vessels. Oil sustains a premium in the 80 to 100 range. Demand destruction cascades through global manufacturing and services. GDP compresses. Central banks respond with rate hikes, compounding the economic damage.
If this goes on for another four weeks, you can almost be guaranteed there’s going to be, if not a recession, we’re going to get really close to that. GDP will get compressed.
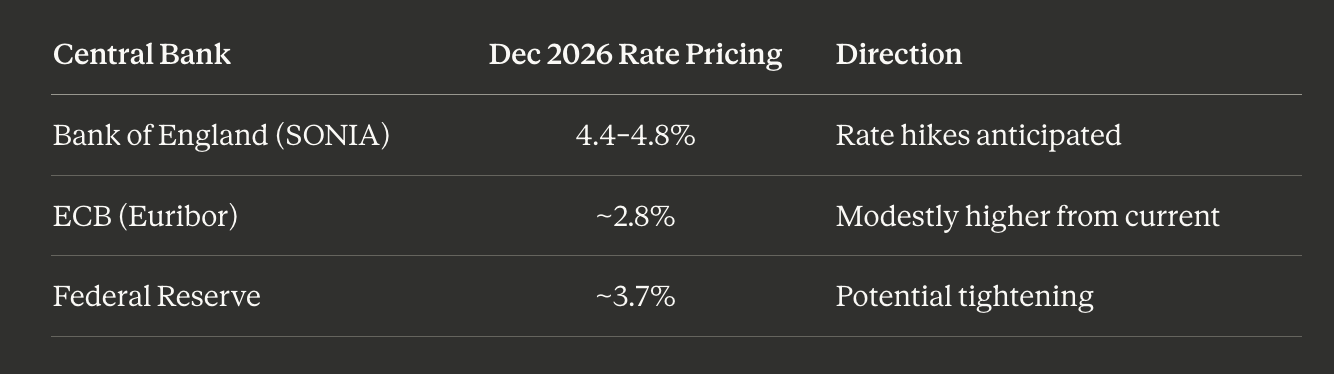
Under this path, the BOE is projected to hold rates approximately 78 basis points above the Fed by December 2026, with SONIA futures pricing BOE rates near 4.4 to 4.8%. Euribor futures suggest the ECB moves toward 2.8%. The Fed itself is being priced near 3.7%. All three central banks tilting toward hikes in a slowing economy is the textbook recipe for recession.
The Convergence: S&P 500’s Bearish Year-End and the Setup Beneath
Both Roads Lead to the Same Place
Here is the conviction that frames the entire year. Under Scenario A, the amphibious assault, oil retreats, rate hike expectations ease, and equities experience relief rallies. Under Scenario B, the protracted blockade, demand destruction deepens, central banks hike, and equities grind lower. And yet, remarkably, both paths converge on the same destination.
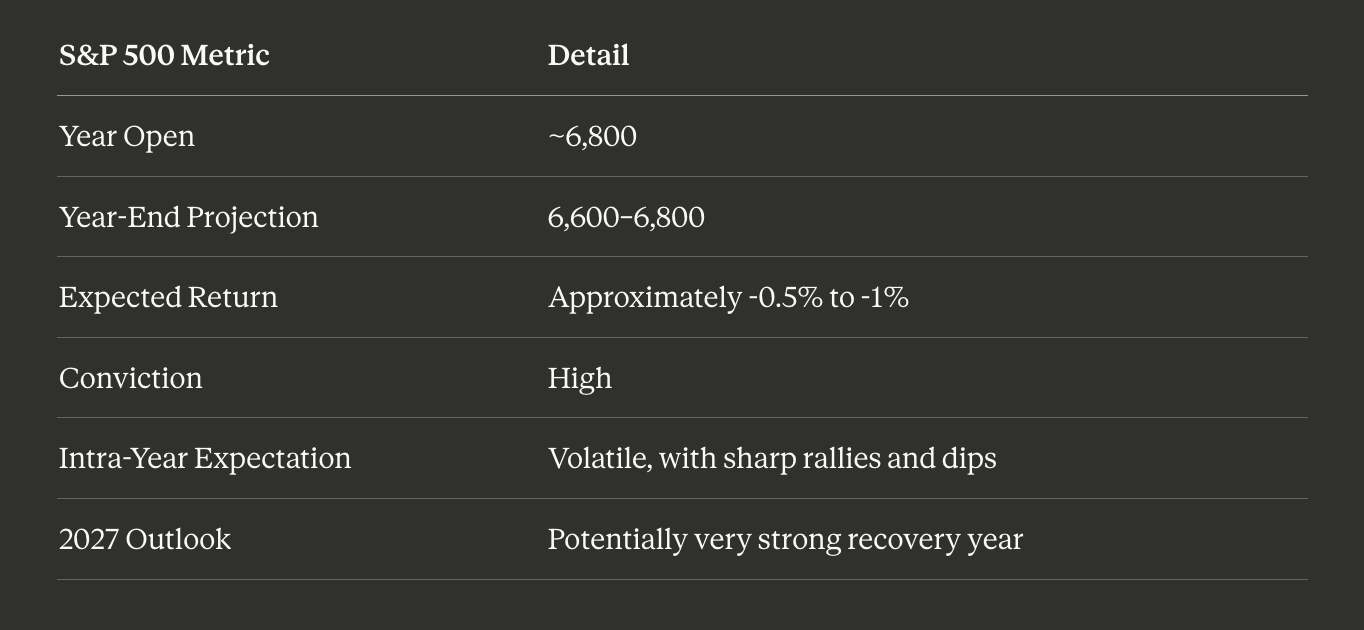
The S&P 500 opened the year near 6,800. By December, the projection is a close in the range of 6,600 to 6,800, representing a loss of roughly half a percent to one percent for the year. There will be dips. There will be heroic rallies. The index might even touch all-time highs along the way. But the year closes bearish.
I’ve got a high conviction on that and I will trade around that as well, even though I’m anticipating big rallies. I am not anticipating finishing strong this year, but the following year I think will be very amazing.
The reasoning extends beyond technicals. Liquidity is frozen on the sidelines. Capital allocators are not deploying into an environment defined by demand destruction, elevated energy costs, and geopolitical uncertainty. Investment decisions are built on demand projections, and when demand is being destroyed, the entire premise of forward returns collapses. You would not open a restaurant on an empty street.
Risk Barometers Confirm the Thesis
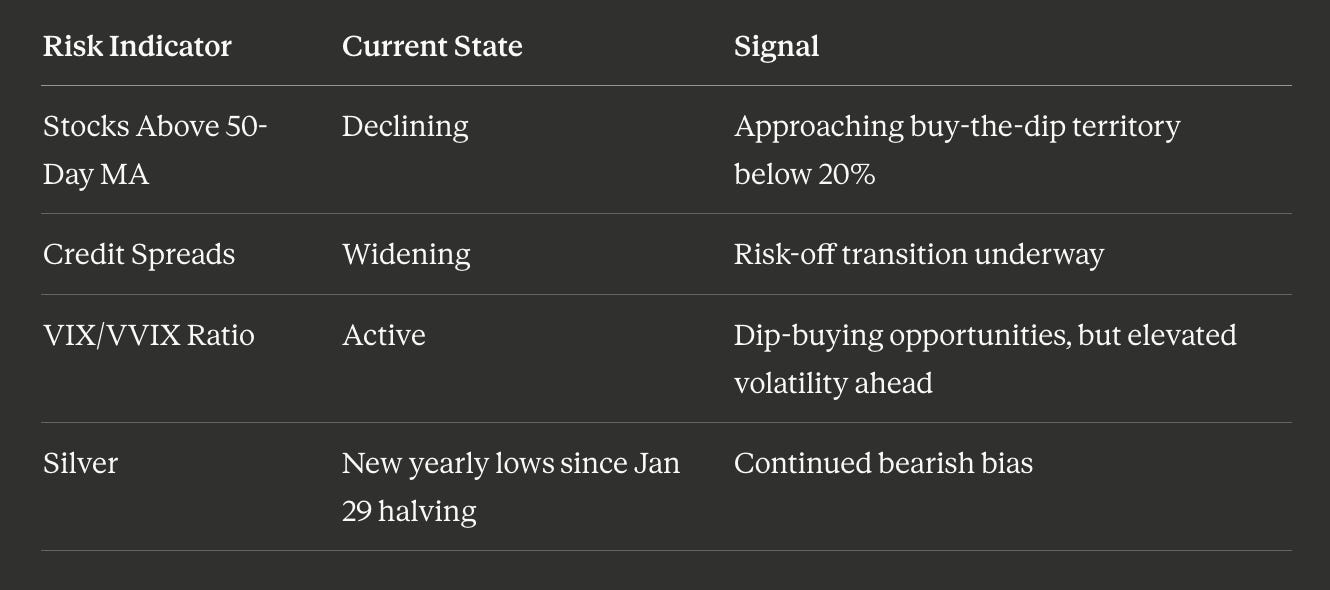
The percentage of S&P 500 stocks trading above their 50-day moving average is declining, and the actionable threshold sits below 20%, where aggressive long entries become attractive for short-term trades. Credit spreads, the difference between government and corporate bond yields, have been compressed for an extended period, signaling complacency. Now they are widening. Corporate bonds are being repriced as riskier, and when spreads widen, liquidity concentrates into safe havens. In this environment, that safe haven is the US dollar.
The intra-week VIX over VVIX ratio continues to flag opportunities for capturing dips, but the broader message is clear: volatility is here to stay. Meanwhile, silver has continued its decline since positions were halved on January 29th, finding new yearly lows with no compelling reason to expect a reversal. Gold holds no strong directional interest in either direction.
The Dow Jones would need to reclaim 47,200 on the six-week cycle to justify entertaining longs on indices. Until then, the stress remains embedded in the market, and it is not leaving.
Key Takeaways & Outlook
Market Macro & Equities
S&P 500 Target: Projected to close 2026 between 6,600 and 6,800. While this represents a bearish finish, expect high volatility defined by violent rallies and sharp drawdowns.
High-Conviction Drivers: The bearish outlook is cemented by a “perfect storm” of:
Real Yields: Rising toward 2%.
Credit: Widening spreads and central bank hawkishness (Fed, BOE, ECB).
Energy: Demand destruction caused by sustained high oil prices.
Geopolitical Context: Whether the Strait of Hormuz is reopened via US intervention or remains blockaded, the fundamental pressure on equities remains the same.
Execution & Psychology
The 10-Rep Protocol: Use a simulator to drill specific setups 10 times before live sessions. This transforms hesitation into reflex and dissolves psychological barriers.
The Signal: Treat the discomfort of repetitive drilling as evidence of neurological rewiring and skill acquisition.
Forward Outlook
2026 Sentiment: Stress is structural and persistent; the mandate is to manage risk and trade the cycles.
2027 Pivot: Potential for a significant shift as sidelined capital waits for “clear skies” to redeploy.
Disclaimer: Analysis only. Not financial advice. Conduct your own due diligence.
Trade Strong
Miad