

The Pre-Catalyst Rally: NASDAQ’s Final Push, Nvidia’s Earnings Risk, and Crypto’s Counter-Trend Bounce

📈 Executive Summary
The market is poised at a critical juncture, showing a striking resemblance to the 2021 “not-so-toppish” price action. While many are watching rising wedge structures as a potential top, the underlying mechanics suggest a different story: a potential liquidity grab followed by a powerful move higher. We are currently tracking a megaphone pattern on the ES (S&P 500 futures), which historically has acted as a deceptive topping signal. Often, these patterns break to the downside, take out liquidity, and then reverse violently to the upside. One past example saw a 760-point, 15% rally over three months following such a positioning unwind—a move we aim to capture going into 2026.

However, the immediate path forward is defined by one single event: Nvidia (NVDA) earnings on November 19, 2025.
Nvidia is unequivocally the main driver for the NASDAQ index; their charts are a “carbon copy” of each other. This catalyst is perfectly timed with a seasonally bullish window for stocks. From November 10th to the 19th, we anticipate “super bullishness” as stock buyback windows open and the market pushes to fill key upside inefficiencies. Specifically, we are targeting an open gap on NASDAQ at 26,000 and a flat open on the S&P 500 cash index’s monthly candle. Our short-term bias is firmly long to capture this move.
But traders must be prepared for a seismic shift. After November 19th, all bets are off. This earnings season has been defined by a “sell the news” dynamic, where even stellar earnings (like Microsoft’s) have resulted in sharp drops. We expect Nvidia to be the catalyst for a market-wide de-risking and profit-taking event, especially after seven consecutive bullish monthly candles since the April bottom. This could trigger the 7% to 10% correction we’ve been anticipating.
What does this mean for your portfolio? This correction is not the end of the bull run. As we saw in 2021, these 7-10% “positioning unwind” events are the “major, major bottom” where you should be prepared to reload your portfolios for the next major wave higher.
Beyond the indices, the market is a “Looney Tunes show” of divergence:
AI Stocks: Meta (META) is being punished for AI capex spending, while Nvidia (NVDA) is being rewarded for receiving that same money from Hyper-scaler companies like META boosting their spending. We view this as a short-term discrepancy.
Microsoft (MSFT): A massive historical parallel to 2011 is in play. MSFT is lagging NASDAQ (just as it did in 2011) and forming a potential double inside 2-month candle. If this confirms, we are looking at a potential “explosion to the upside” in January/February 2026.
Adobe (ADBE): This is our primary short setup, looking like “the new Enron.” Its business model is failing the AI revolution, and the chart is breaking down from a descending triangle, targeting $270.
Bitcoin (BTC): A major pullback signal has appeared on the quarterly chart, as price took out both the previous quarter’s low. The current rally is seen as a “counter-trend bounce” to resistance ($112k-$120k). The real structural bull market line-in-the-sand is the $74,000 higher low. Our macro “buy zone” is the stacked support area of $86k-$89k, with a stop loss below $74k.
Gold (XAU): Gold is in a bubble (Quarterly RSI 92+). Our strategy is to stay long the bubble until the previous quarter’s low breaks. A high-probability 7.1R swing trade is setting up with an entry at 3886, stop at 3819, and target at 4381.
Our immediate plan is to hold long positions (specifically QQQ calls) into the NASDAQ 26,000 target, but we will be aggressively taking profit and going risk-off around the November 19th Nvidia event, preparing to buy the dip that follows.
📈 NASDAQ and S&P 500: The 2021 Parallel
The “Not So Toppish” Structure
Looking at the indices, particularly NASDAQ, this price action is reminding me precisely of 2021. The market feels toppish, but it’s not. We are in a rising wedge structure where the market is defending every trend line as it climbs. At some point, a catalyst will cause a “massive positioning unwind,” leading to a 10% correction. I’m not saying this happens right now, but we are reaching the point where you must be on the lookout for it.
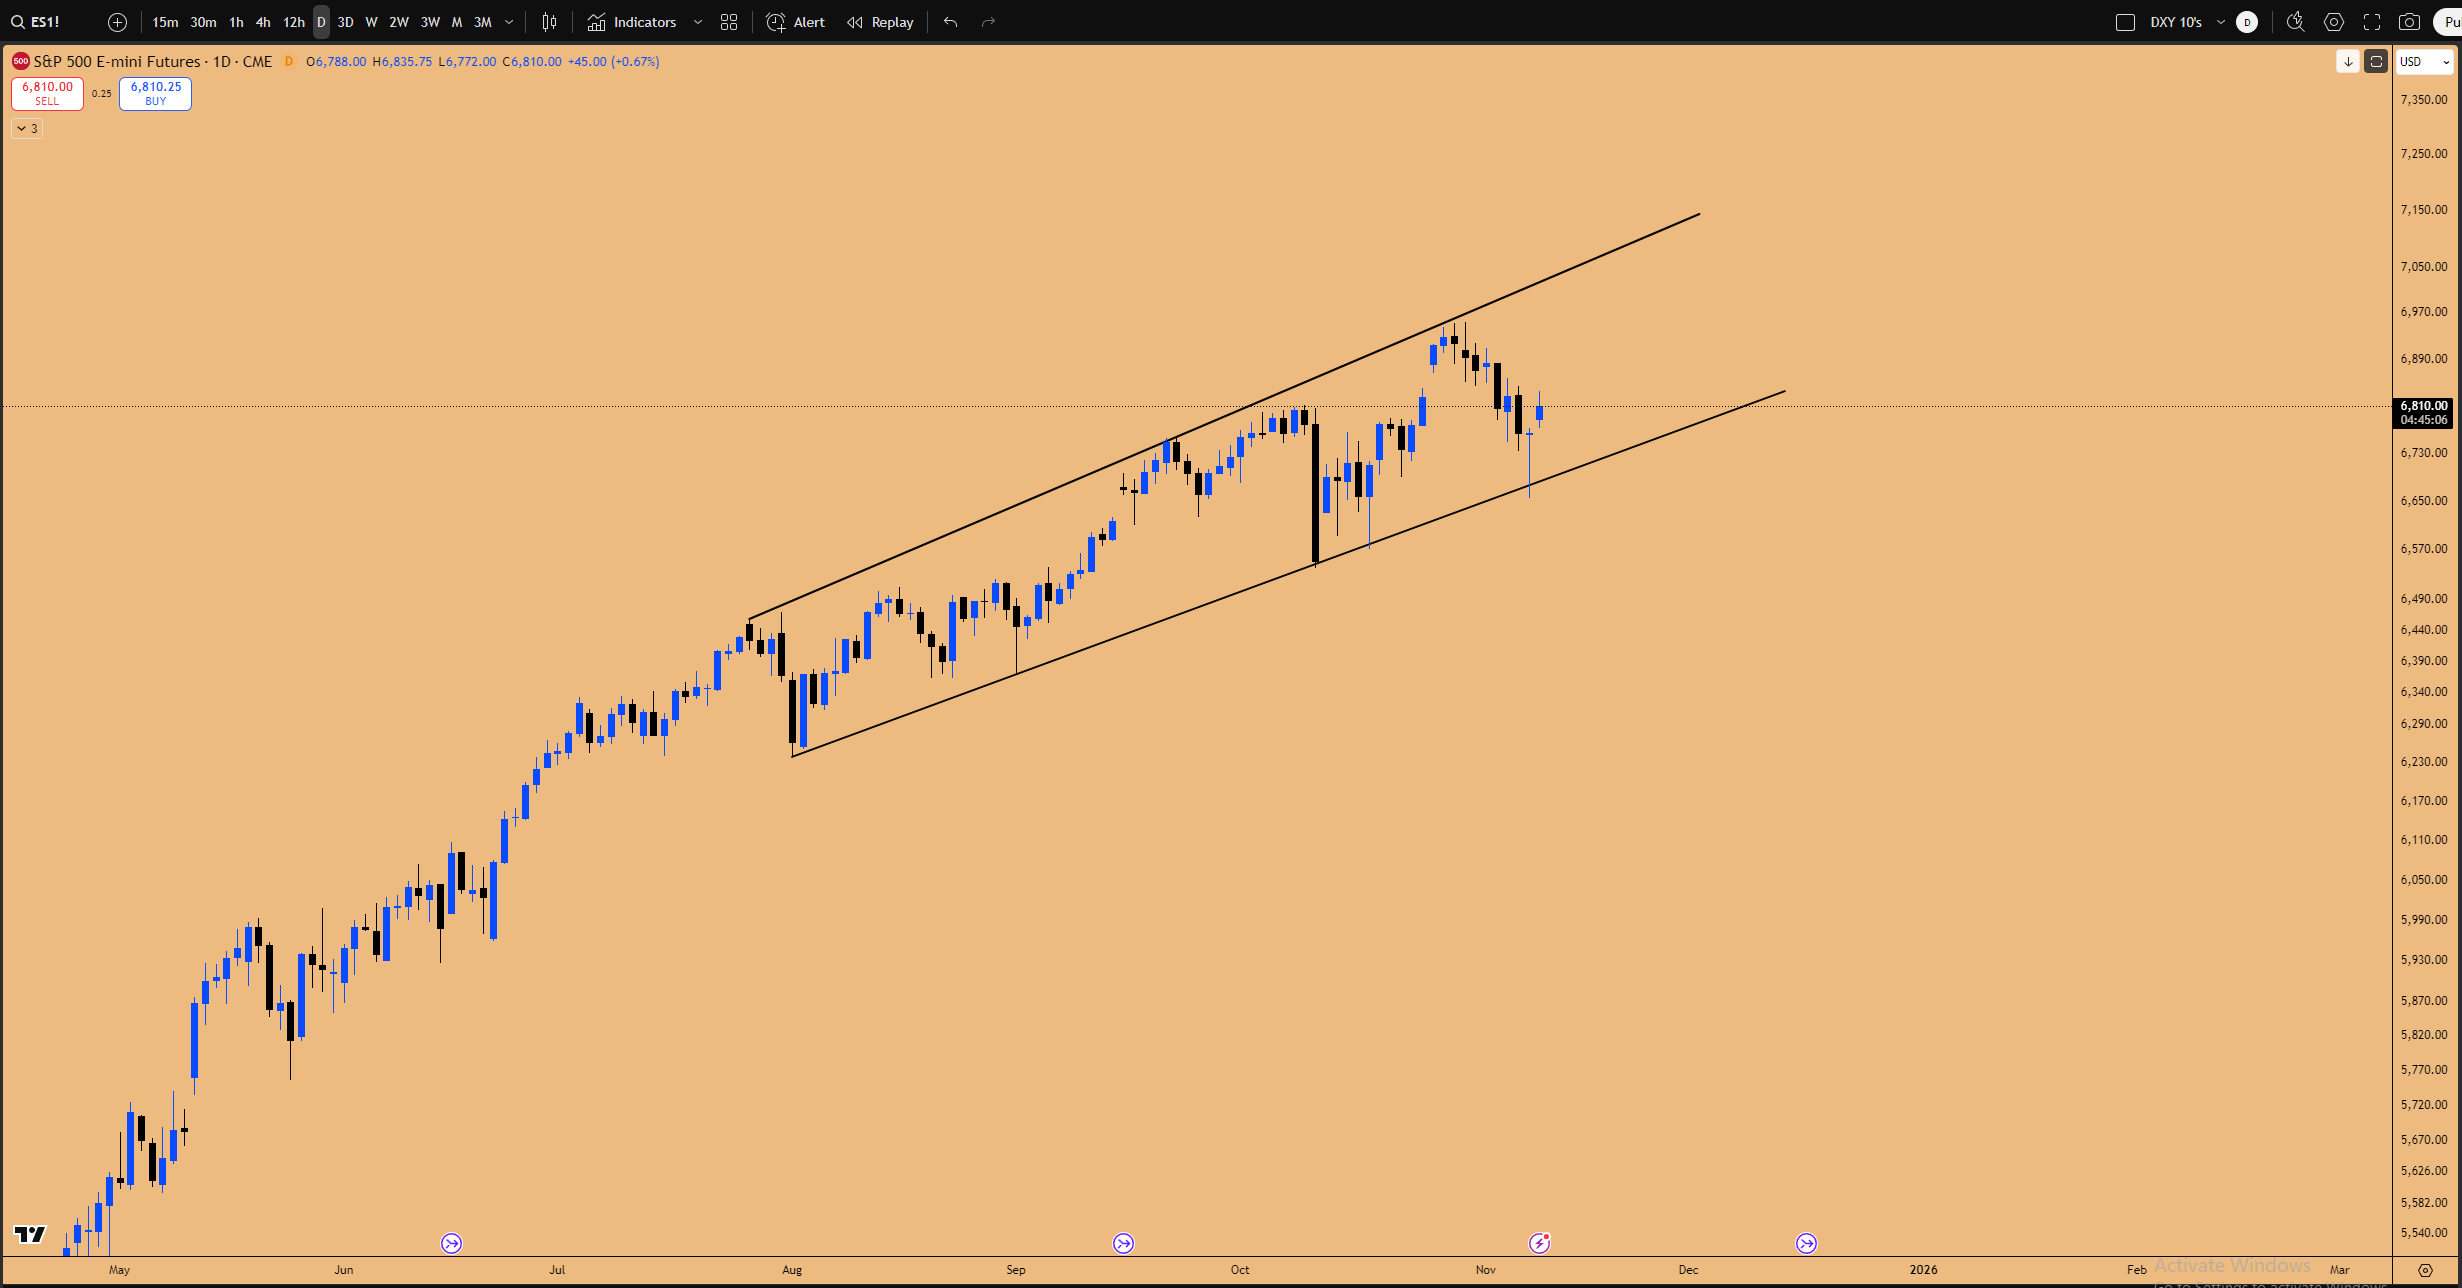
Figure 1: Megaphone/Rising Wedge Pattern in formation for ES
The Megaphone Pattern Deception (ES)
This structure is also present on the ES (S&P 500) futures contracts in the form of a megaphone pattern. Most people will see this as a top signal, expecting a breakdown. However, what I’ve seen happen “multiple, multiple times” is the opposite.
The market will come down and break the bottom trend line, but it’s a trap. It will start taking out all the liquidity pools sitting below, form a bottom, and then “go all the way up top and take out the upside liquidity very swiftly.”
Historical Parallel: The Megaphone Trap
I’ve seen this exact pattern in the past. The market looks like it’s topping or crashing, and VIX spikes as the bottom trend line gives out. You get a sharp positioning unwind.
But then, what happens?* The market never comes back to that bottom. It just goes on a “ripper.” In one past instance, after this unwind, the market went up another 760 points (a 15% rally) over the next 3 months.
This is the exact type of move I want to be capturing going into 2026.
The 2021 Playbook: Reloading the Dip
In 2021, we saw these rising wedges “left and right.” A catalyst would hit, and the market would correct 7% to 8%. People would panic, thinking it was the top.
But it wasn’t. The market was “essentially just grabbing liquidity, forming a bottom, and just running it back up turbo, making a new all-time high.”
Anytime you see a trend line breakdown from one of these wedges, it may feel like a top, but the resulting 7-10% correction ends up being a major, major bottom. That is where you need to reload your portfolios and put your profits back to work to ride the next bull wave higher.
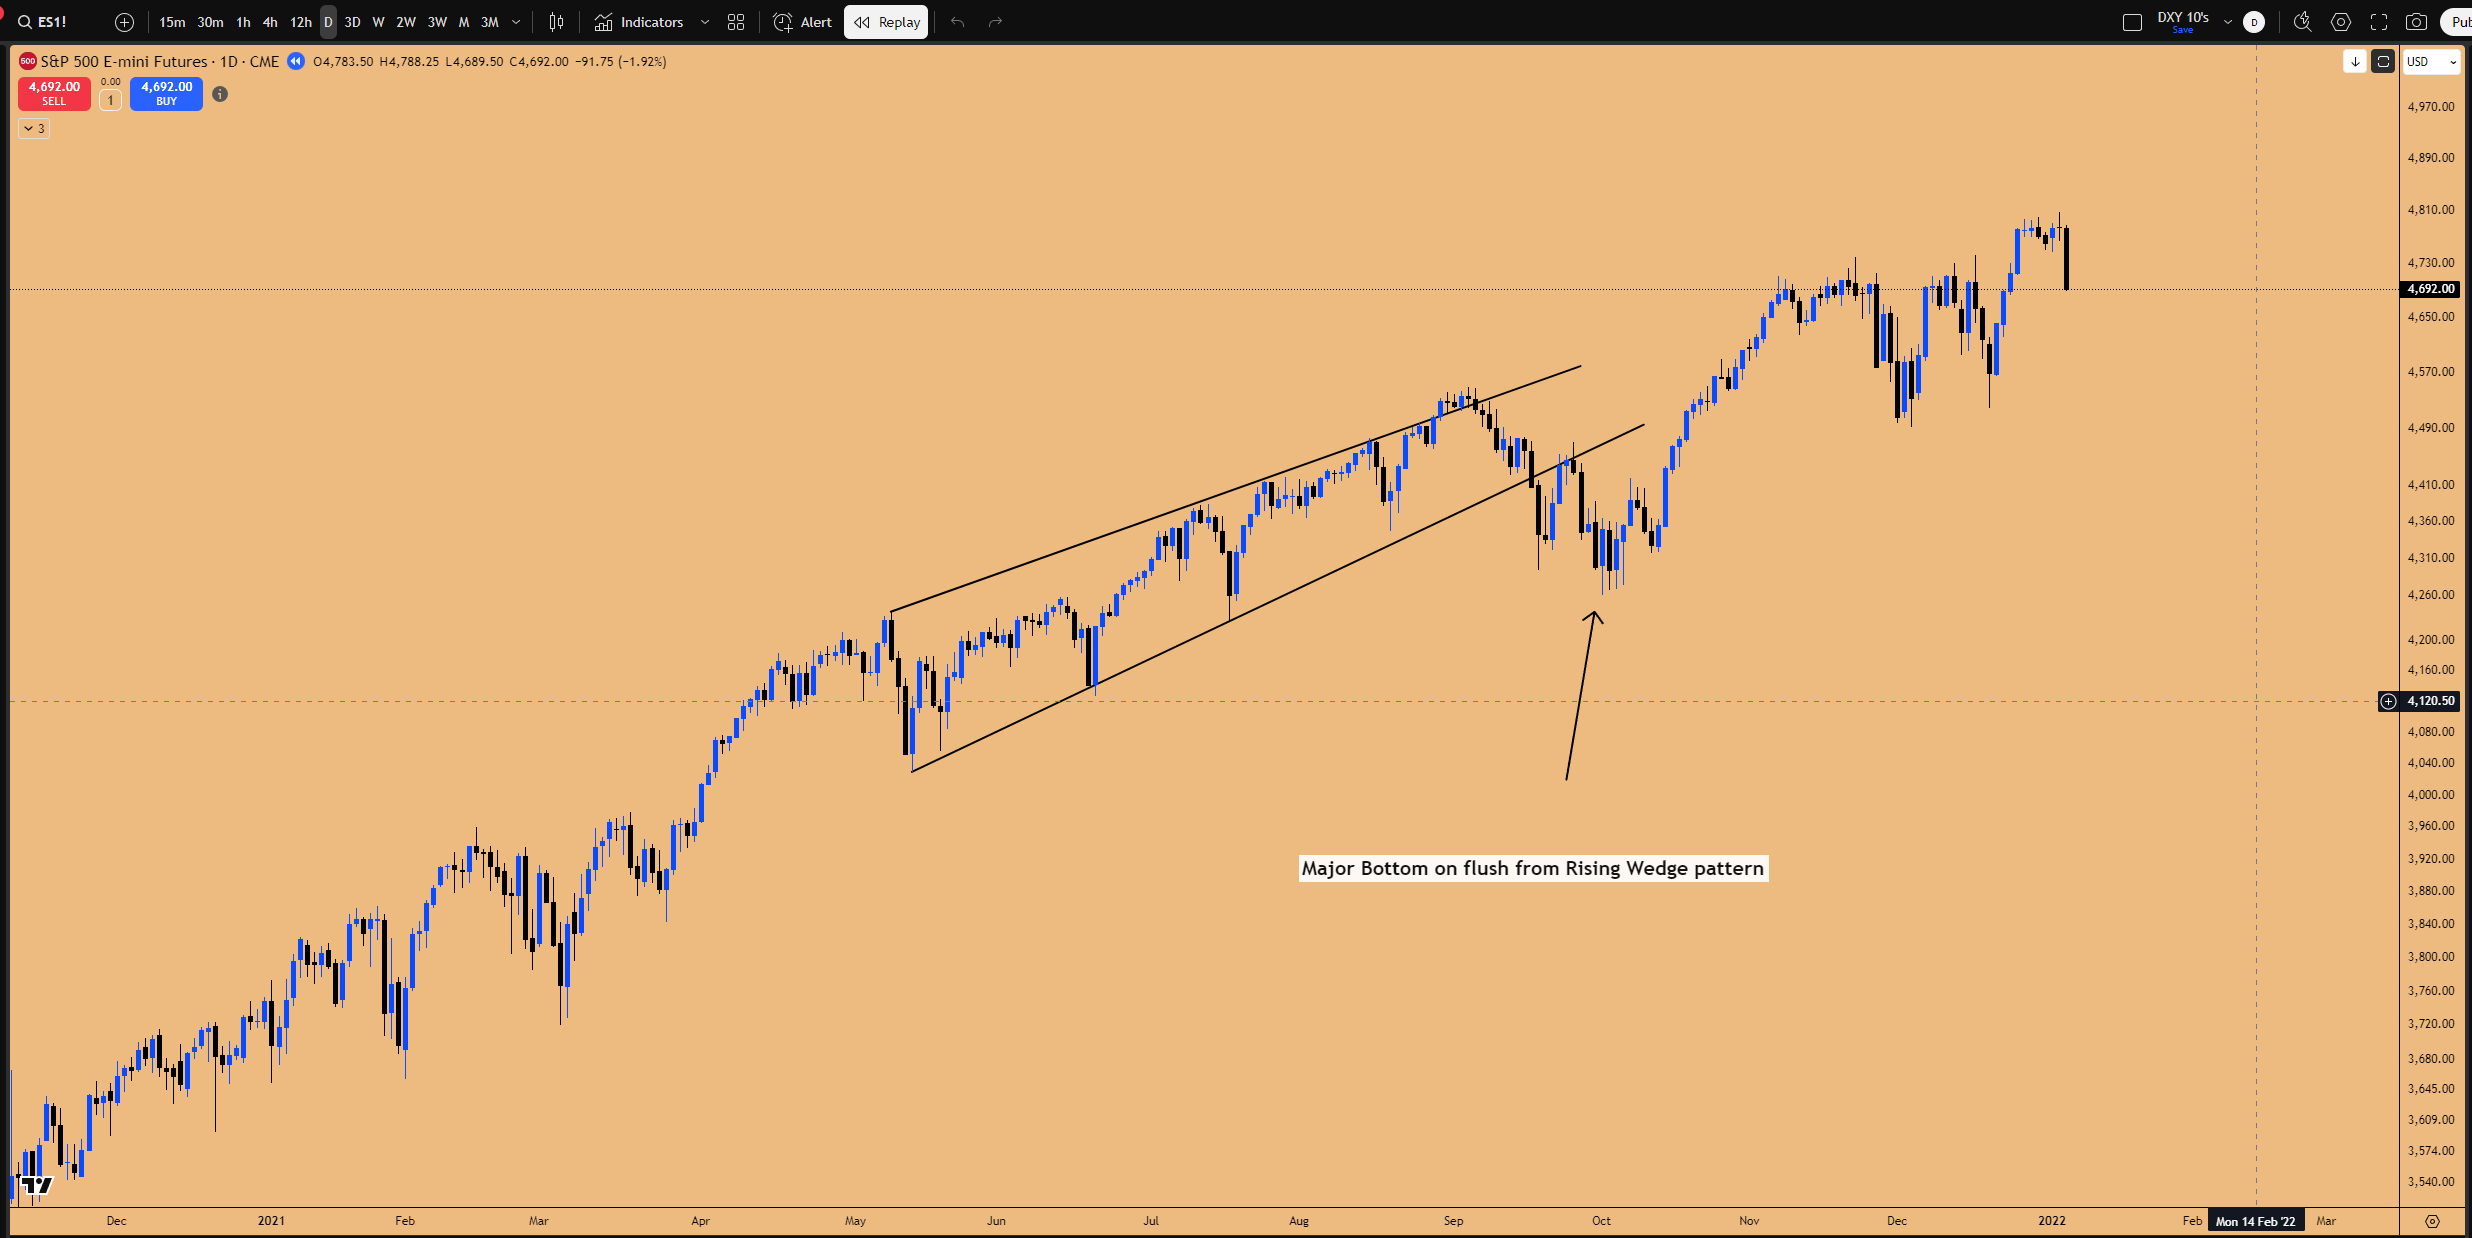
Figure 2: 2021 “Replay”, Megaphone/Rising wedge pattern flushes down, creates a major bottom and rallies back up
🧠 The Nvidia Catalyst: Linchpin for the Entire Market
Nvidia as the Primary Market Driver
The main driver for the NASDAQ index right now is Nvidia (NVDA). If you compare the NVDA chart with the QQQ (NASDAQ ETF), they are a “carbon copy.”
The top on October 29th in QQQ was the top in Nvidia.
The subsequent drop and lower high in QQQ was the drop and lower high in Nvidia.
When Nvidia flushed, NASDAQ flushed with it.
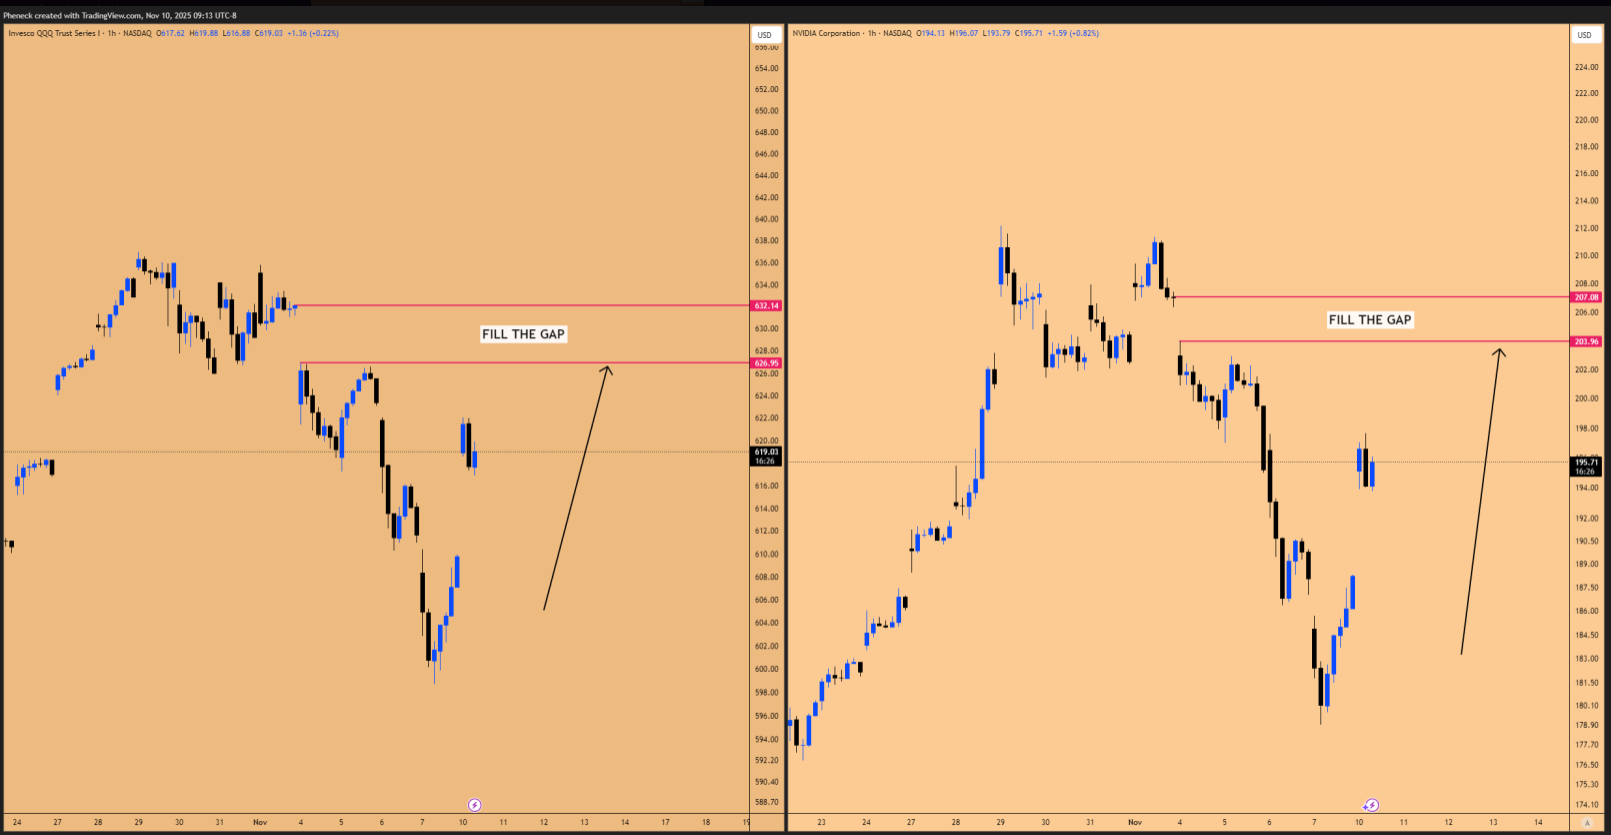
Figure 3: QQQ vs NVDA, open gap is the magnet for Price
The Short-Term Bullish Case (Pre-Earnings)
We know NASDAQ has inefficiencies overhead. There is a clear open gap on the chart. Furthermore, the current monthly candle has no upper wick, and that wick is going to get created.
This will happen as Nvidia pushes higher into its earnings announcement on November 19, 2025.
WARNING: All Bets Are Off After November 19th
You have until that date for the market to recover and make a new high. But once that high is in, all bets are off. I believe you should not be going long in the market after Nvidia reports.
This earning season, the theme has been consistent: it doesn’t matter how good the earnings are; the market just generally just collapses after. I know Nvidia is going to “knock it out of the park,” but the market is just using this as an excuse to de-risk and take profits.
Profit Taking and Seasonality
This profit-taking catalyst makes sense. Since the April bottom, we have printed seven consecutive monthly bullish candles. That is highly unusual and warrants profit-taking. Market participants will look to “shuffle those profits into other assets which have not run quite a bit.”
If Nvidia takes a hit post-earnings and posts a down month in December, NASDAQ will come down along with it.
The seasonality lines up perfectly for this thesis:
Bullish Window (Nov 10-19): The stock buyback window opens now, after the first week of November. This 10-day window leading into the NVDA catalyst is where I expect “super bullishness.”
Dicey Window (Post-Nov 19): After the 19th, it’s “somewhat dicey.” We need to see the market’s reaction.
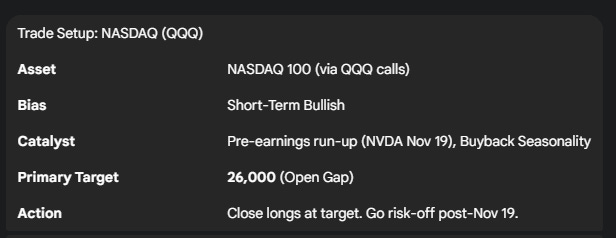
Actionable Trade: Long NASDAQ to 26,000
Based on these factors, our immediate trade plan is clear. We are holding long positions (QQQ option calls) to target the key inefficiencies overhead.
Primary Target: The open gap on NASDAQ at 26,000.
Profit Take: I will personally be closing my longs once this 26,000 gap is filled.
Risk: I am not going to hold my breath for the market to take out the absolute all-time high, even though some patterns (like the inside 3-day candle failure) suggest it could. The 26,000 gap is the high-probability target.
Confluence: The S&P 500 cash index also has a flat open on the monthly candle, which is a key level to watch for profit-taking.
🤖 AI Stocks: A “Looney Tunes Show” of Divergence
The Capex Discrepancy: Meta vs. Nvidia
This earnings season has been “absurd.” Take the AI capex spending story:
Meta (META) posted stellar numbers but had one discrepancy related to AI capex spending. The market suffered a massive gap down, punishing the company for spending on infrastructure.
Nvidia (NVDA) is the company receiving all that capex money for its GPUs. The market is set to reward Nvidia for its massive revenue.
You’re punishing one company for spending and rewarding another for receiving the same money. It doesn’t make sense. Eventually, both will benefit—Meta from consumer demand and Nvidia from hardware demand. This is a short-term discrepancy.
DEEP DIVE: Microsoft’s 2011 Historical Parallel
The most fascinating chart in this sector is Microsoft (MSFT). It gapped down after stellar earnings, which I believe was spooked by an OpenAI podcast, not MSFT fundamentals (Azure AI revenue is accelerating).
MSFT is currently in a macro consolidation, printing an inside 2-month candle. We still have time left in this candle, but this is setting up a massive historical parallel.
The 2011 MSFT Playbook
I looked back, and Microsoft has only printed a double inside 2-month candle once in its entire history.
When? It happened back in 2011.
The Setup: The consolidation also started in July (just like our 2025 consolidation). The second inside 2-month candle also opened in November (just like our current 2025 candle).
The Correlation: At that time, NASDAQ (NDX) was already sitting at new all-time highs, while Microsoft was lagging below its highs. This is exactly what is happening right now—NASDAQ is trading above the July 2025 high, while Microsoft is trading below it.
The Result: What happened in the next 2-month candle (January 2011)? Microsoft “goes berserk. It goes like full steroidal up” and tagged its all-time high to catch up with NASDAQ.
Thesis: If this double inside 2-month candle confirms, we should not be looking at November/December for the big move. All eyes should be on January and February 2026 for a potential “explosion to the upside” as Microsoft makes up all this “catch up” it has to do.
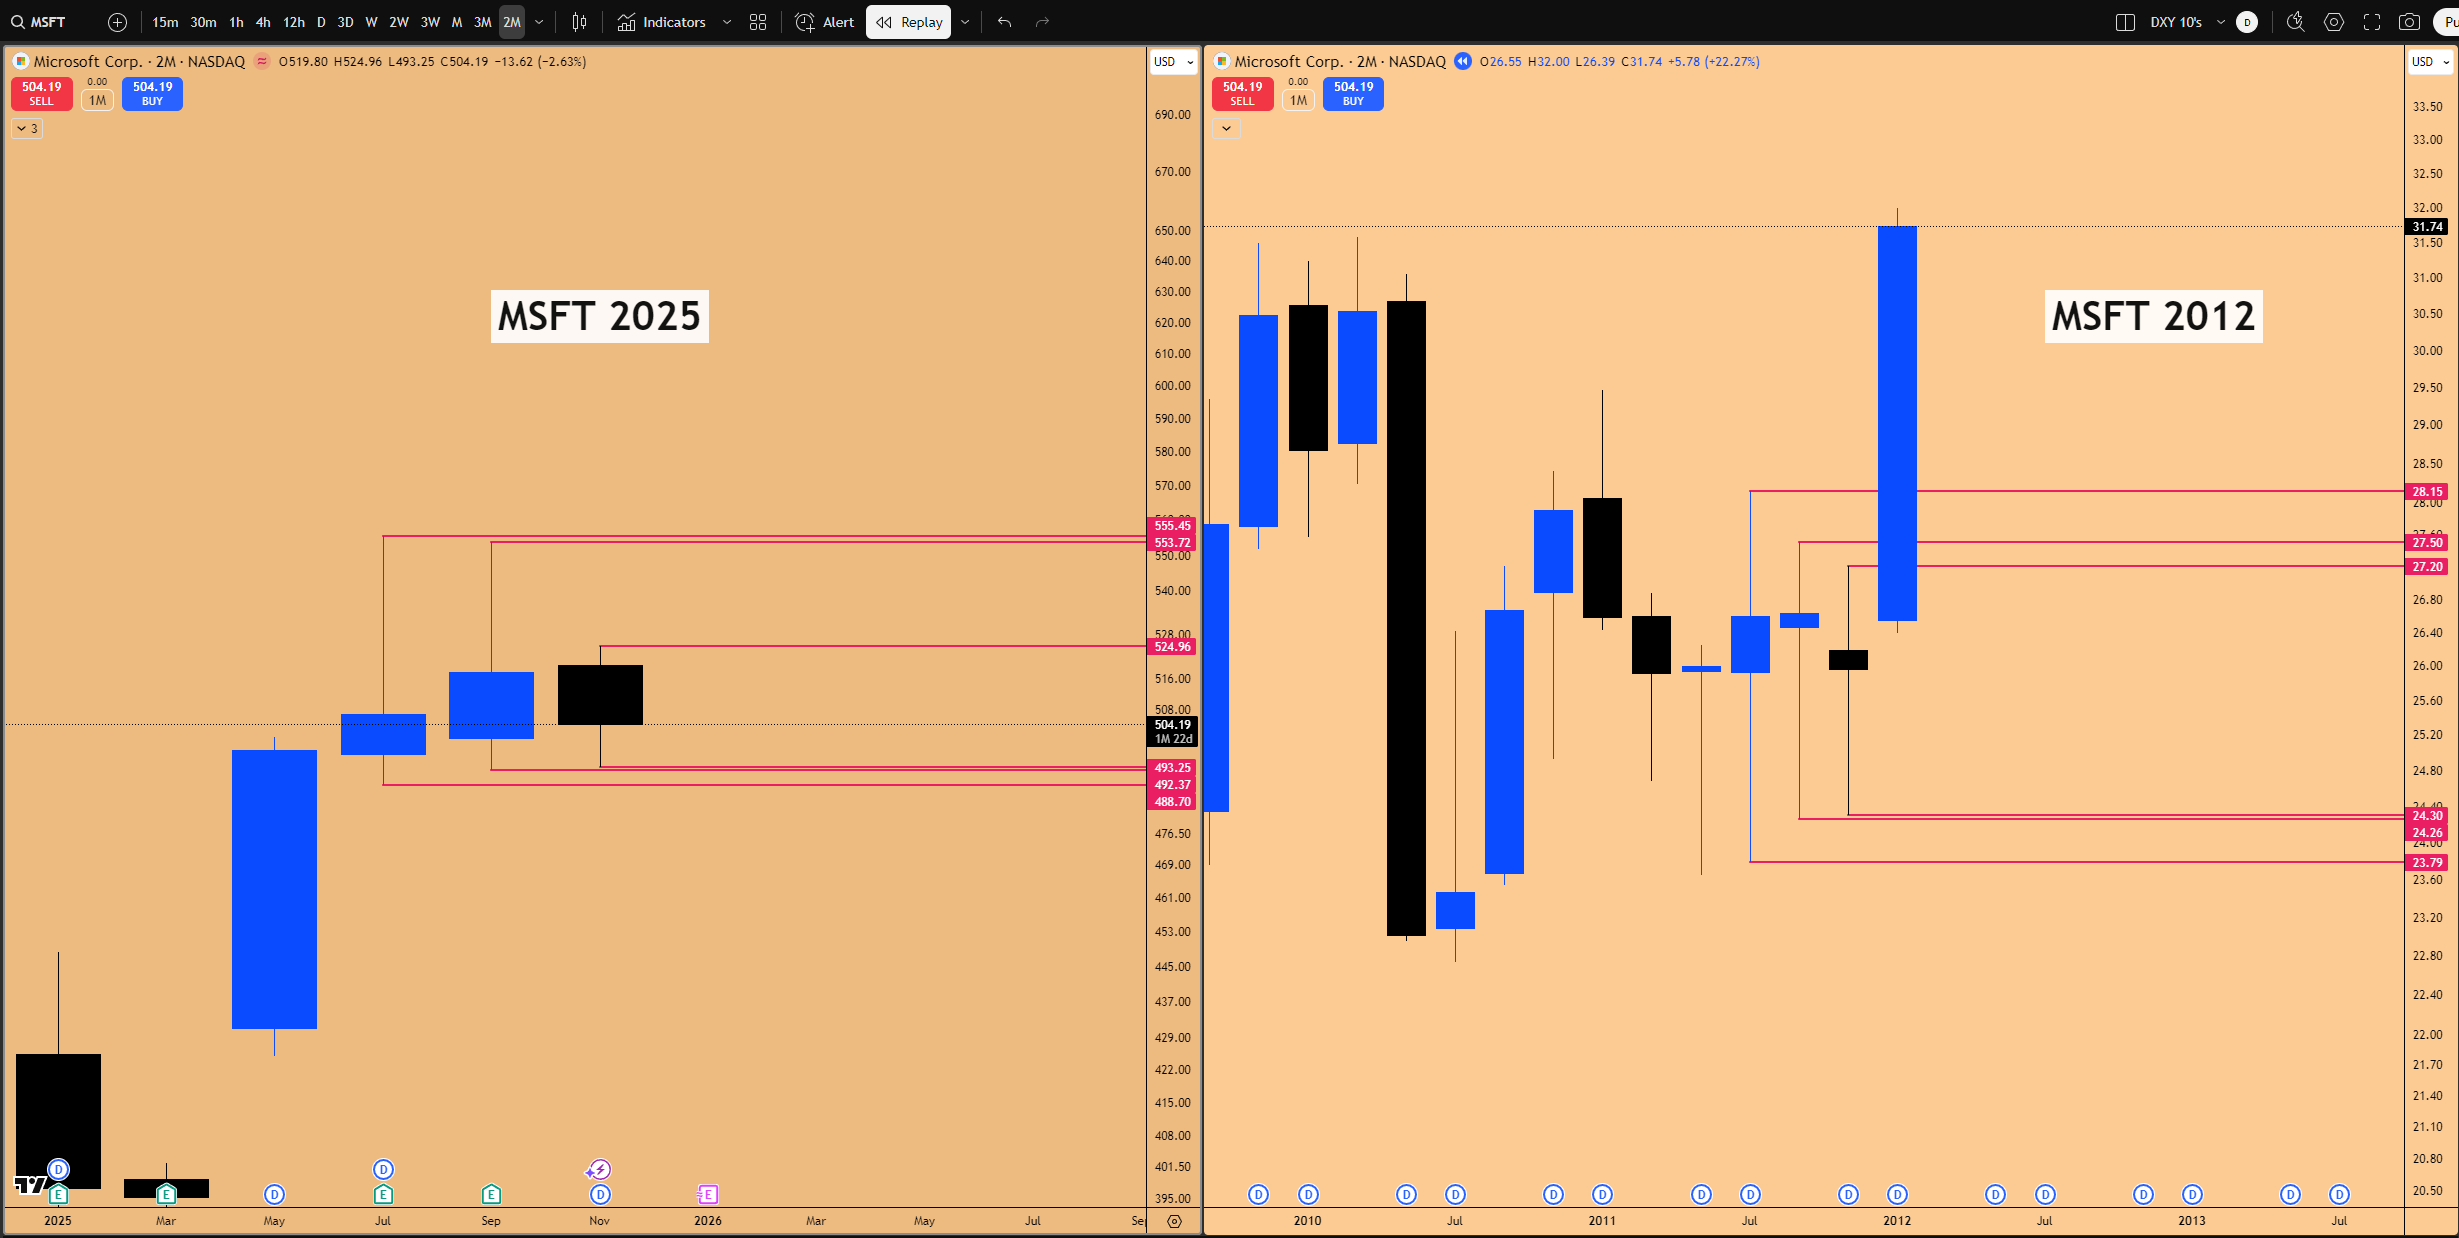
Figure 4: MSFT in 2025 vs MSFT in 2012, Double Inside 2-Month Candle in formation
Other Key Stock Setups (NFLX, ORCL)
Netflix (NFLX): This chart is showing an inside 2-month candle failure (lows taken and rejecting). The 1064 SR level is very strong support. This may consolidate into an inside 6-month candle, which warrants one down-candle, but the next 6-month candle in 2026 should be a “massive bullish engulfing” as the company is growing well.
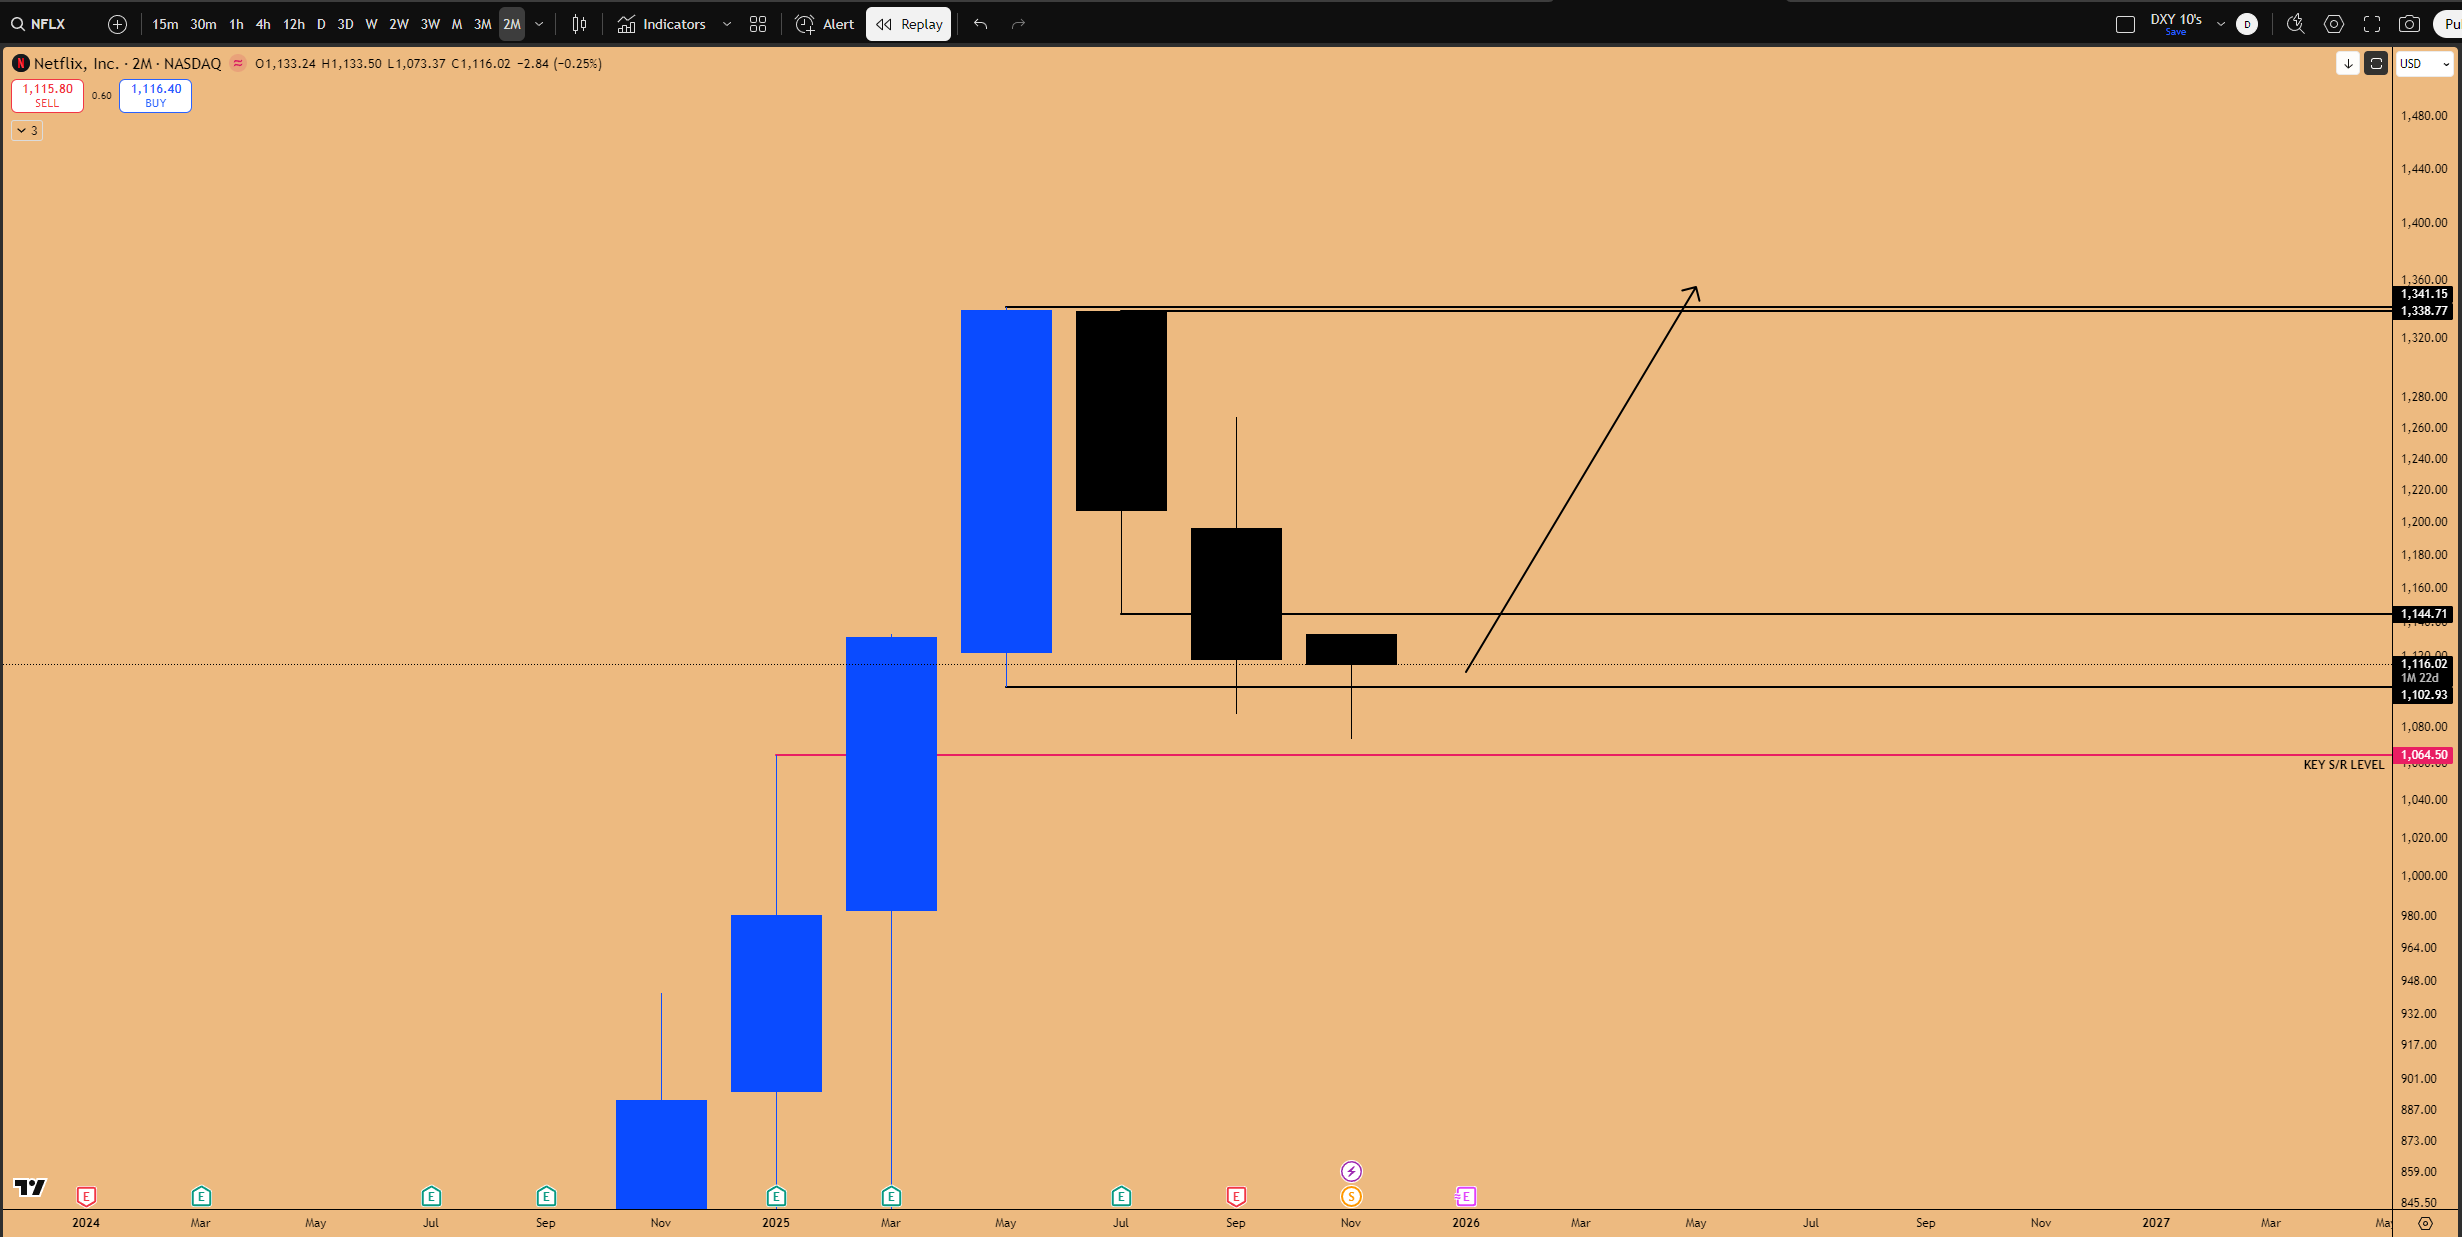
Figure 5: NFLX Inside 2-Month candle Failure Pattern in Play
Oracle (ORCL): Oracle has finally closed its massive open gap and is trading within a huge monthly support zone. It’s also printing a double inside monthly candle where the lows were taken. This is a very high-probability bottoming pattern. Oracle’s significant drawdown has been one of the reasons NASDAQ has been weak, so a bounce here will help lift the market.
₿ Bitcoin: Macro Bearish Signal vs. Short-Term Bounce
The Quarterly Chart Warning (MACRO BEARISH)
We must perform a top-down analysis on Bitcoin, and the quarterly chart is sending a warning.
First, the market took out the previous quarter’s high.
Then, it reversed and took out the previous quarter’s low.
By itself, this is not good. I cannot be long the market on a macro basis when this happens. This is a classic bear market signal. When this happens, the general trend for the coming quarter is to the downside.
The Current Counter-Trend Rally (MICRO BULLISH)
The current bounce we are seeing (triggered by an inside daily candle failure) should be treated as a “counter-trend bounce.” This is a draw down phase, and we are simply forming a lower high in comparison to the macro top.
The draw on liquidity is at 107k and potentially the untapped liquidity at 111,592k.
To turn bullish, Bitcoin would need to make a new all-time high, which is unlikely given the quarterly signal.
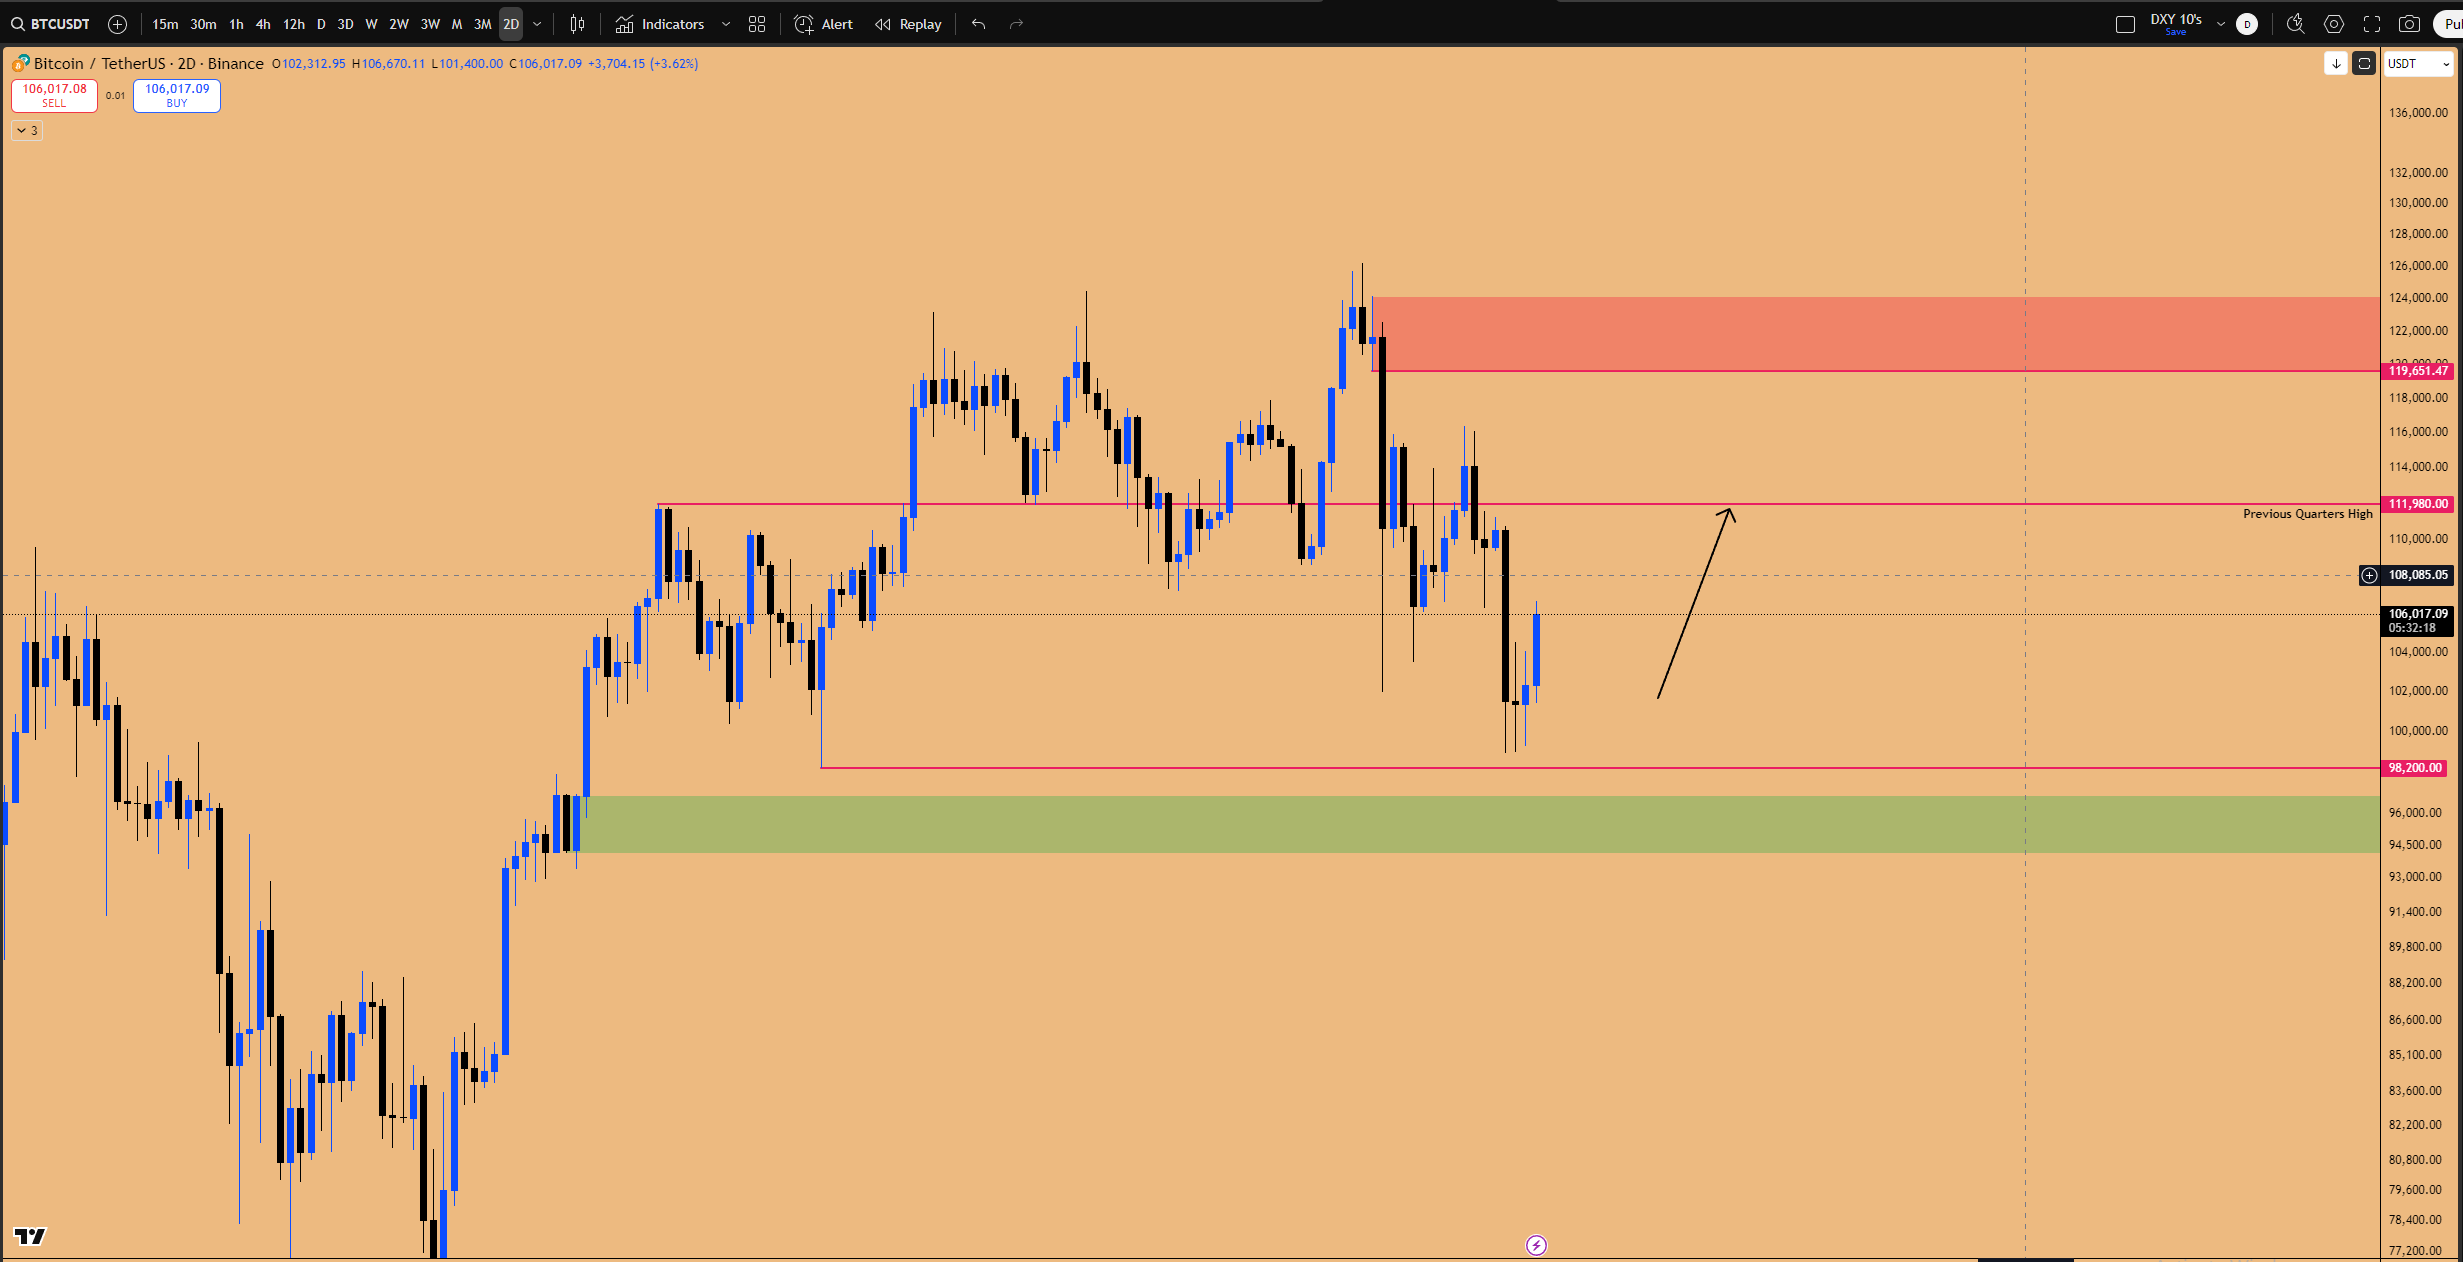
Figure 6: BTCUSD’s Counter Trend Rally to 112k S/R level
The Bull Market’s Last Stand: $74,000
I am still bullish on Bitcoin over the next 2-3 years, but we must expect a macro correction. My line in the sand is $74,000. We cannot go below this level. If we do, a 70-80% correction is on the table.
Why $74k? This is about the higher low structure of the entire bull market:
Low: $30,000
Higher Low 1: $49,000
Higher Low 2: $74,500
Next Higher Low (Anticipated): $86,000 - $88,000
If the $74,500 low breaks, the entire bull market structure is breached. This is exactly what happened in the last bear market: the breach of the $39,000 higher low triggered the entire collapse.
The “Stacked Support” Macro Buy Zone
This $74k level is also critical when looking at the IBIT (Bitcoin ETF) chart.
The 3-month chart confirmed a bullish order block.
Within that 3-month block is a monthly bullish order block.
Within that monthly block is a weekly gap.
This “highest hierarchy of support zones” all converges in the $86,000 to $89,000 range. This is the low-risk, macro spot long entry.
Actionable Bitcoin Setups
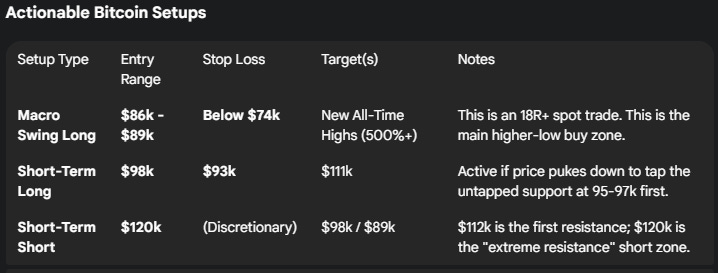
Current Bias: I expect Bitcoin to follow NASDAQ higher in the short term, pushing to the $112k resistance level as part of this counter-trend bounce.
🌍 Global Indices and Commodities (Nikkei, Gold, DXY)
Nikkei: The Overstretched Rally
The Nikkei has been in its own land, outperforming NASDAQ (which often happens in bubble-like phases, similar to 2021). It recently had a positioning unwind, perfectly filling an open gap on the weekly chart and rejecting.
Short-Term: An inside daily candle failure triggered on Friday (which is also why NASDAQ rallied). The draw on liquidity is to the highs at 51,350. I expect it to make a new all-time high, possibly this week.
Long-Term: This rally is very overstretched. The Nikkei has printed seven consecutive bullish monthly candles. This is “somewhat absurd.” It warrants at least one or two downside candles. I believe it will top out after making this next all-time high.
Gold: How to Trade a Bubble
A viewer asked about Gold’s one-year time frame. My approach is to take it quarter-over-quarter. As long as the previous quarter’s low (PQL) is defended, the trend is up.
But let’s be clear: Gold is in a bubble. The quarterly RSI is hitting 92-93. This is a bubble. AI is not a bubble yet; its RSI isn’t even touching 80-90.
How do you trade a bubble? You stay long. It is dangerous to short bubbles. They can keep inflating and go up another 100% (like the 930 to 1800 move) before they pop. The only signal that the bubble has popped is a confirmed breach of the previous quarter’s low.
Gold: Actionable Swing Trade Setup
Gold’s volatility has been crushed during this recent consolidation (printing an inside weekly candle), which is very bullish as it signals net buying. We are now looking at a potential inside three-week candle formation.
This gives us a very high-probability setup:
Thesis: Wait for the market to sweep the equal lows of the inside weekly candle.
Entry: Place a limit order at 3886.
Invalidation (Stop): The previous month’s low at 3819.
Target: The all-time high at 4381.
This is a 7.1 Risk/Reward swing trade. If we get stopped out below 3819, the entire rally from the 2023 bottom is likely in trouble.
DXY (Dollar Index): A Bullish Shift
The DXY has seen a shift in market structure to the bull side by taking out the previous quarter’s high. This is a V-shaped reversal.
Upside Target: Inefficiencies are open up to 103.
Support: If it pulls back, 98.635 - 98.694 is a key SR level to long.
Key Level: There is also a flat open below the market. If it comes down and fills that, it would be an “uber long DXY trade” (and a short on Euro/Pound).
Current Stance: Do nothing. It’s in the middle of nowhere and could pull back before resuming upside.
🎯 Final Stock Setups: The Longs and The “New Enron”
Long: Meta (META)
Meta is high on my radar. It is currently testing a 3-week bullish order block and just closed its open gap. This is the “massive long” opportunity. My own option calls are down 60%, but I am holding them (long expiration) because I know it will recover and eventually make new all-time highs, likely hitting $1,000 in 2026.
As I mentioned, Meta’s chart pattern is identical to Bitcoin’s macro setup. Meta is already sitting in the deep-buy zone that we are waiting for Bitcoin to pull back to. You just have to “pick your horse.”
Long: Alibaba (BABA)
Alibaba is confirming a double inside 3-weekly candle. It is going to expand to all-time highs. The Chinese are “dominating in the AI space” and catching up to the US, with Alibaba leading the charge.
Long: Palantir (PLTR)
PLTR is in a rising wedge (a bubble in formation). It defended the trend line last week and should make another tag higher to fill its earnings gap and make a new all-time high. You are supposed to be long bubbles, not short them.
SHORT: Adobe (ADBE)
This is the primary short setup. Short this thing into the ground.
Thesis: Adobe is “the new Enron.” Its business model is not set up for the AI revolution, and it is losing market share.
Pattern: It is breaking down from a massive descending triangle.
Target: My target is $270 (currently at $326). It will eventually go for the open gap and lows. If you want to short something as the market turns, Adobe is the one.
Watchlist: Tesla (TSLA) & Google (GOOG)
Tesla (TSLA): I’m not touching this. It’s printing an inside 3-week candle failure (bearish), and I expect it to come down and fill the open gap at 396-402.
Google (GOOG): This has been a “monster truck” but has seven consecutive bullish 3-week candles. It is overdue for one bearish 3-week candle, likely triggered by the post-Nvidia positioning unwind.
🔑 Key Takeaways and Outlook
To summarize, our market outlook is a two-phased plan:
Phase 1 (Now – Nov 19): We remain long and bullish. The market is being driven higher by seasonality (buybacks) and key technical inefficiencies. Our primary trade is long QQQ (NASDAQ) calls with a firm profit target at the 26,000 open gap.
Phase 2 (Post-Nov 19): We go risk-off. The Nvidia earnings event is the likely catalyst for a market-wide “positioning unwind.” We expect a 10-12% correction as profits are taken after seven straight green months.
The most important takeaway is that this 10-12% dip is not the top. It is the primary buying opportunity—the “major major bottom” we’ve seen in past parallels like 2021. This is when you should have dry powder ready to “buy the dip with both hands” and ride the next wave higher.
Be ready to trade the key setups: the Gold long at 3886, the Adobe short to 270, and watch for the Microsoft 2011 parallel to play out in January.
What’s your take on these setups? Share in the comments—let’s discuss strategies. Subscribe for more market breakdowns!
Disclaimer: This isn’t financial advice – just market musings from the charts. Always do your own research.
If you enjoyed this deep dive, please share it with fellow traders!