

The Recession That Never Was: NFP Revisions, Yield Curve Signals, and the Yen Pairs Trade of a Generation

Executive Summary
Something doesn’t add up and the bond market knows it.
Non-Farm Payrolls release was pushed back by yet another government shutdown, this isn’t just another jobs number. Usually released on the first Friday of the month, this data has been delayed and compressed, meaning the price moves traders have been anticipating since early February are coiled and ready to spring. Analysts are expecting heavy downward revisions the kind that, historically, have preceded every major recession dating back to 1979. The Bureau of Labor Statistics has either been challenged by deeply flawed data collection methodologies or something far more troubling, and the Federal Reserve has been making critical monetary policy decisions on what may amount to misinformation. These are the narratives.
Yet here’s the central paradox that has confounded even the most seasoned macro strategists: where is the recession? The yield curve went negative and positive again, a sequence that preceded recessions . The job revisions same terrifying stats, even the Sahm rule was activated. Every data point confirmed it, except GDP. The lower-income segment of America was already living through a genuine contraction while the middle and upper classes powered forward on asset appreciation and employment resilience, creating a massive economic disparity that effectively masked the underlying rot in the broader labor market. Now, with cumulative revisions pushing past one million miscounted jobs last year, the data may finally be catching up to reality and reality has sharp teeth.
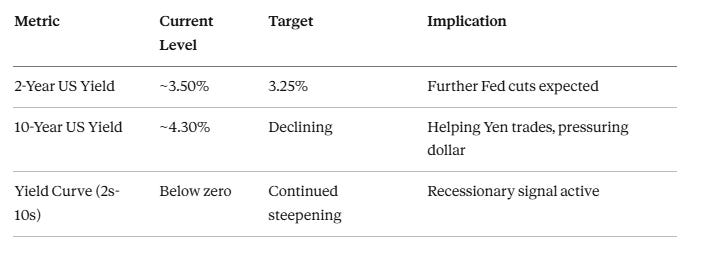
But what does “catching up” look like for your portfolio? The two-year U.S. yield is sliding toward 3.25%, confirming further rate cuts are on the horizon. Fed Funds Futures are pricing the terminal rate at approximately 3% by December 2026, and historical patterns around revision events suggest this may represent a floor rather than a waypoint. Real yields are declining while equities push higher a combination that, with near-90% historical accuracy, sends the U.S. dollar materially lower. Credit spreads remain the canary in the coal mine for any sudden risk-off events. And the Yen pairs? They’re in freefall, with unfilled gaps at 147.80 on USDJPY and 198.80 on GBPJPY acting as gravitational magnets that the market has stubbornly refused to close.

What looks like routine data revision today may be setting the stage for something far more consequential. The steepening yield curve, the collapsing Yen crosses, the central bank divergence plays, the declining real yield regime: they’re all converging toward a single, portfolio-defining conclusion. But we’re not there yet.
NFP revisions historically precede every major U.S. recession since 1979 and new downward adjustments may confirm the pattern
Two-year yields continue finding lower lows, targeting the 3.25% level and signaling further Fed cuts
The yield curve’s “projector line” has crossed below zero again, a signal that has only missed once since the 1960s
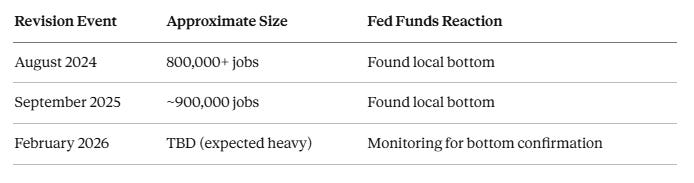
Fed Funds Futures discount the rate to ~3% by year-end 2026, with job revisions historically marking bottoms in this market
Yen pairs have delivered 700+ combined pips on USDJPY alone, with unfilled gaps suggesting another 500–960 pips of downside
Central bank divergence between the hawkish RBA and dovish BoE has driven GBPAUD down over 1,000 pips and it’s not done
Real yields down + SPX up = dollar down, a correlation holding at roughly 90% strike rate, currently active
The single most consequential trade setup of this cycle is hiding in plain sight and everything above is pointing directly at it
Bond Market Signals: The Yield Curve’s Unfinished Business
Two-Year Yields and the Path to 3.25%
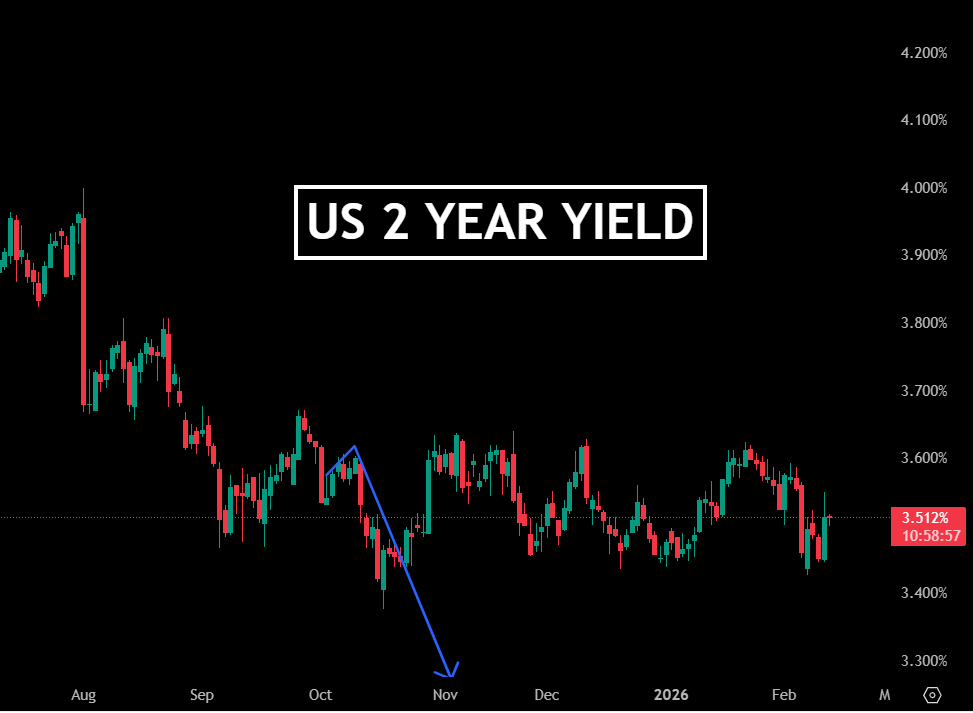
The most interest-rate-sensitive bond in the U.S. Treasury complex is telling a clear story. The two-year yield continues to find lower lows, currently hovering near the 3.5% level, with analysis from last year targeting a move toward 3.25%. That trajectory remains intact and implies further Federal Reserve rate cuts are not just expected they’re being actively priced by some of the most sophisticated participants in global fixed income.
For context, when yields decline, the underlying bond appreciates, a perfect inverse relationship of 100%. Last year’s thesis that the “risk-free trade” was simply being long two-year bonds has been validated repeatedly as yields grind lower, rewarding patient holders. The two-year, being the most sensitive maturity to the Federal Reserve’s rate-setting decisions, acts as the market’s real-time vote on where monetary policy is headed. And right now, that vote is unambiguous: lower.
The yield curve is not a market that head-fakes. Looking back to the 1980s, it moves in rounded cycles bottoms, rounded tops, rounded bottoms and currently, the path trajectory is to continue going down.
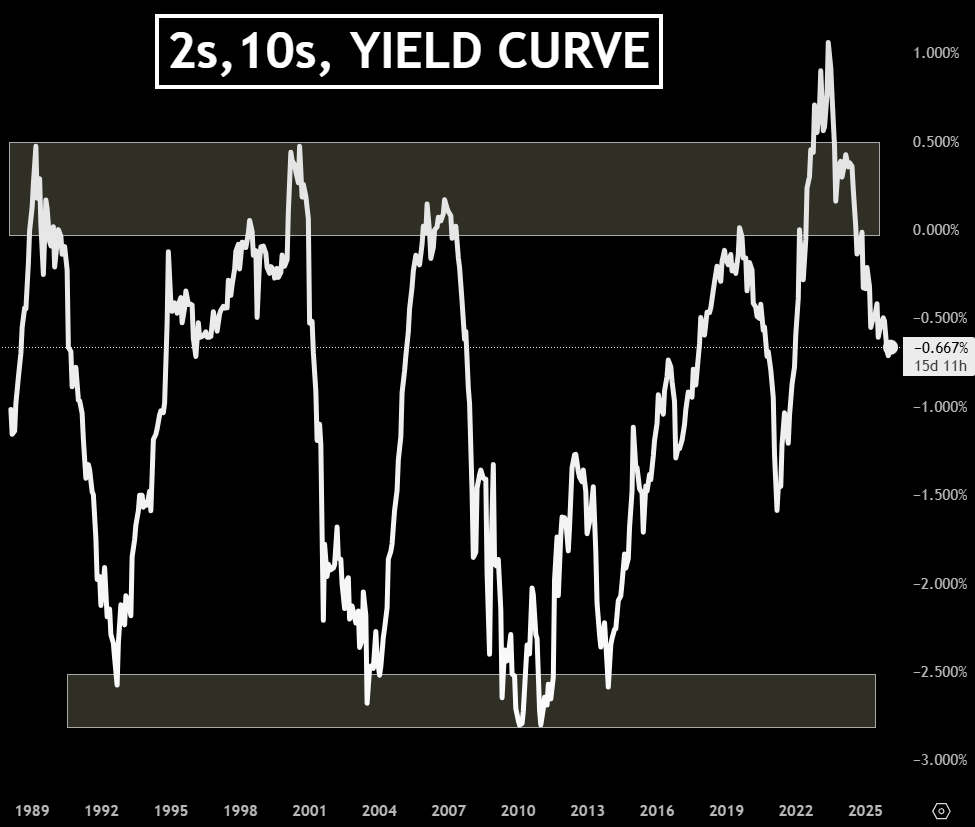
The Recession “Projector Line”
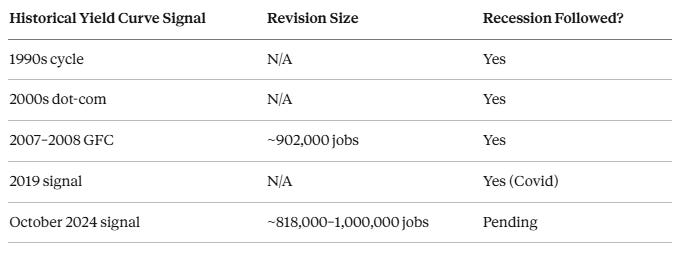
Perhaps the most consequential chart in macro analysis is the two-year minus ten-year yield spread and its relationship to the zero line. The historical record is staggering: every time this spread has risen above zero and then dropped below it, a recession followed. The 1990s contraction, the dot-com crash, the Great Financial Crisis, the Covid recession all preceded by this exact signal. The data stretches back to 1979, and this “projector line” has only missed once, reportedly in the 1960s. It does not head-fake. It does not give false signals with any regularity. It simply cycles through rounded tops and rounded bottoms with an almost mechanical inevitability.
The steepening trade:
Sell 10-year duration
Buy 2-year duration
has been a popular and profitable position for years and is expected to continue. Bond traders are leaning into this dynamic because the market believes the Fed will cut rates further, pulling the short end down, while the 10-year remains more sensitive to Treasury issuance dynamics than to rate expectations alone.
Every major job revision in U.S. history has preceded a major recession. In 2009, roughly 902,000 jobs were miscounted before the crisis. The latest adjustments are over one million. The data is catching up to reality.
The signal fired again in October 2024, suggesting recession by summer 2025. It didn’t arrive likely because NFP was being misreported and GDP remained resilient. Recent revisions confirm the pattern, it slots perfectly into a framework that has only missed once since the 1960s.
Federal Reserve Outlook: Reading the Futures Market
Fed Funds Futures and the 3% Terminal Rate
The December 2026 Fed Funds Futures contract is currently pricing a terminal rate of approximately 3%. For those unfamiliar with the mechanics, subtracting the contract price from 100 yields the implied rate, a straightforward way to see where the market expects the Fed to land by year-end. As a futures contract with monthly expiration, the December contract is always the one to watch at the start of any year because it captures the market’s full-year expectation for monetary policy.
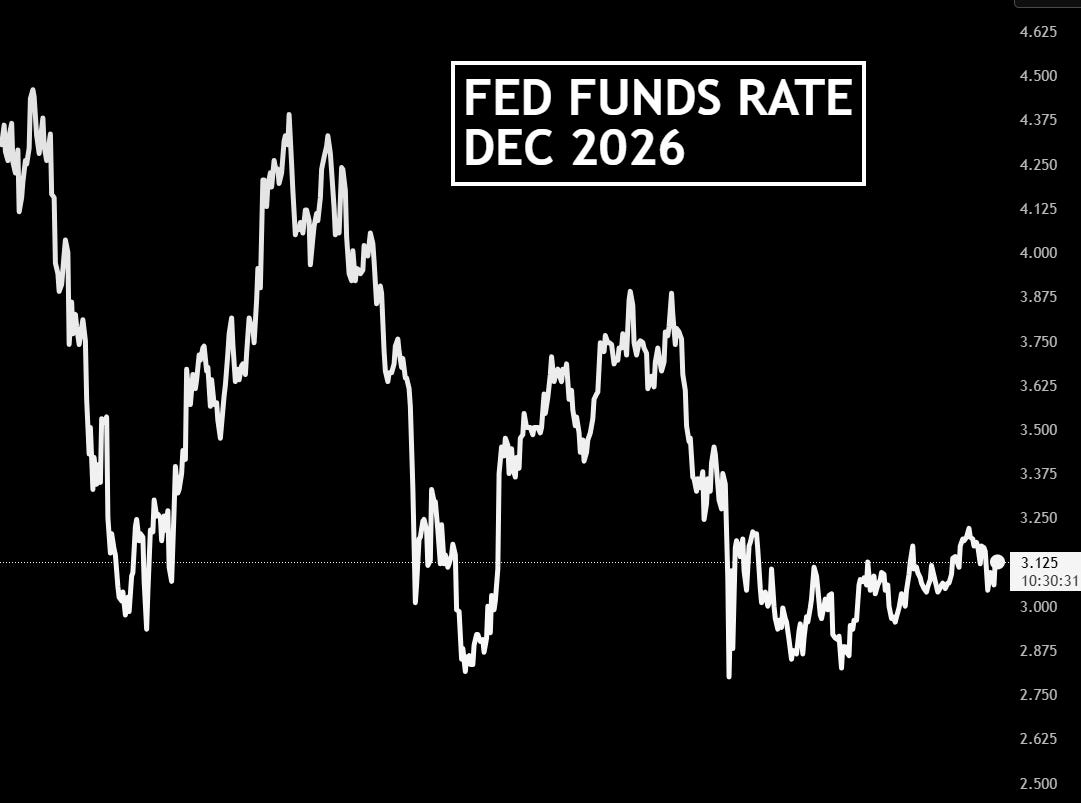
What makes this reading particularly instructive is the historical behavior around revision events. In September 2025, heavy revisions of roughly 900,000 jobs coincided with a bottom in the Fed Funds rate. In August 2024, revisions exceeding 800,000 jobs produced a similar floor. The pattern is remarkably consistent: revisions find the bottom for this market. Whether this time proves different remains to be seen, but the base case is that the Fed stays around 3% regardless of prior revisions, because those revisions historically marked floors, not catalysts for further repricing.
The answer to what the NFP means for markets is found entirely within the Fed Funds Futures nothing else. Not the narrative, not the spin. Watch the repricing.
EFFR Convergence
The Effective Federal Funds Rate (EFFR) sits at 3.66%, while futures are pricing 3%. Historically, these two metrics do not remain out of sync for long one always converges to the other. This implies approximately two more cuts to close the gap. Nothing dramatic at this stage, regardless of whatever narrative gets spun.
Risk Indicators and Equity Landscape
High Yield Credit Spreads: The Risk-Off Barometer
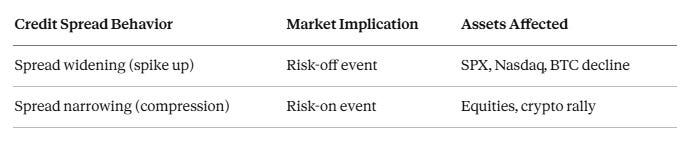
The ICE BofA US High Yield Index (BAMLH0A0HYM2) remains the premier gauge of market stress. When this spread widens, investors are demanding higher compensation for holding corporate bonds over government paper, a classic risk-off signal that historically coincides with drawdowns across the S&P 500, Nasdaq, and Bitcoin alike. Conversely, when spreads compress, it signals confidence and risk appetite returning to the market. This is the chart to watch in the immediate aftermath of the NFP release.
The Russell 2000 to S&P 500 ratio provides another lens on economic health. When small caps outperform, it typically signals that the broader economy, particularly regional banks and smaller enterprises, is turning a corner. When the ratio drops, it suggests capital is concentrating in large caps while smaller companies struggle. While this metric may be less reliable than in prior decades due to the sheer gravitational pull of passive capital flows into S&P 500 constituents, a sharp crash in Russell relative to SPX would still be a warning sign that conditions are deteriorating beneath the surface.
Commodities: The Recession Hedge Dilemma
Copper and oil present a genuine analytical tension. Copper continues to attract bids on supply-deficit narratives, and it is moving neatly within the Fed cycle framework. However, the volatility will not be for the faint-hearted, copper is unlikely to deliver the smooth, sustained returns that gold or silver produced in prior years. Oil was a strong dip-buy opportunity at the end of December alongside silver, both benefiting from the dollar’s decline. But here’s the catch: if the NFP confirms genuine economic deterioration, oil and copper are the first two assets that get repriced lower. This push-and-pull between dollar weakness (bullish commodities) and potential recession (bearish commodities) demands patience and humility rather than aggressive conviction.
Index Performance Within the Fed Cycle
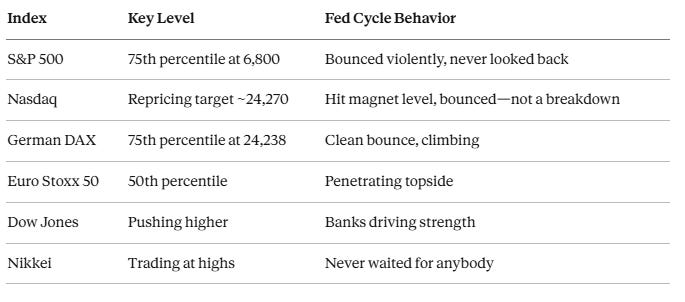
The Fed’s six-week cycle framework continues to demonstrate remarkable precision. Every major global index has respected its accumulation zones and percentile boundaries.
The dollar bearish move is continuing, risk-on is more or less continuing, but Yen is aggressively repricing. Speculators who were selling Yen for Japan’s fiscal expansion trade are taking money off the table and these price moves are very consistent with profit-taking.
Forex: Central Bank Divergence and the Dollar’s Decline
USD Weakness Across the Board
The U.S. dollar continues its structural decline, confirmed by multiple converging signals. USDMXN has been trending lower since January 2025, essentially since the current administration came into office and is now approaching levels consistent with the 2024 floor. A bad NFP read could trigger contagion and a sharp spike, which bears monitoring closely given the peso has been a popular short for much of the past year. USDCAD has shed well over 1,000 pips, validating last year’s contrarian call to buy Canadian dollars when tariff threats peaked, a bet premised on the critical insight that the U.S. was exiting trade agreements, not the other way around. The old correlation that a weakening U.S. economy automatically weakens the Canadian dollar appears to be fundamentally broken in the current regime.
USDCNH (Chinese Yuan) serves as a reliable leading indicator for dollar direction. When overlaid against the DXY on a monthly chart going back two decades, the correlation is remarkably consistent since China loosened its currency pegs. Both are currently signaling further dollar weakness, adding yet another layer of conviction to the bearish dollar thesis.
EURUSD indicators are pointing toward a move back up, though progress has been slow compared to the explosive Yen moves. There remains scope for the pair to revisit its latest highs, pending the NFP outcome.
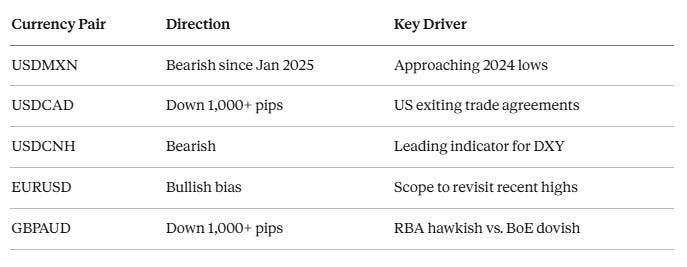
The Central Bank Divergence Play
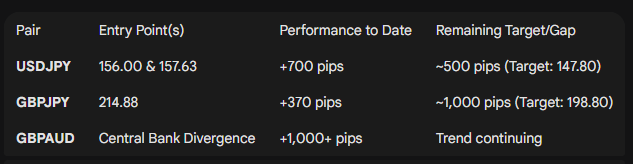
GBPAUD exemplifies the cleanest trade in foreign exchange: central bank divergence. The Reserve Bank of Australia remains hawkish while the Bank of England cuts rates. The result? A move exceeding 1,000 pips to the downside with significant room remaining.
When one central bank is hiking and the other is cutting, you want to put your money toward the one that is hiking because the economy is running hot. This is a pure central bank play nothing is blowing up in the UK or Australia. This is the cleanest trade you can ever trade.
The Generational Setup: Yen Pairs, Real Yields, and the Convergence of Everything
The Fed Six-Week Cycle Delivers
Every signal discussed above the declining real yields, the weakening dollar, the steepening yield curve, the risk-on equity backdrop converges on one asset class with devastating clarity: Yen pairs.
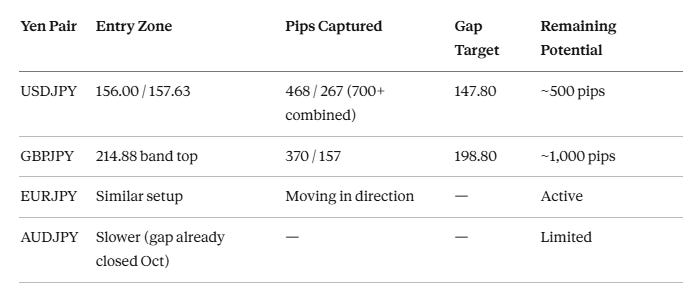
Using the Fed’s six-week cycle framework, USDJPY was shorted at 156.00 and 157.63 when the new cycle began on January 28, 2026. The previous cycle’s band ranged from a high of 159.46 to a low of 152.15. The result has been extraordinary: combined gains exceeding 700 pips on a single trade idea, with the unfilled gap at 147.80 suggesting another 500 pips of downside.
GBPJPY tells the same story, entered from a band high of 214.88 targeting the low at 206.77, it has already delivered 370 pips from the primary entry. The gap at 198.80 sits a further 1,000 pips below current levels.
The Real Yields-SPX-Dollar Trifecta
The ultimate conviction behind this trade comes from a framework with near-perfect historical accuracy. When real yields decline and the S&P 500 rises, the dollar falls. roughly 90% of the time. That exact scenario is playing out right now. Real yields are coming down not only because the 10-year bond yield is declining, but also because inflation breakevens have ticked slightly higher—driven primarily by the recent oil price recovery rather than any fundamental shift in inflation expectations. This combination naturally pushes real yields lower, and the implications cascade through every dollar-denominated cross.
The framework is precise in its asymmetry. When real yields rise and stocks fall, the dollar rallies aggressively, again around 90% of the time. But when yields and equities move in the same direction (both up or both down), the dollar’s behavior becomes inconsistent. What is consistent in those mixed scenarios, however, is Yen behavior: whenever real yields and the S&P 500 both decline, Yen pairs tank by 50, 80, even 100 pips per day across EURJPY, USDJPY, and AUDJPY. The current regime: real yields down, SPX up—is already confirmed and active. Should equities falter alongside yields, the Yen rally would only accelerate.
The likelihood of the gap at 147 not being closed is minuscule, particularly on this range and time frame. I am going to continue moving the ship in this direction until I see anything that tells me I should be moving out of the way.
The data has been checked. The gaps remain open. The real yield regime is confirmed. The central bank divergence is accelerating. And every historical precedent from the yield curve’s projector line to the Fed Funds Futures revision pattern, is aligning with a single directional conviction that has already delivered hundreds of pips and may deliver hundreds more. This is not a trade idea. This is the trade of this cycle.
Key Takeaways & Outlook
The current market environment is defined by a “rare confluence” of major signals:
Yield Curve Dynamics: The yield curve has breached its zero-line projector, signaling a firm “steepening” trade.
Labor Market Warnings: Non-Farm Payroll (NFP) revisions are approaching one million jobs: a pattern that has preceded every recession since 1979.
Interest Rate Pricing: Fed Funds Futures are currently pricing a terminal rate of 3%.
Market Divergence: Real yields are declining even as equities rise, a framework with a ~90% historical strike rate for confirming USD weakness.
High-Conviction FX Opportunities
The Yen pairs are identified as the primary vehicles for expressing these macro shifts:
## Key Frameworks & Outlook
The “Real Arbiter”: NFP release was judged by the Fed Funds Futures market, not the media narrative. Revisions historically tend to mark the “bottom” in that market.
The Six-Week Cycle: The “Fed cycle framework” continues to provide institutional-grade precision for timing entries across global indices and FX pairs.
Conviction: The unfilled gaps in JPY pairs suggest significant “runway” remains for the current trend.
What’s your positioning on these setups? Share in the comments: let’s discuss. Subscribe for weekly breakdowns.
Disclaimer: This is not financial advice—just market analysis derived from the charts and discussion. Always conduct your own research.
If you found this analysis valuable, please share it with fellow traders!
Warmest Regards,
Miad