

The White Swan: Iran Ceasefire Repricing and the April Fools’ Effect


Executive Summary
What happens when the market wakes up to a reality it refused to believe was possible?
On the morning of April 8, 2026, the world learned that Iran and the United States have agreed to a two-week ceasefire, brokered by Pakistan in what is already being dubbed “the gift of Pakistan.” Iran is allowing ships to pass the Strait of Hormuz, and global commodity flow is set to resume. Nobody had priced this in. Nobody believed it could happen in the short term. And now, every asset on the planet needs to reprice to come back to reality.
This is what we call a white swan effect: a predictable positive shock that catches the entire speculative community leaning the wrong direction. And the implications are staggering. Oil is collapsing below 100 on West Texas Intermediate. Dow Jones has punched above key resistance at 47,200 by a clean 400 points. Credit spreads are contracting, signaling that whatever fear was embedded in the market is evaporating. And the VIX, while still elevated near 25, is finally trending in the right direction.

But here is the deeper story: for the better part of six months, since October 2025, markets have been trapped in a grinding, directionless regime. Ninety percent of FX and virtually all equity indices gave position traders nothing to work with. We sat on our hands. We avoided type 2 errors. We refused to commit capital to subpar ideas. And now, with the ceasefire acting as a catalytic spark, the regime is finally dislodging. What looked like an endless sideways slog is transforming into something far more dynamic, and those who preserved their capital through the drought are about to be rewarded.
Yet the real story today is not just about indices or oil. It is about a seasonal pattern so reliable it has repeated for over a decade, a yield spread dislocation screaming for closure, and a confluence of forces that point toward one specific, high-conviction trade setup that could define the quarter. The pieces are falling into place, but the full picture only reveals itself when you see how real yields, the six-week FOMC cycle, and the April Fools’ effect converge on a single asset.
Are you positioned for what comes next?
Iran-US ceasefire triggers a white swan repricing event across all asset classes
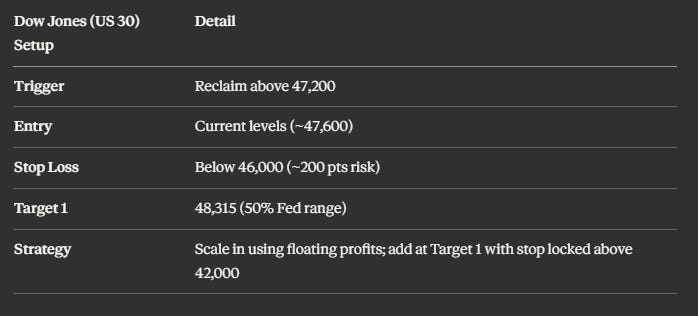
Dow Jones reclaims 47,200; the path to 48,315 (50% Fed range) is now open
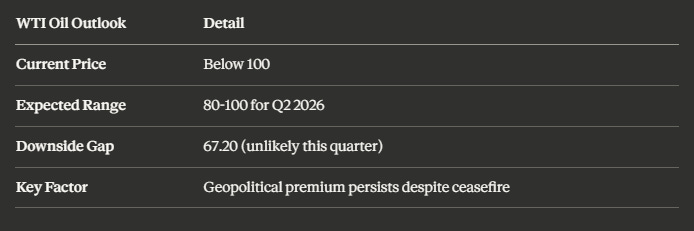
Oil (WTI) collapses below 100 but likely holds above 80 for the rest of the quarter
VIX declining from 25 toward the sub-20 trend-trading sweet spot
Credit spreads contracting before the ceasefire, confirming risk appetite was already returning
The April Fools’ effect on GBPUSD has repeated with striking consistency since 2015
Yield spreads on 10-year gilts vs. US bonds are at their highest level all year, hinting at a major GBPUSD repricing
Real yields and Fed rate expectations are compounding into a single directional thesis that could unlock the trade of the quarter
The Ceasefire Shock: A White Swan Repricing Event
Dow Jones Breaks Free
For months, the Dow Jones has been one of the most frustrating charts to watch. Since mid-October 2025, price action has been an aimless arc of shallow rallies and pullbacks, offering nothing for position traders who thrive on directional conviction. The critical threshold was clear: reclaim 47,200 on the upside, or accept that the bears had control.
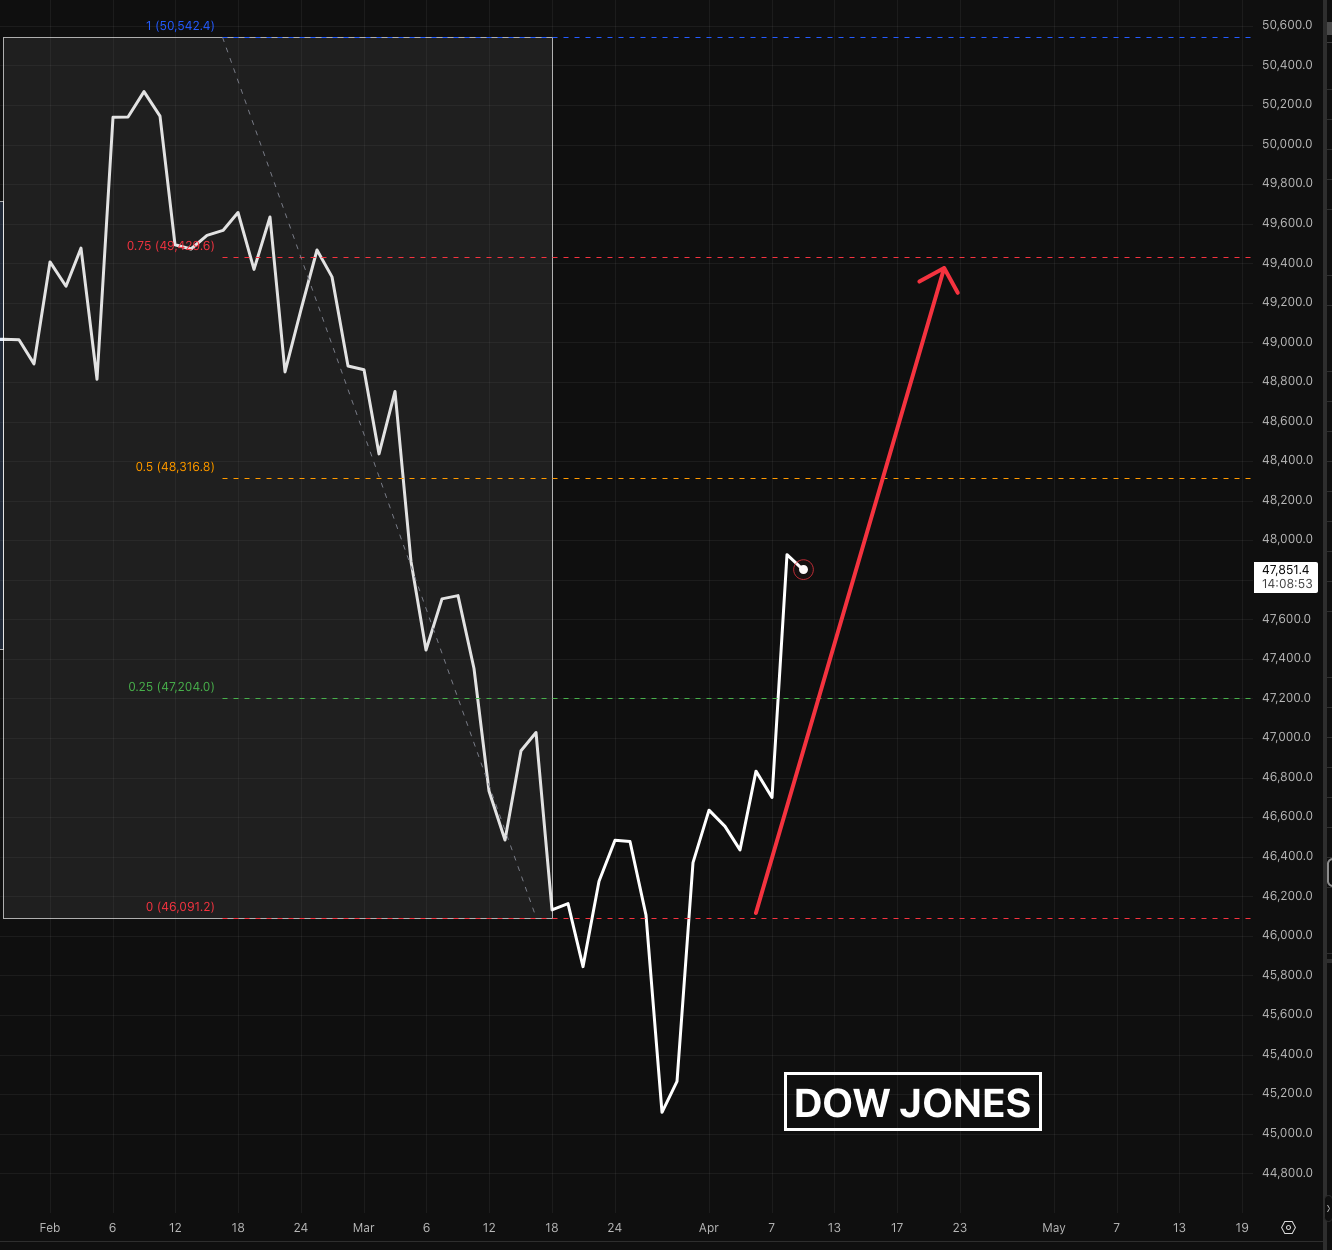
The ceasefire changed everything overnight. As of this morning, US 30 has blasted through 47,200 by roughly 400 points, flipping the structure decisively bullish. The next target? The 50th percentile of the entire Fed range at 48,315, marked by the yellow line on the chart. The strategy from here is elegant in its simplicity: use floating profits to build positions progressively, locking stops above cleared levels.
The regime is changing. “For the better part of since October, there was really nothing going on. That means us who capitalize on bigger trends were really protective for a long, long period of time. This is about to change, which means we can unlock our pockets and actually allocate.”
But every bullish thesis in this environment comes with a caveat tattooed on its forehead: what if the ceasefire does not hold? What if the bombing resumes and the Strait gets shut again?
The answer, as always, is that traders are not portfolio managers married to a thesis. You can change your mind within ten minutes and close an entire position. You trade the market, not your beliefs. And that distinction matters enormously right now, because the ceasefire introduces a binary risk that could whipsaw any position in either direction. The speculator’s advantage is agility: the ability to flip from long to flat to short without the institutional bureaucracy that traps larger players in losing positions for quarters at a time.
What makes the current Dow Jones breakout particularly compelling is the context surrounding it. This is not just a technical reclaim of a level. It is the market’s verdict on six months of suppressed volatility. Since October, the index built a compressed arc of shallow moves that offered nothing for trend followers. Every rally faded, every dip was bought, and the net movement was negligible. Traders who recognized this regime for what it was, a capital preservation environment, avoided the grind and kept their powder dry. Those who forced trades through the chop got burned, using trending playbooks in a mean-reverting market. The ceasefire has cracked that compression open, and the energy stored in six months of consolidation is now available to fuel a directional move.
Oil: The Kingmaker Collapses
If the ceasefire is the spark, oil is the fuel that was already burning. WTI had topped out at levels the analysis flagged weeks ago, and the collapse has been dramatic. Oil is now trading below 100, and the expectation is for price to oscillate between 80 and 100 for the foreseeable future. A break below 80 could target a gap at 67.20, but the built-in geopolitical premium makes that unlikely this quarter.
Oil remains the kingmaker. “We said oil had topped, and it turns out we are still right. Oil started collapsing quite dramatically, trading under 100 now.”
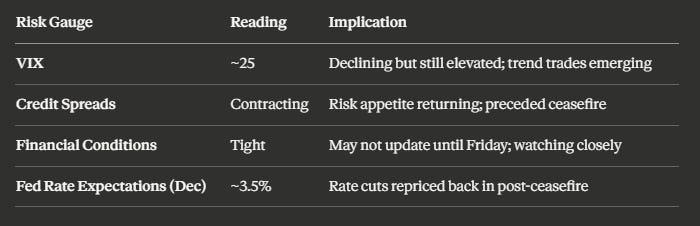
VIX and Credit Spreads: The Fear Gauges Are Fading
The VIX sits at approximately 25, still elevated above the sub-20 zone where clean trend trades historically thrive. The dilemma for speculators is timing: by the time VIX drops below 20, indices may have already moved beyond attractive entry levels. The decision is to step in now and manage risk dynamically if the ceasefire unravels.
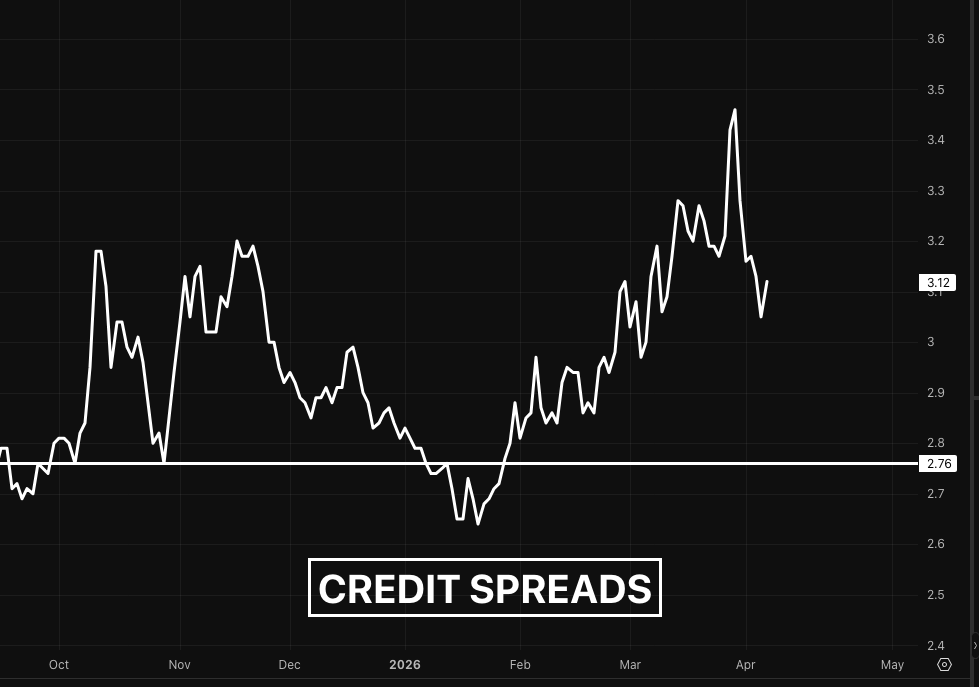
Meanwhile, credit spreads are doing something remarkable. They began contracting before the ceasefire announcement, suggesting that institutional risk appetite was already quietly returning. This is a powerful confirmation signal: the smart money was already repositioning before the headlines dropped. When credit spreads move ahead of a catalytic event, it tells you the underlying flow dynamics were already shifting. The ceasefire simply accelerated what was already in motion.
Bitcoin is staging a mini rally as well, though financial conditions remain a headwind. For those newer to macro analysis, the financial conditions index shows how much money is actually available in the system to allocate toward risk assets. When it rises, that is risk-negative. When it falls, money is flowing. Over longer timeframes, the trend has been downward, which supports risk asset appreciation. But the most recent readings remain fairly tight, and the index may not update until Friday. Bitcoin, as a risk asset on an investment level, needs loosening financial conditions to sustain any rally beyond a short squeeze.
Credit spreads led the way. “Credit spreads are coming back down. This actually started turning before there was a ceasefire. So that’s quite good.”
The April Fools’ Effect: A Decade of Deception
Why the First Two Weeks of April Lie to You
There is a seasonal pattern hiding in plain sight, and it has repeated with almost eerie consistency for over a decade. The start of April, coinciding with a new quarter and tax season, routinely produces fake-out moves that trap traders before the real directional trend emerges through May and into June. It is, quite literally, the market’s April Fools’ joke.
Using GBPUSD as the benchmark, chosen because it bridges commodity sensitivity, risk sensitivity, and major-currency stability, the pattern reveals itself year after year:
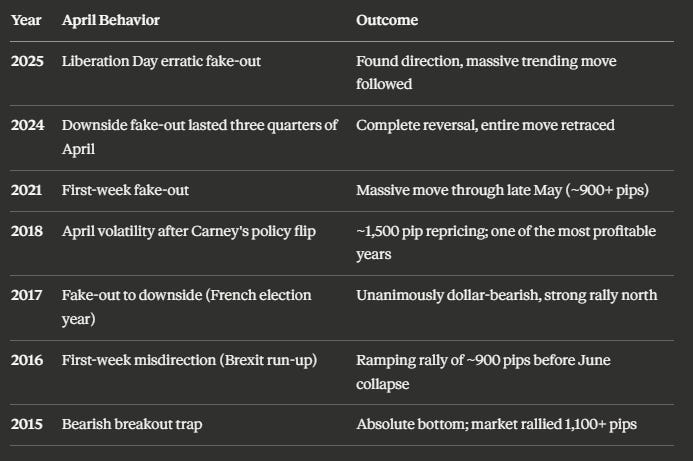
The evidence is overwhelming. The first one to two weeks of April draw traders into the wrong direction, exploiting the positioning built during the prior quarter. Then the real move begins.
April is the market’s cruelest teacher. “April Fools’ week is a real thing. In 2015, the first week of April would have got you sucked into a bearish position which was the absolute bottom, and the market went up 1,100 pips.”
Speculative Psychology: Type 1 vs. Type 2 Errors
Understanding why traders get trapped in April requires a framework for speculative error. Type 2 errors are positions taken out of fear, FOMO, or the compulsion to act after weeks of inactivity. They are human errors, entirely avoidable. Type 1 errors are analytical misallocations, applying the wrong playbook to a changed regime, and they are simply built into the business of speculation.
Our discipline this year has been exceptional: avoiding type 2 errors through the grinding October-to-March regime, preserving capital, and waiting for the environment to shift. That shift is now underway. The silver trades worked. The Bitcoin position took a modest two to three percent loss. A few GBPJPY trades contributed positively. But the real victory was in what was not done: no overcommitment to subpar ideas, no desperate position-building in a regime that punished directional conviction. The profits from inaction are invisible on a statement but enormous in terms of capital preserved for exactly this moment.
Discipline is the edge. “The amount of people that get burned in these is insane. They use the same playbook in the previous regime, don’t see that the regime is changing, and then get burned quite a lot.”
The Yen Conundrum: When an Asset Refuses to Cooperate
GBPJPY and USDJPY Stall
Not every asset is playing along with the bullish repricing narrative. Yen pairs have been stubbornly uncooperative. GBPJPY had an initial profitable run, but the second position is now underwater, with the two more or less cancelling each other out. The anticipated gap close has simply not materialized on the expected timeline.
USDJPY tells a similar story. The gap from October remains open nearly six months later, with no sign of collapse. The high-probability scenario remains that USDJPY attacks 164 and headlines begin screaming about 170 or 180. That is when the short entry becomes compelling, anticipating the gap close from extreme levels.
Know when to disengage. “Yen is not doing what I usually would do. It should have popped and went down with yields, but it didn’t. It should have went with equities, but it didn’t either. It just did nothing useful.”
Yen Pair Status Outlook GBPJPY Positions cancelling out Disengaging; cyclical upswing may persist USDJPY Gap from October still open (6 months) Short on attack of 164 with headlines targeting 170-180 Key Headwind Commodity complex hurting JPY (net importer) Structural drag may persist
The lesson? When an asset refuses to behave according to its historical drivers, something else is underway. For Yen, the commodity complex is likely the culprit, as Japan remains a net importer, and the smart play is to disengage until the setup becomes undeniable.
The Convergence: Real Yields, Yield Spreads, and the GBPUSD Trade of the Quarter
The Yield Spread Dislocation
This is where every thread in today’s analysis converges into a single, high-conviction thesis.
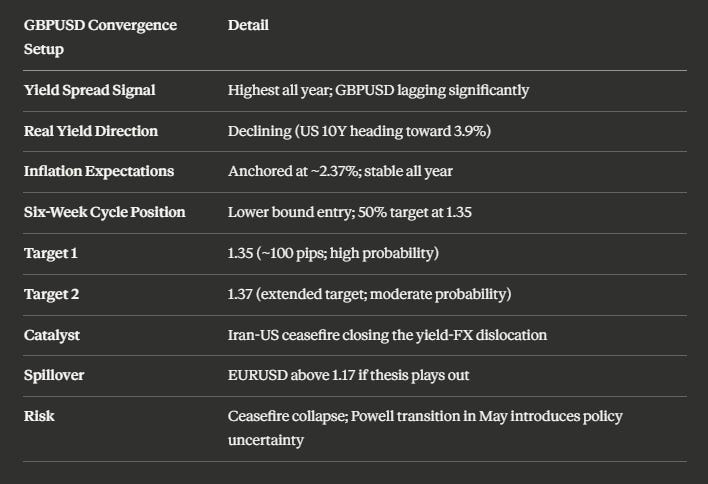
The chart that has historically been the magic indicator for GBPUSD direction is the 10-year gilt yield minus US 10-year bond yield spread. Over extended periods, GBPUSD follows this spread with remarkable fidelity. When dislocations occur, the yield spread always leads, and GBPUSD eventually catches up.
Right now, the dislocation is screaming. Yield spreads are at their highest level all year, having surpassed last year’s peaks. Meanwhile, GBPUSD remains depressed well below where the spread says it should be trading. The implication is clear: GBPUSD wants to climb another 100 to 200 pips in the short term to close the gap.
Real Yields and the Bessent Target
The conviction compounds when you layer in real yields, the nominal 10-year bond yield minus inflation expectations. Real yields are declining, and the mechanism is straightforward: inflation expectations (break-even rate) are anchored at approximately 2.37%, barely moving within 10 basis points all year. The component that is moving is the 10-year nominal yield itself, and it is heading lower.
Treasury Secretary Scott Bessent has stated publicly he wants the 10-year yield trading with “a three in front of it.” They have largely achieved that, minus the recent disruption. The expectation is for 10-year yields to move toward the bottom of the range at 3.9% at minimum. A declining US 10-year yield, while gilt yields hold steady, mechanically widens the yield spread further in GBPUSD’s favor.
The confluence is undeniable. “You can see it in the yields, you can see it in the real yields. Now we’re starting to compound those effects that will give us the trade idea we’re looking for.”
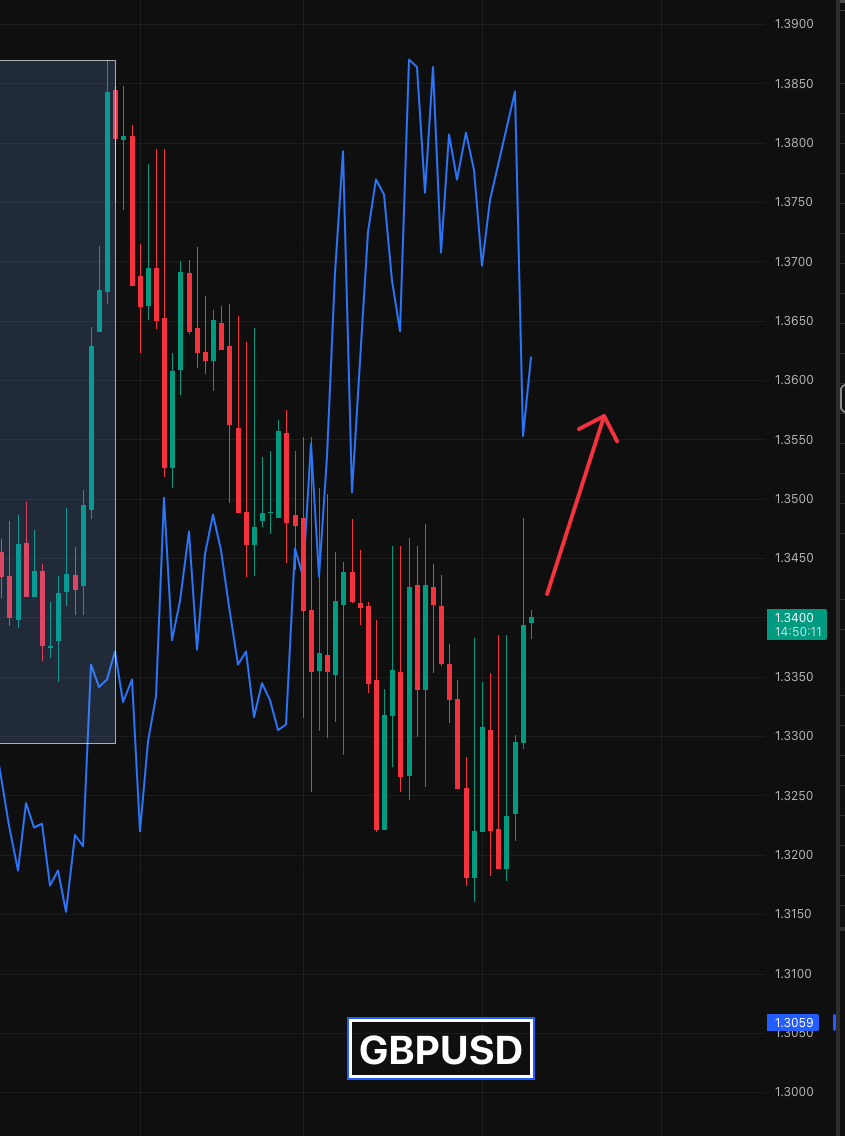
The GBPUSD Setup: Six-Week Cycle Confirmation
The six-week FOMC cycle indicator confirms the timing. GBPUSD entered this cycle on the lower bound, and the proprietary cycle tool now points toward a 50% level at 1.35, roughly 100 pips from current levels, as the minimum repricing target. Beyond that, 1.37 comes into probabilistic range as well.
This is not an isolated call. If GBPUSD moves to 1.35-1.37, it lifts all tides: EURUSD is expected to trade above 1.17 in this scenario. The ceasefire provides the catalytic spark to close the yield spread dislocation that has been building for weeks.
Three independent analytical frameworks, yield spreads, real yields, and the six-week FOMC cycle, are converging on the same directional call at the same time, with a geopolitical catalyst now in place to trigger the move. This is the compounding confluence that defines a quarter-defining setup.
Key Takeaways & Outlook
The Iran-US ceasefire has arrived as a genuine white swan, forcing a repricing across every major asset class. But the ceasefire is merely the spark. The real story is the convergence of structural forces that have been building beneath the surface for weeks: yield spreads at their highest level all year, real yields declining toward the Bessent target of a “three-handle” 10-year, inflation expectations anchored, and the six-week FOMC cycle entering from the lower bound.
All of these forces point in one direction: GBPUSD to 1.35 at minimum, with 1.37 as a realistic extended target. The yield spread dislocation between 10-year gilts and US bonds has been waiting for a catalyst to close, and the ceasefire is precisely that catalyst. If this plays out, the ripple effects extend to EURUSD above 1.17 and a broadly weaker dollar environment.
On the equity side, Dow Jones above 47,200 opens the path to 48,315, with the strategy of building positions on floating profits. Oil is expected to range between 80 and 100, maintaining a geopolitical premium despite the ceasefire. The April Fools’ effect, documented consistently from 2015 through 2025, warns that the first two weeks of the month are designed to trap, and the real directional moves emerge in late April through May.
The regime change from the six-month sideways grind since October is finally underway. Capital that was preserved through disciplined avoidance of type 2 errors can now be deployed into a market that is creating real opportunity. After months of patience, the compounding confluence of yields, cycles, and geopolitics is delivering the setup we have been waiting for.
What’s your positioning on these setups? Share in the comments. Let’s discuss. Subscribe for weekly breakdowns.
Disclaimer: This is not financial advice -- just market analysis derived from the charts and discussion. Always conduct your own research.
If you found this analysis valuable, please share it with fellow traders!
Trade Strong
Miad