

This is how long Volatility will reign chaos
Earnings, Crypto and AI

TLDR; Volatility is not only King, but President and Pope as well
Welcome to our detailed analysis of the current market landscape, following a significant volatility event triggered by unexpected geopolitical news. The recent announcement by Trump regarding tariffs on China caused immediate market ripples, leading many to question if a top is in. However, the core thesis presented in the quarterly outlook remains firmly intact. This post provides an exhaustive breakdown of the catalysts shaping Q4 2025, deep dives into Bitcoin and Ethereum technicals, advanced strategies for managing leverage and risk, and exclusive insights into the evolving AI landscape, particularly the relationship between Microsoft and OpenAI( Access to our live option trades).
The recent drawdown in Bitcoin perfectly filled an open gap on the IBIT (institutional ETF) monthly chart, neutralizing a key inefficiency. This $19 billion liquidation event is viewed as a structural bottoming process rather than a bearish reversal. The focus now shifts decisively to the Q4 Earnings Season, identified as the biggest event for the markets, overshadowing even the upcoming FOMC meeting. Earnings kick off with JPM on October 14th, setting the tone for the critical period at the end of October when Big Tech (Microsoft, Apple, Amazon, Meta) reports around October 29th-30th. Historical seasonality strongly favors Q4, as consistent earnings beats drive the NASDAQ higher, which in turn propels Bitcoin.
In the crypto space, Bitcoin (BTC) is currently in a consolidation zone between $108,353 and $123,000. While the daily structure is broken, the weekly structure remains bullish, holding above the critical $107,000 support (the previous quarterly open). Ethereum (ETH) presents a cleaner trending structure, currently navigating an Inside Monthly Candle Failure pattern. This setup mirrors Bitcoin’s November 2024 consolidation, suggesting a period of sideways action before a significant breakout, likely triggered by the late-October catalysts.
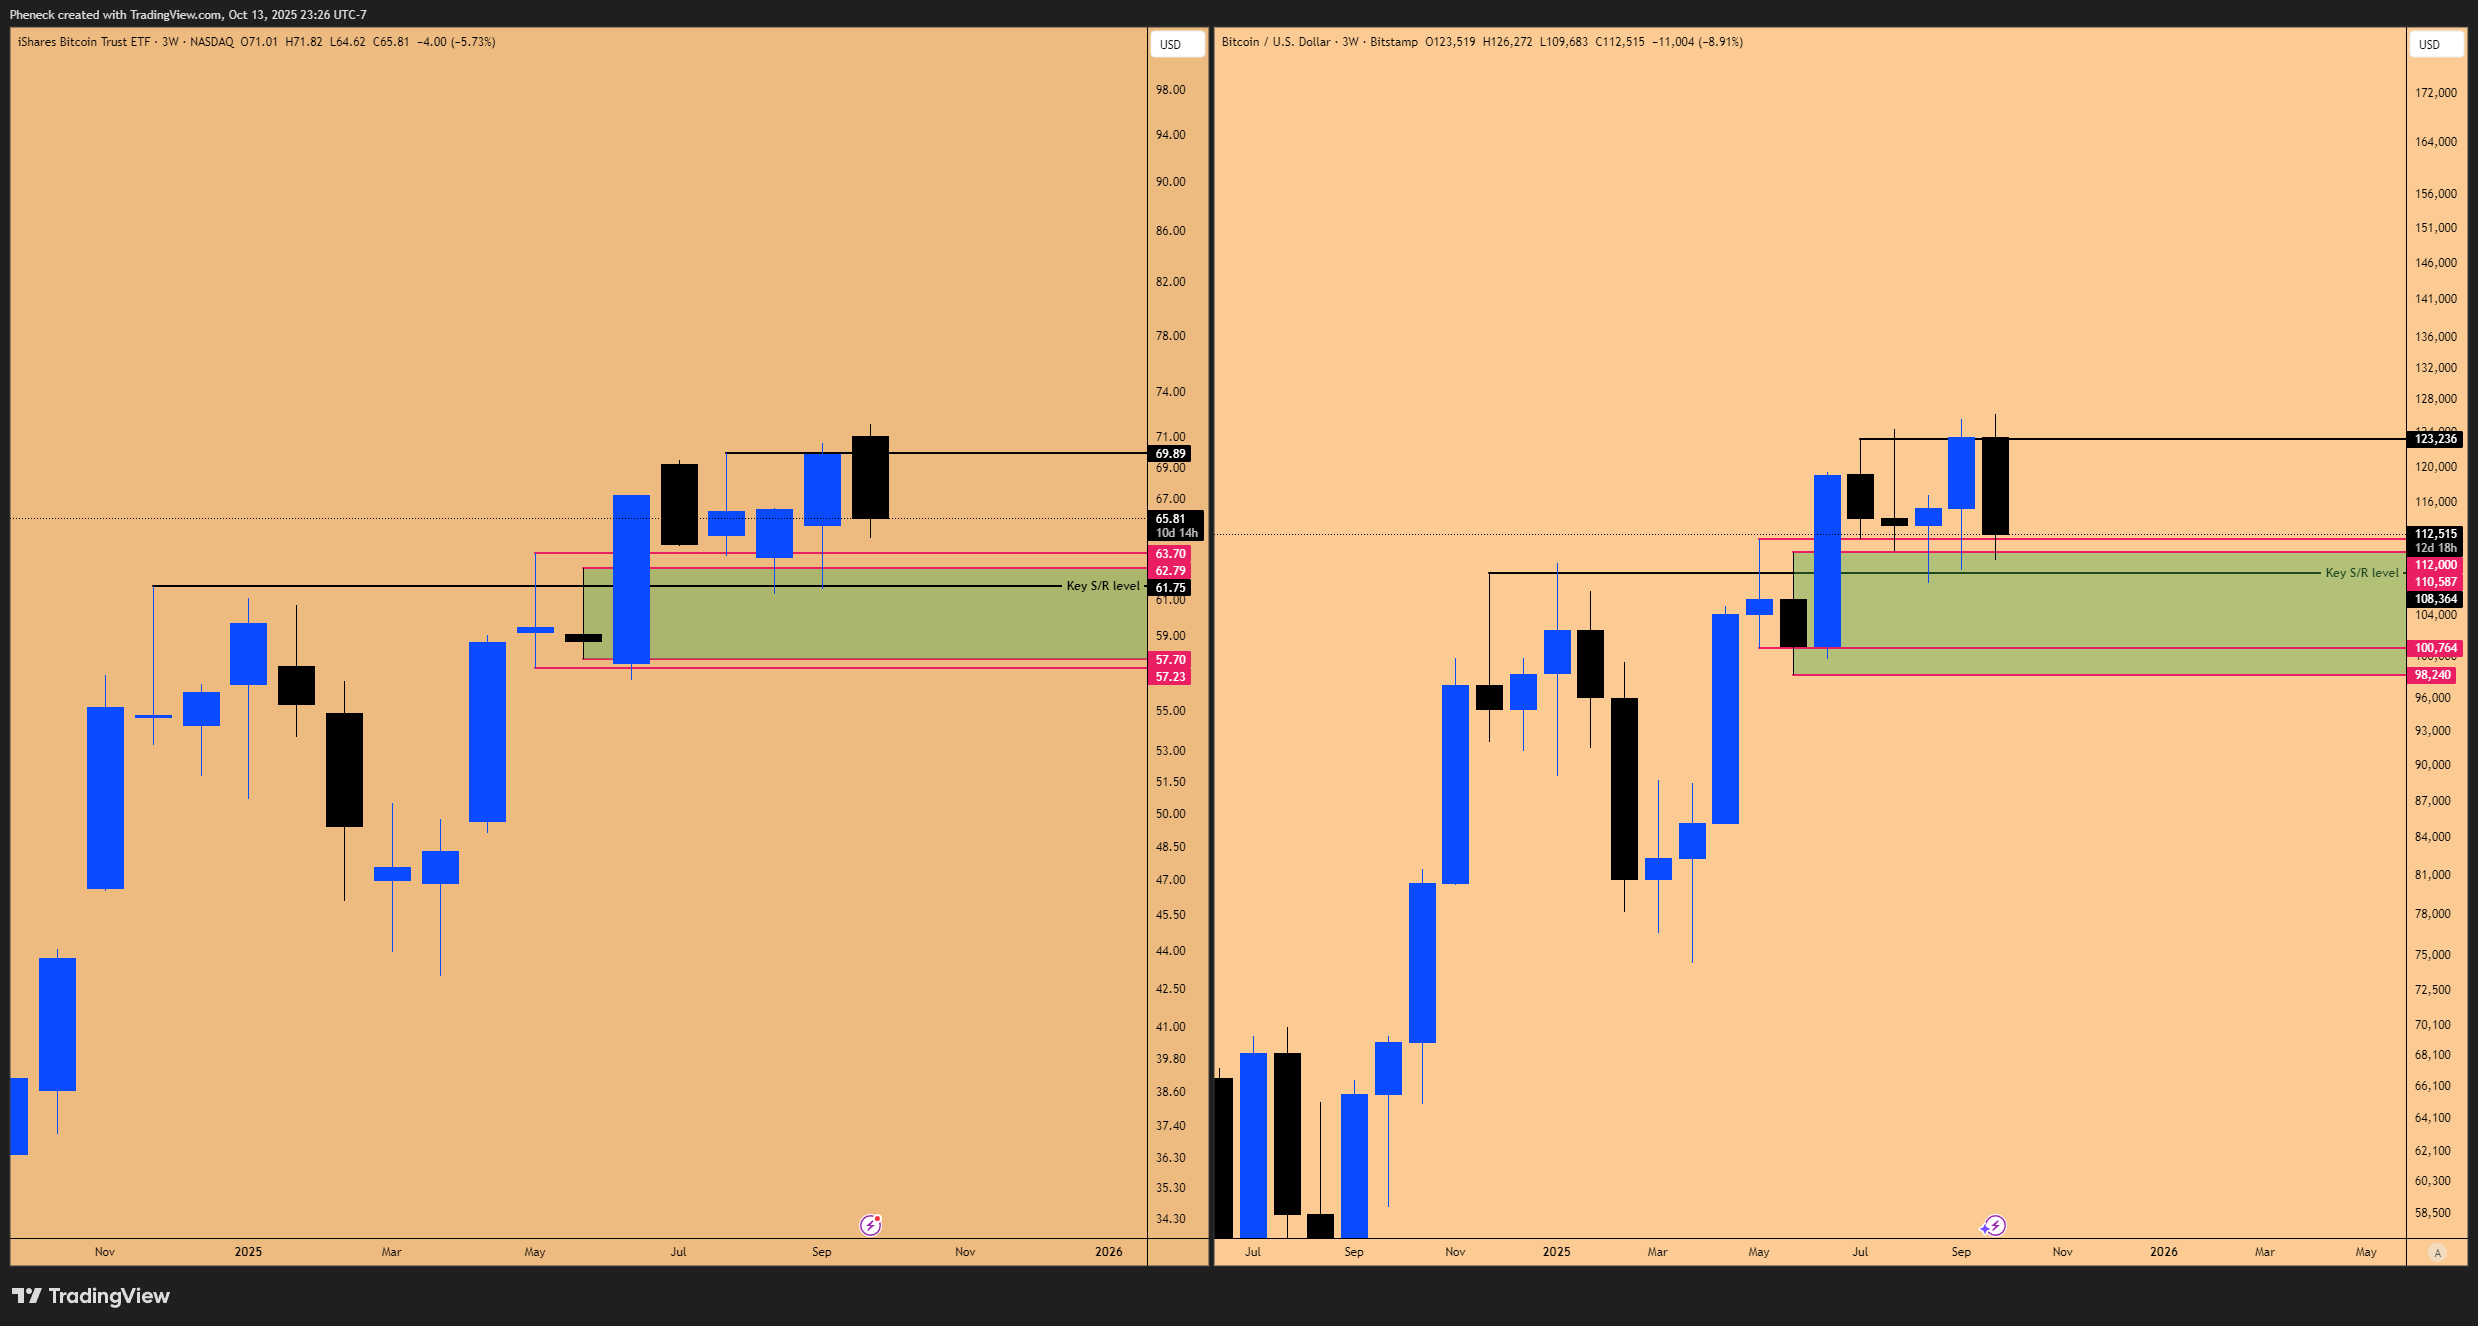
Figure 1: BTCUSD key levels in play
A major theme of this analysis is sophisticated risk management. We explore why perpetual futures carry inherent liquidation risks and advocate for alternatives like prop firms or Leveraged ETFs (such as ETHU for 2x ETH exposure) listed on the NYSE, which do not face the same liquidation threats. Furthermore, we emphasize the superiority of options trading for long-term positioning, arguing that “time in the market is far more useful than timing the market.” Options allow traders to position for 90-day quarterly moves and weather short-term volatility without the risk of total account obliteration.
In equities, the focus is squarely on AI leaders. A deep dive into Microsoft (MSFT) reveals critical details about the September 2025 Memorandum of Understanding (MOU) with OpenAI.1 Crucially, Microsoft is set to receive approximately 49% of OpenAI’s future profits, a massive revenue stream that has not yet been reported and is expected to reflect in the upcoming October 29th earnings report. Historical analysis shows Microsoft averages an 18% return in Q4, suggesting a potential move to $604. Meta (META) is also highlighted as a high-conviction play, with a setup targeting $850-$950 by April 2026, capitalizing on its strong Q1 seasonality.
Key Takeaways:
The recent volatility event (China tariffs) is viewed as a temporary disruption; the Q4 2025 bullish outlook remains intact.
Q4 Earnings Season (late October) is the primary catalyst for NASDAQ and, consequently, Bitcoin and Ethereum.
Bitcoin is consolidating above $107k support; Ethereum is setting up for a major monthly breakout.
Risk management favors leveraged ETFs and long-dated options over perpetual futures contracts.
Microsoft’s upcoming earnings may reveal significant new revenue from its 49% profit share agreement with OpenAI.

🎢 Market Volatility and the Q4 Catalysts
The 18th episode of the livestream (accessible via our premium discord) opened amidst a “saucy” environment, characterized by a recent volatility event that made strides across the board. This sudden market movement led some participants to speculate that a top might be in, questioning the potential for further upside. However, the fundamental premise remains that whatever was discussed in the quarterly outlook still holds true.
The Tariff Shockwave and Immediate Reactions
The catalyst for the recent market downturn is well-known: Trump announcing the way tariffs are implemented on China. This move was characterized as “completely unexpected,” something nobody could have anticipated. While this geopolitical event triggered the immediate volatility, it does not fundamentally alter the premise for Q4 2025, nor does it inherently make the outlook bearish. The market reaction, particularly in Bitcoin, served a technical purpose by filling existing gaps (discussed in detail in the Bitcoin section), effectively neutralizing inefficiencies created during the recent rally to all-time highs.
The Q4 Juggernaut: Earnings Season and FOMC
The main events lined up for Q4 are not geopolitical skirmishes but the upcoming US equities earnings season. This period is identified as the biggest event for this month, even more significant than the FOMC event scheduled for the end of October.
Earnings season kicks off this week, with the first major report coming from JPM (JP Morgan), the largest bank in the US. JPM reports on October 14th (tomorrow). The results from JPM will set the initial tone for the earnings season.
The critical focus, however, is on Big Tech, due to the pivotal role companies like Microsoft play in deciding the direction of the NASDAQ index (QQQ), which subsequently has major implications for Bitcoin. The earnings season sets the tone for how companies will perform in October and November.
The end of October is poised to be a massive catalyst:
October 23rd: Amazon (AMZN) reports.
October 29th: Microsoft (MSFT), Meta (META), and potentially others report.
October 29th/30th: FOMC Meeting.
October 30th: Apple (AAPL) reports.
The confluence of the FOMC meeting and the main tech companies reporting earnings around October 29th and 30th will provide the massive catalyst needed to set the trend going into November. The market is expected to be very forward-looking, likely forgetting the tariff news from last week and positioning based on future performance expectations.
NASDAQ Seasonality and the Big Tech Influence
One of the primary reasons for optimism regarding Q4 is the powerful historical seasonality of the NASDAQ index. The period starting in late October and extending through November and December is consistently bullish. This strength is directly attributed to the earnings season.
The major constituents of the index Apple, Microsoft, Nvidia, Amazon, Netflix, Google, Tesla, and Meta all report their earnings in the second half of October. Historically, these companies consistently beat their earnings estimates. When they do, it acts as a trigger for the market to start outperforming.
Historical Context:
Even during the 2022 bear market, when the overall market trend was down, the bottom occurred in October, and the market started rising in November and December. This highlights the core idea that even during downtrends, the seasonally strong months (October and November) tend to be up months.
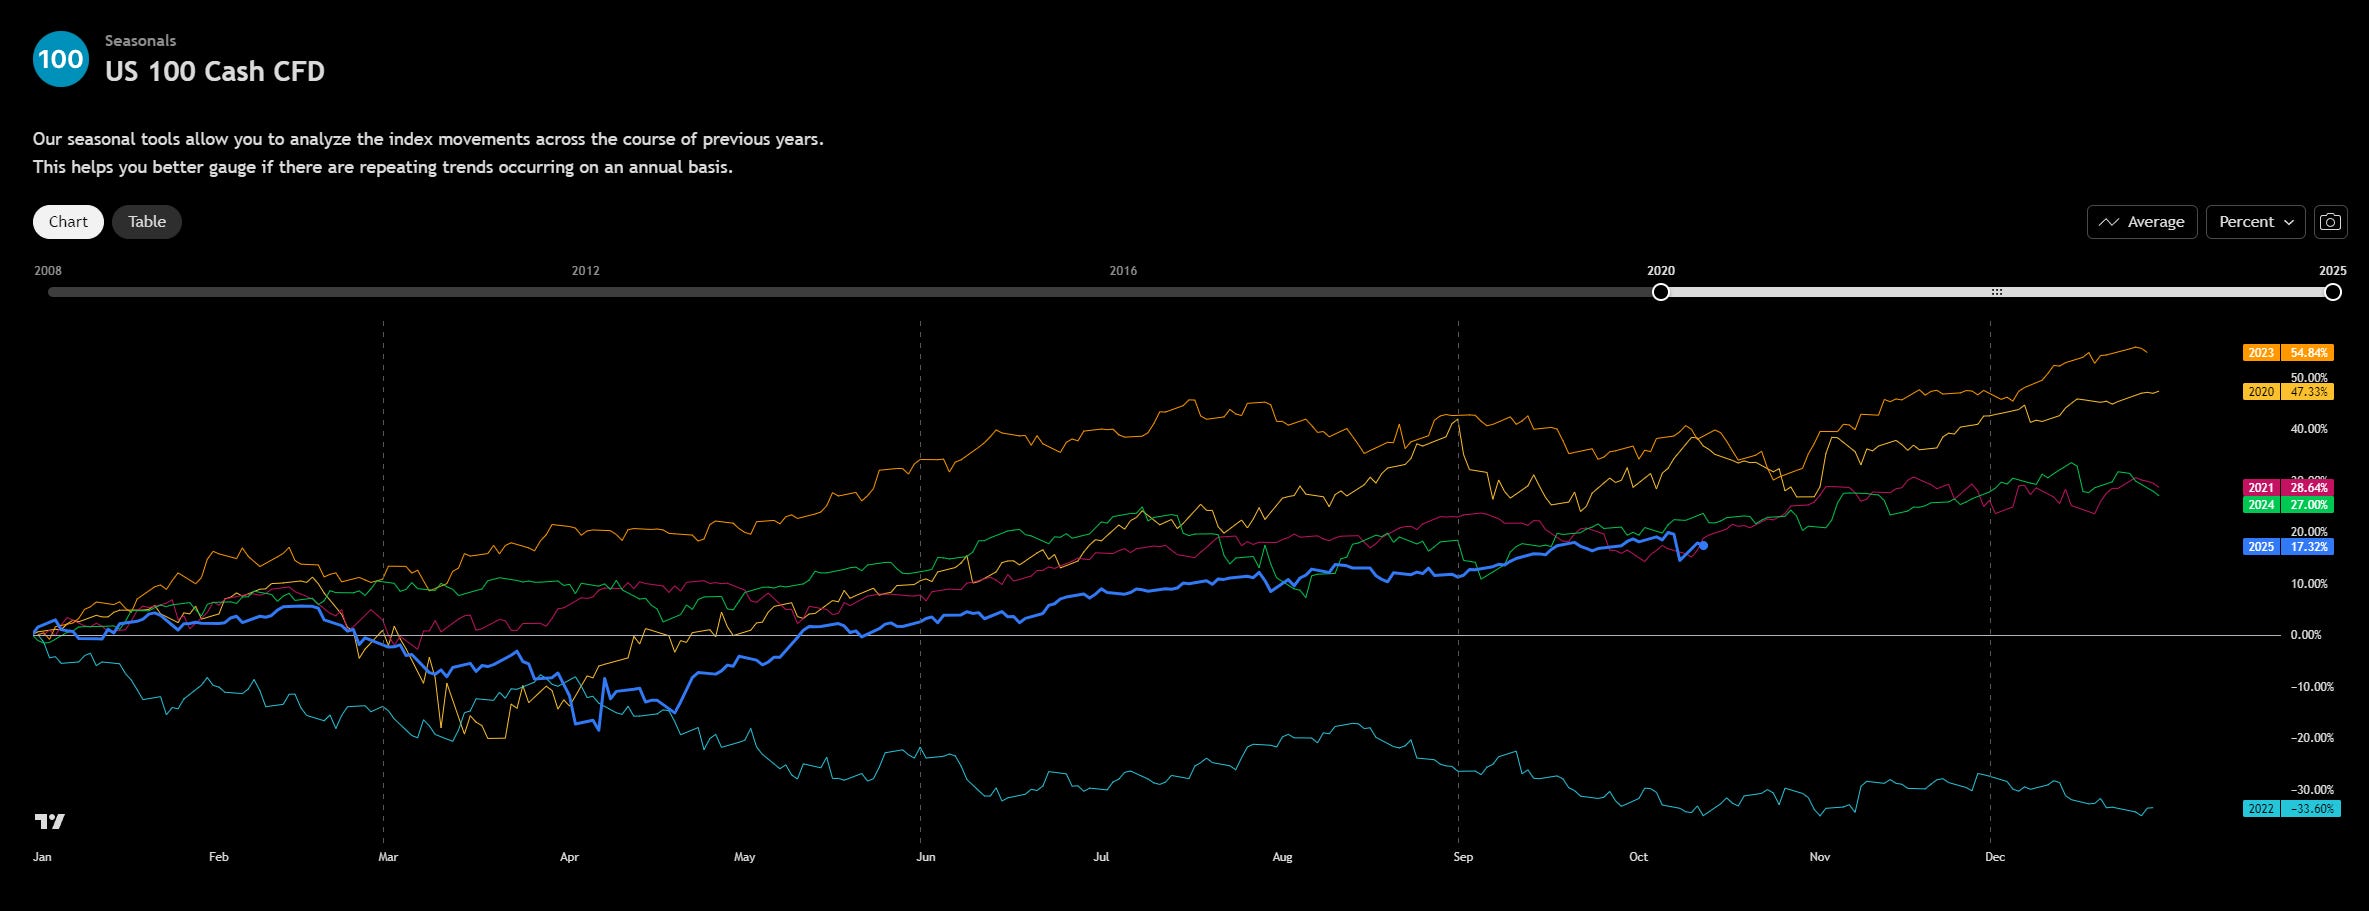
Figure 2: Seasonality Trend for Nasdaq for 2020-2025.
₿ Bitcoin’s Technical Posture After the Flush
While the geopolitical news triggered the recent drop, the move served a critical technical function related to institutional positioning and market inefficiencies. The outlook for Bitcoin remains constructive, provided the NASDAQ performs well in line with Q4 seasonality.
The IBIT Gap: Institutional Magnets and Inefficiencies
A significant focus has been on the IBIT chart, the ETF which big institutions use to position in Bitcoin. IBIT is considered the main source of institutional funds in the market.
When Bitcoin jumped in IBIT and went to all-time highs, it left a gap open on the monthly chart. This open gap caused discomfort and a reluctance to open new long positions. Historically, when IBIT has these kinds of open gaps, they act as a source of magnet, where price gravitates towards when a pullback starts.
Past Example: A previous drawdown occurred specifically to fill an open gap on the IBIT chart.
Current Situation: The recent price action, triggered by the Trump tariff news, perfectly filled the open monthly gap.
It is very useful that this open gap on the monthly and quarterly charts has been filled. This gives the market more of a “green light,” as the inefficiency has been neutralized. This suggests the market has no technical reason to go down anymore, and funds can now start accumulating Bitcoin in accordance with the NASDAQ’s anticipated move.
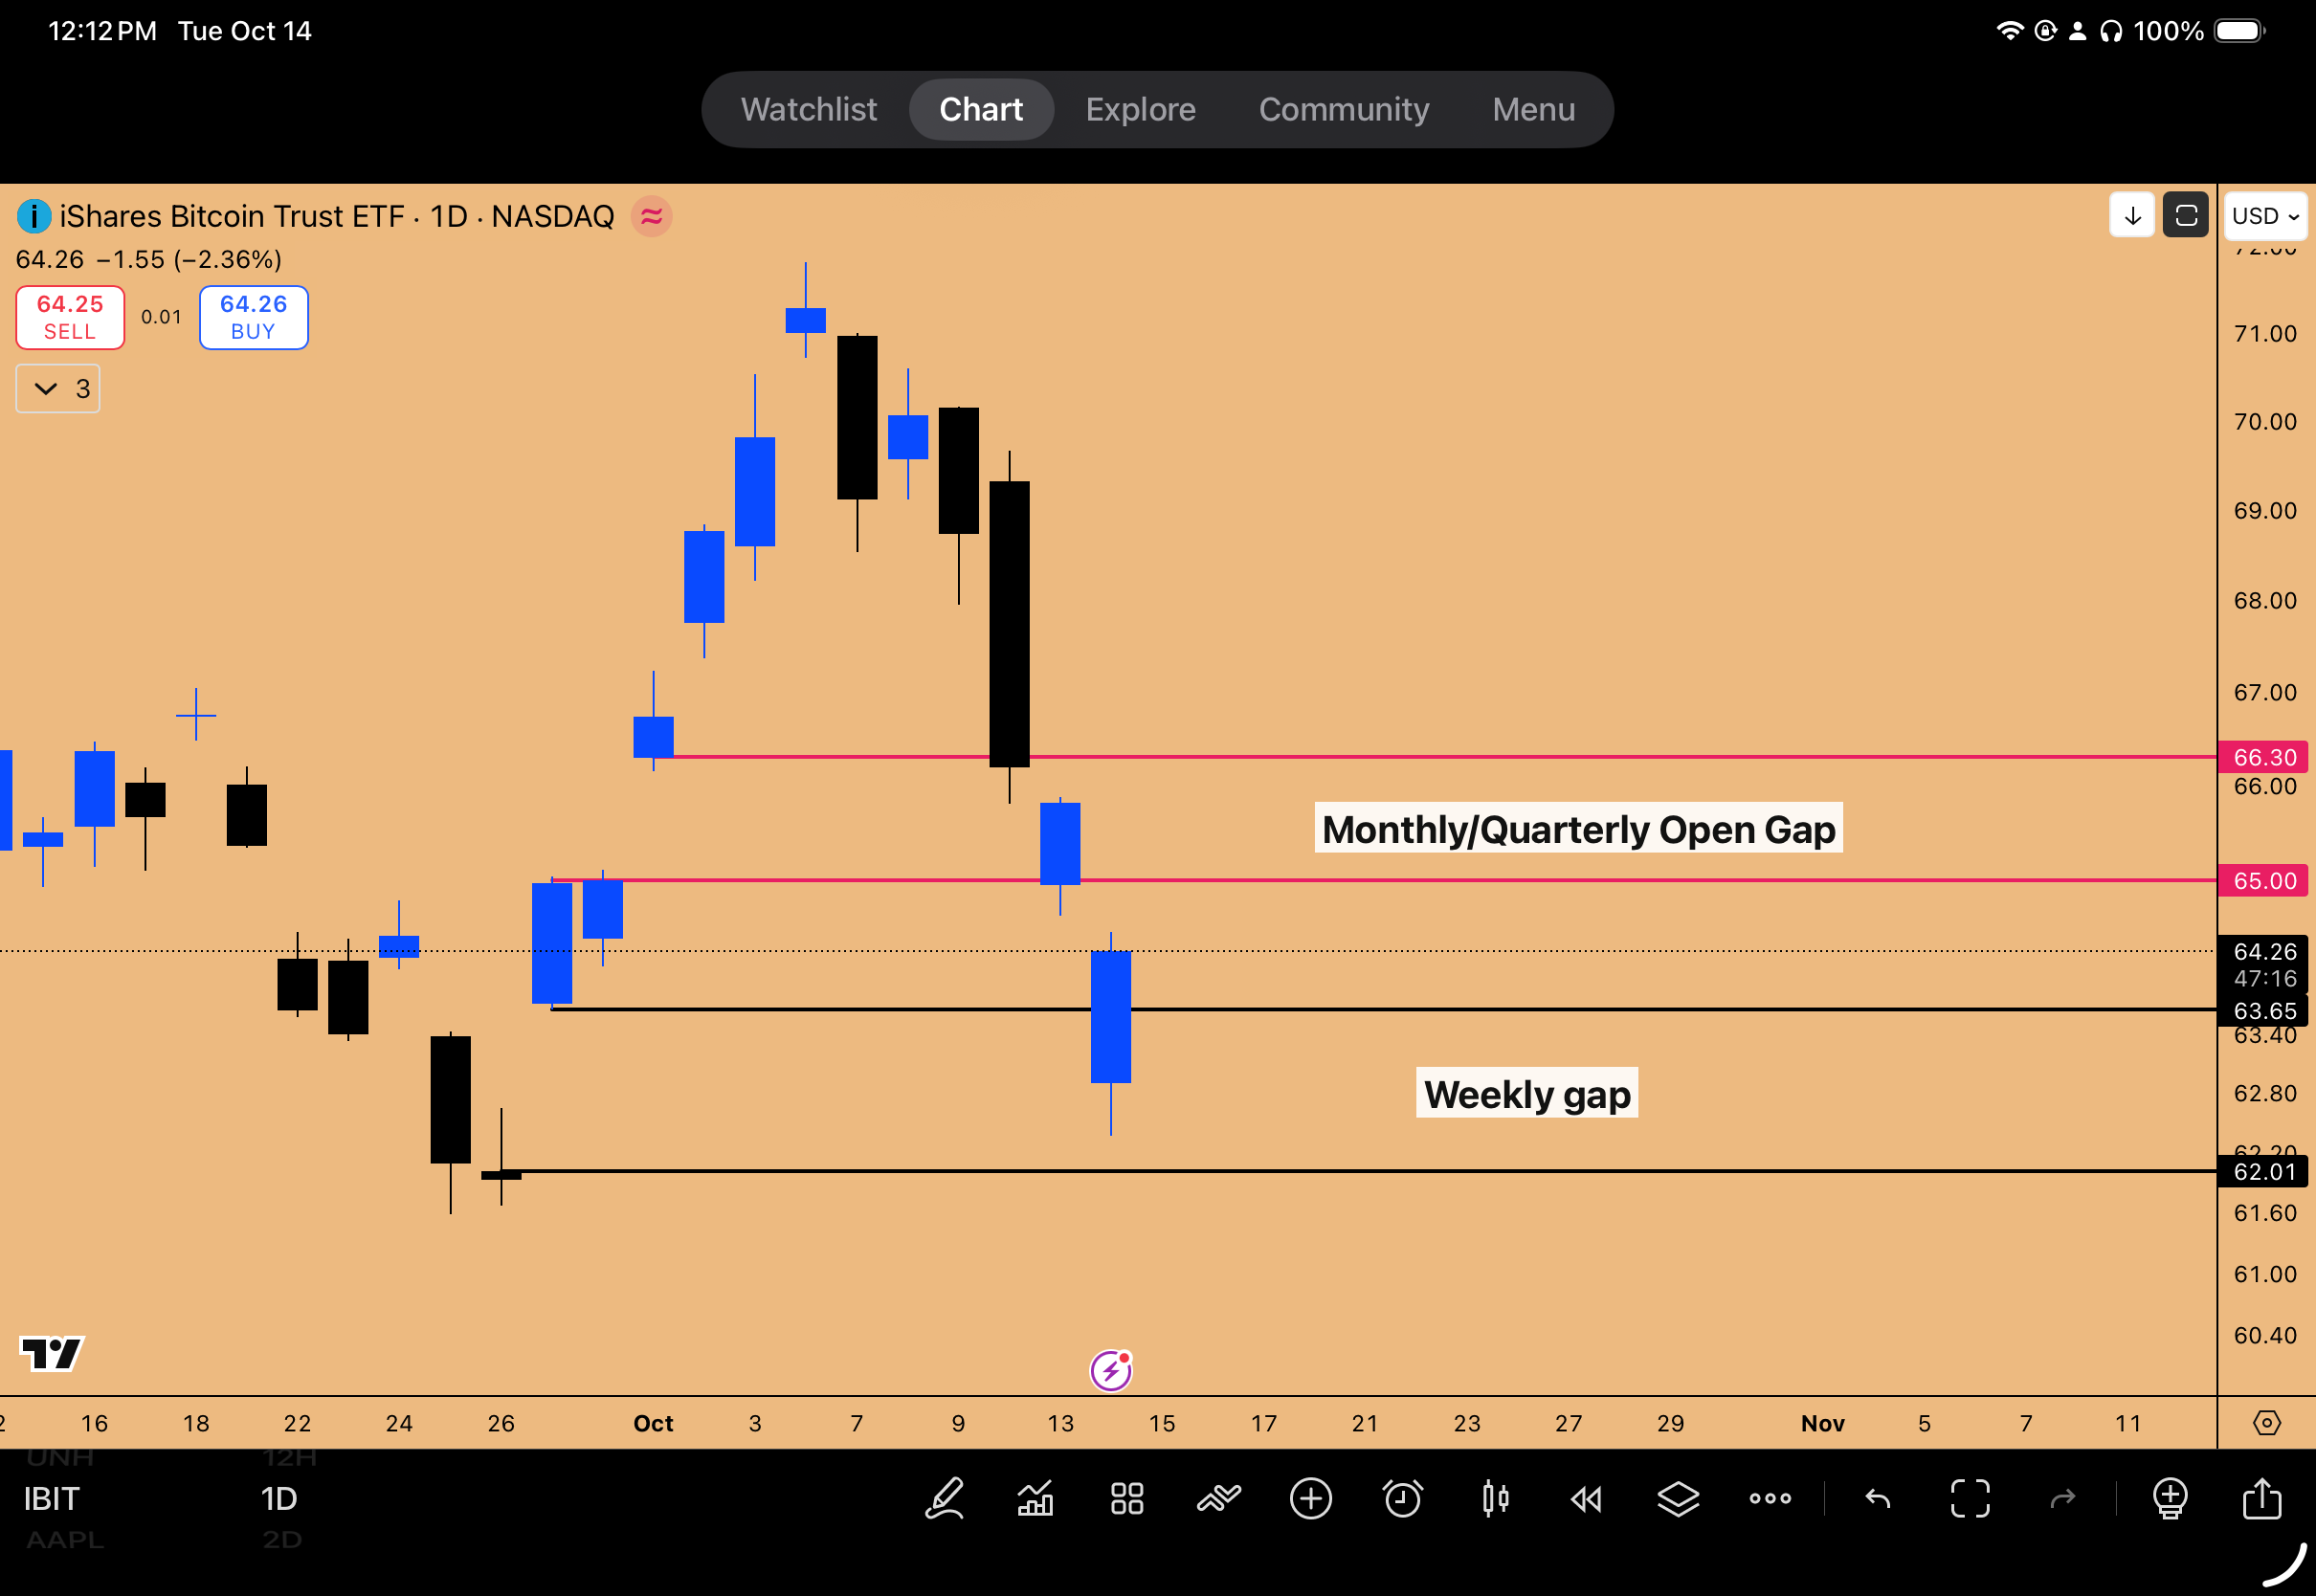
Figure 3: Open inefficiencies in IBIT (Bitcoin ETF).
Liquidation Events and Structural Bottoms
On Friday, a massive liquidation event occurred, where $19 billion worth of long positions were liquidated. The perspective shared is that there will not be a second liquidation event of similar magnitude (e.g., another $10 billion).
What generally happens after these kinds of liquidation events? The market tends to find some kind of a structural bottom.
Historical Example: After a past liquidation event (marked by a large wick), the market did not go substantially lower (only a 4% further drawdown). Instead, it went sideways, developing a consolidation box for 40 days. Eventually, it broke out of that box and rallied to new all-time highs.
This pattern is expected to repeat. From a price action structure perspective, Bitcoin is in a consolidation zone.
Upper End: $123,000
Lower End: $108,353 (based on the December 2024 all-time high).
The expectation is that the 3-week support zone, a key S/R level derived from the past all-time high at $108,353, will hold. While the sideways movement is “annoying,” the eventual breakout is anticipated, likely during Q4 due to the seasonal strength of the NASDAQ.
Key Levels and Market Structure
Analyzing the market structure requires differentiating between timeframes.
Weekly Market Structure: The weekly structure is very bullish looking. Despite the massive liquidation event, the structure remains characterized by higher highs and higher lows. It is viewed as a volatility box, and going sideways does not make it bearish. As long as it trades above the major S/R level at $109,358, it is fine. To break the weekly structure, the market would need to break below $98,000.
Daily Market Structure: The daily structure has been broken. This is why the expectation is for sideways movement for the next week or two, until it can build a new structure and change the daily market structure back to bullish. It will take time; an immediate shot to all-time highs is not expected.
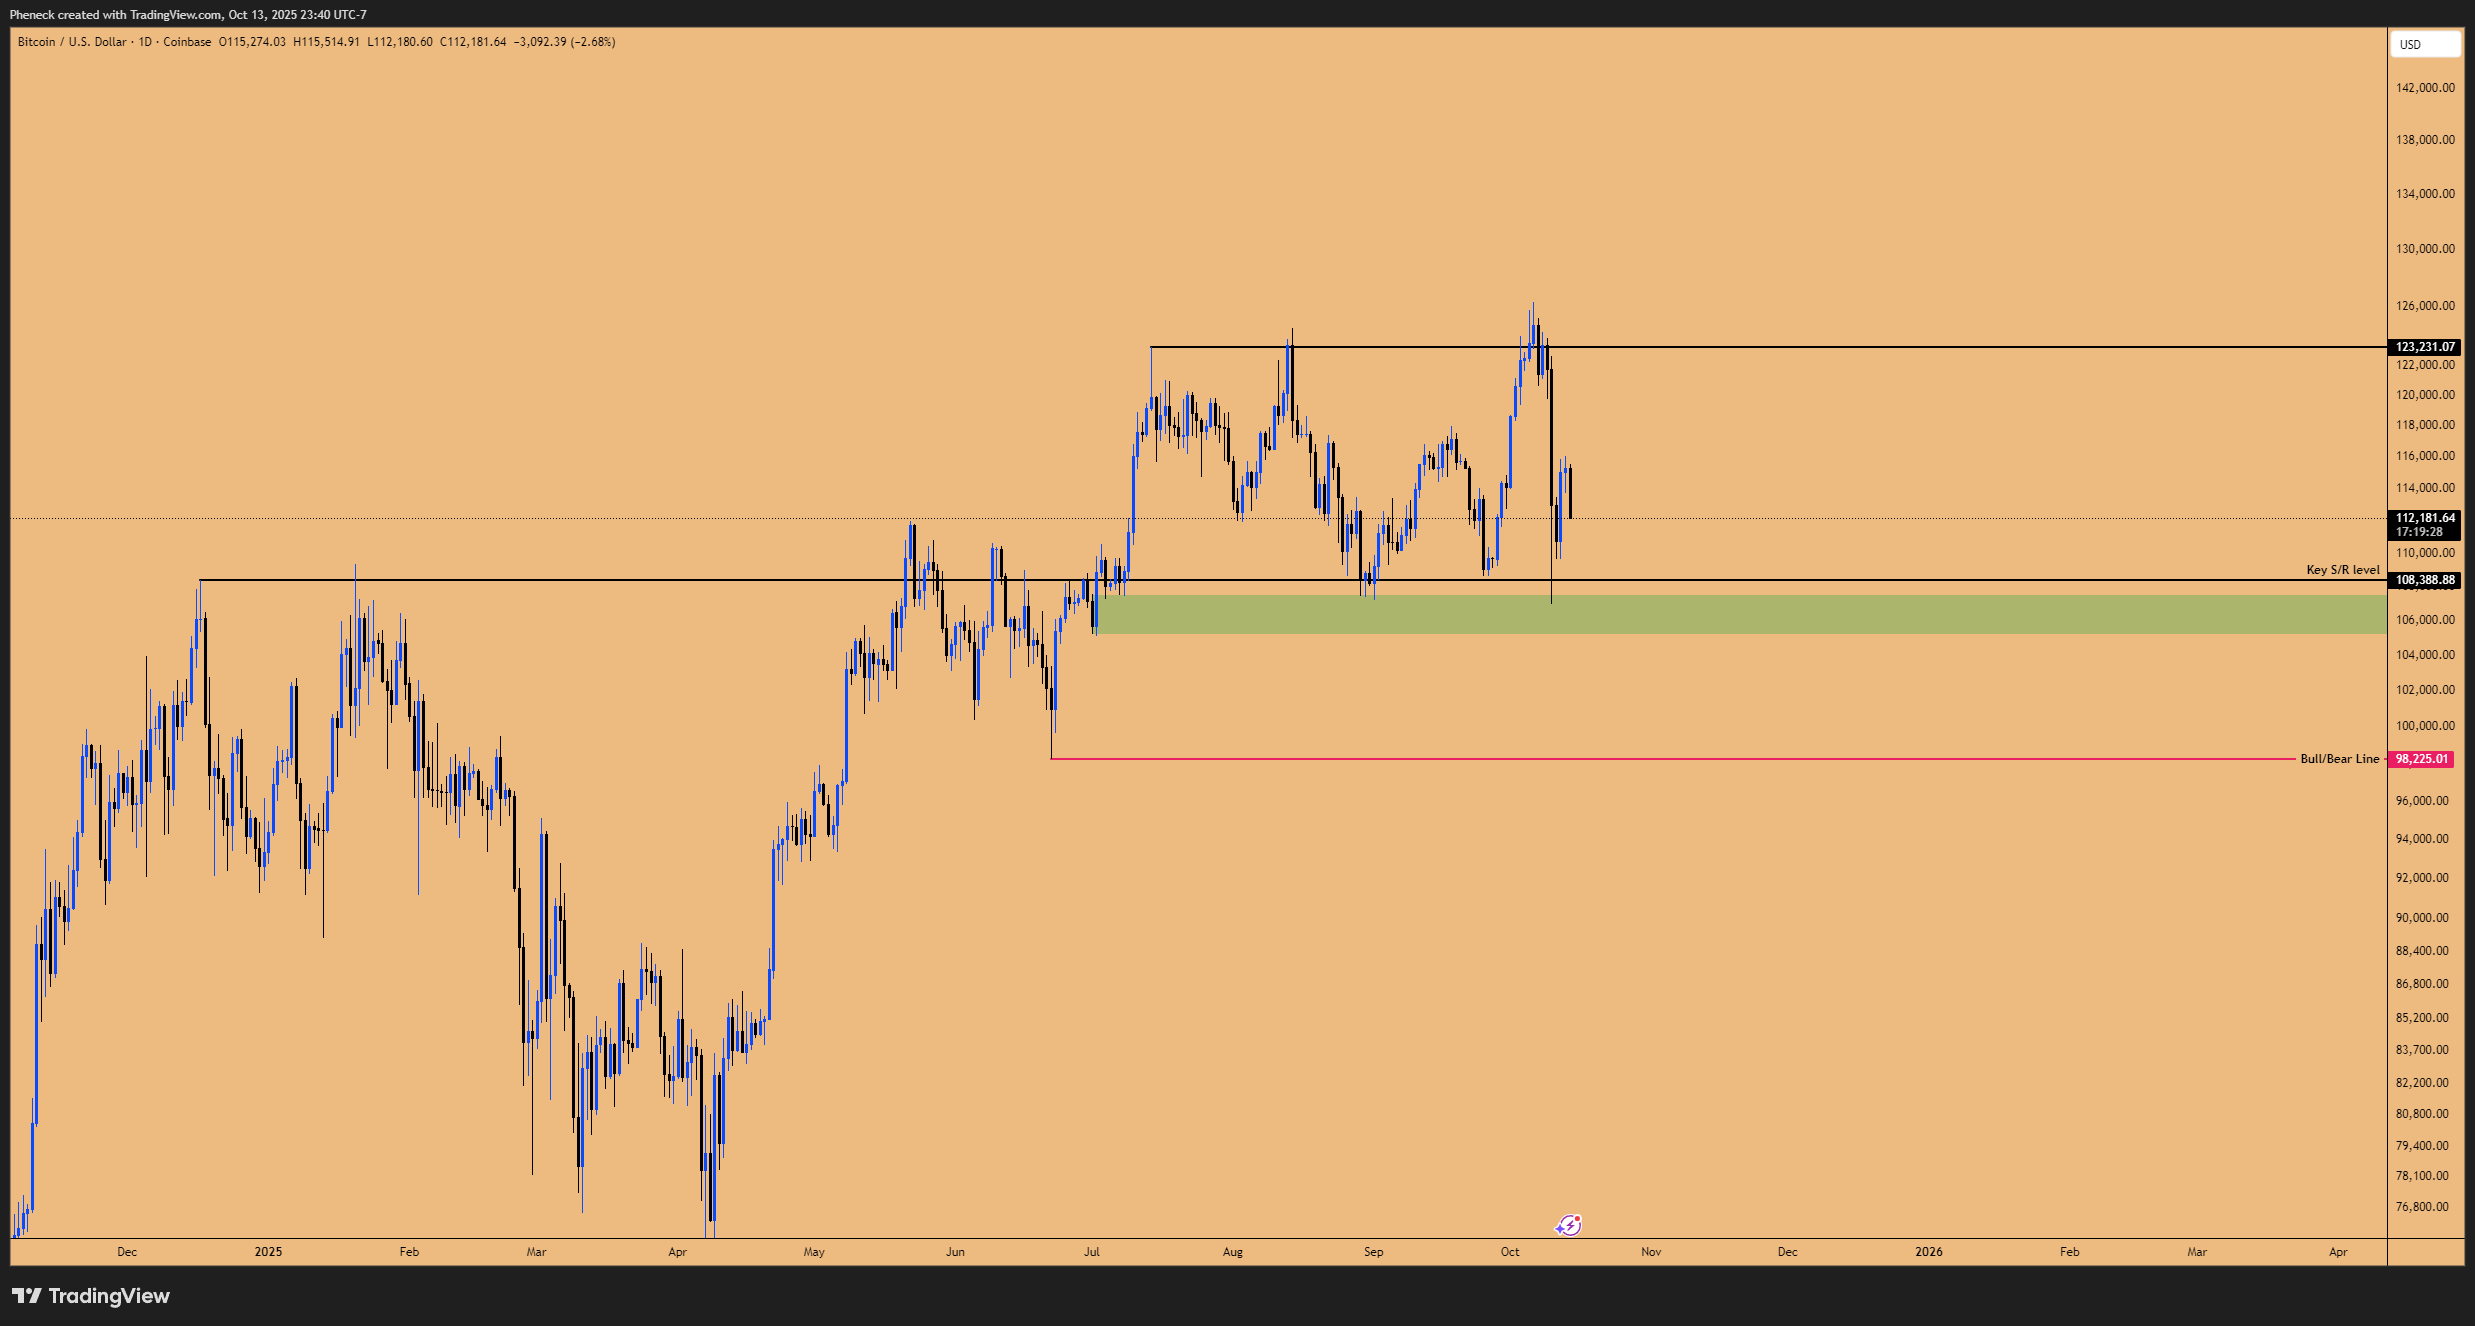
Figure 4: Price is defending key support zone at 107,000$ which is previous Monthly open S/R level.
Critical Support Levels:
Using the opens indicator reveals a critical support level: the monthly open and the quarterly open for the past quarter at $107,187. This is precisely what the market tapped during the liquidation event and where it is bouncing from. This is described as a “very thin whale support.”
This $107k level also coincides with a massive major trend line support, connecting lows dating back to the November 2022 bottom. This confluence provides confidence that this is a higher timeframe sideways price action, not bearish on the weekly chart, but not yet fully broken out bullish either.
The Channel Pattern and NASDAQ Mirroring:
Based on the current structure going into Q4 2025, following a channel pattern, the expectation is for expansion to the upper trend line. This behavior is often seen in the NASDAQ index. When NASDAQ reclaims trend line support, it starts targeting the upper trend line resistance. The assumption is that Bitcoin will do the same thing. The expansion hasn’t started yet, but it is anticipated in Q4, which still has two months and 19 days remaining.
Ethereum’s Breakout Potential
The setup on Ethereum (ETH) is considered far better than Bitcoin’s. While Bitcoin is characterized as a sideways market for now, Ethereum is displaying a trending market structure.
The Inside Monthly Candle and Liquidity Sweeps
Ethereum is currently working through an Inside Monthly Candle pattern. During the pullback last week, the market rejected the inside monthly candle high, leaving it clean open. This was initially a warning sign, indicating a proper rejection in terms of a daily bearish order block.
However, the strategy for holding spot positions (entered around 4500) is long-term (next 6 months), making day-to-day fluctuations irrelevant as there is no liquidation risk on spot. A key observation in crypto markets is the tendency to leave equal highs up top, run the downside liquidity first, execute a proper liquidation, and then reverse to gun for the highs.
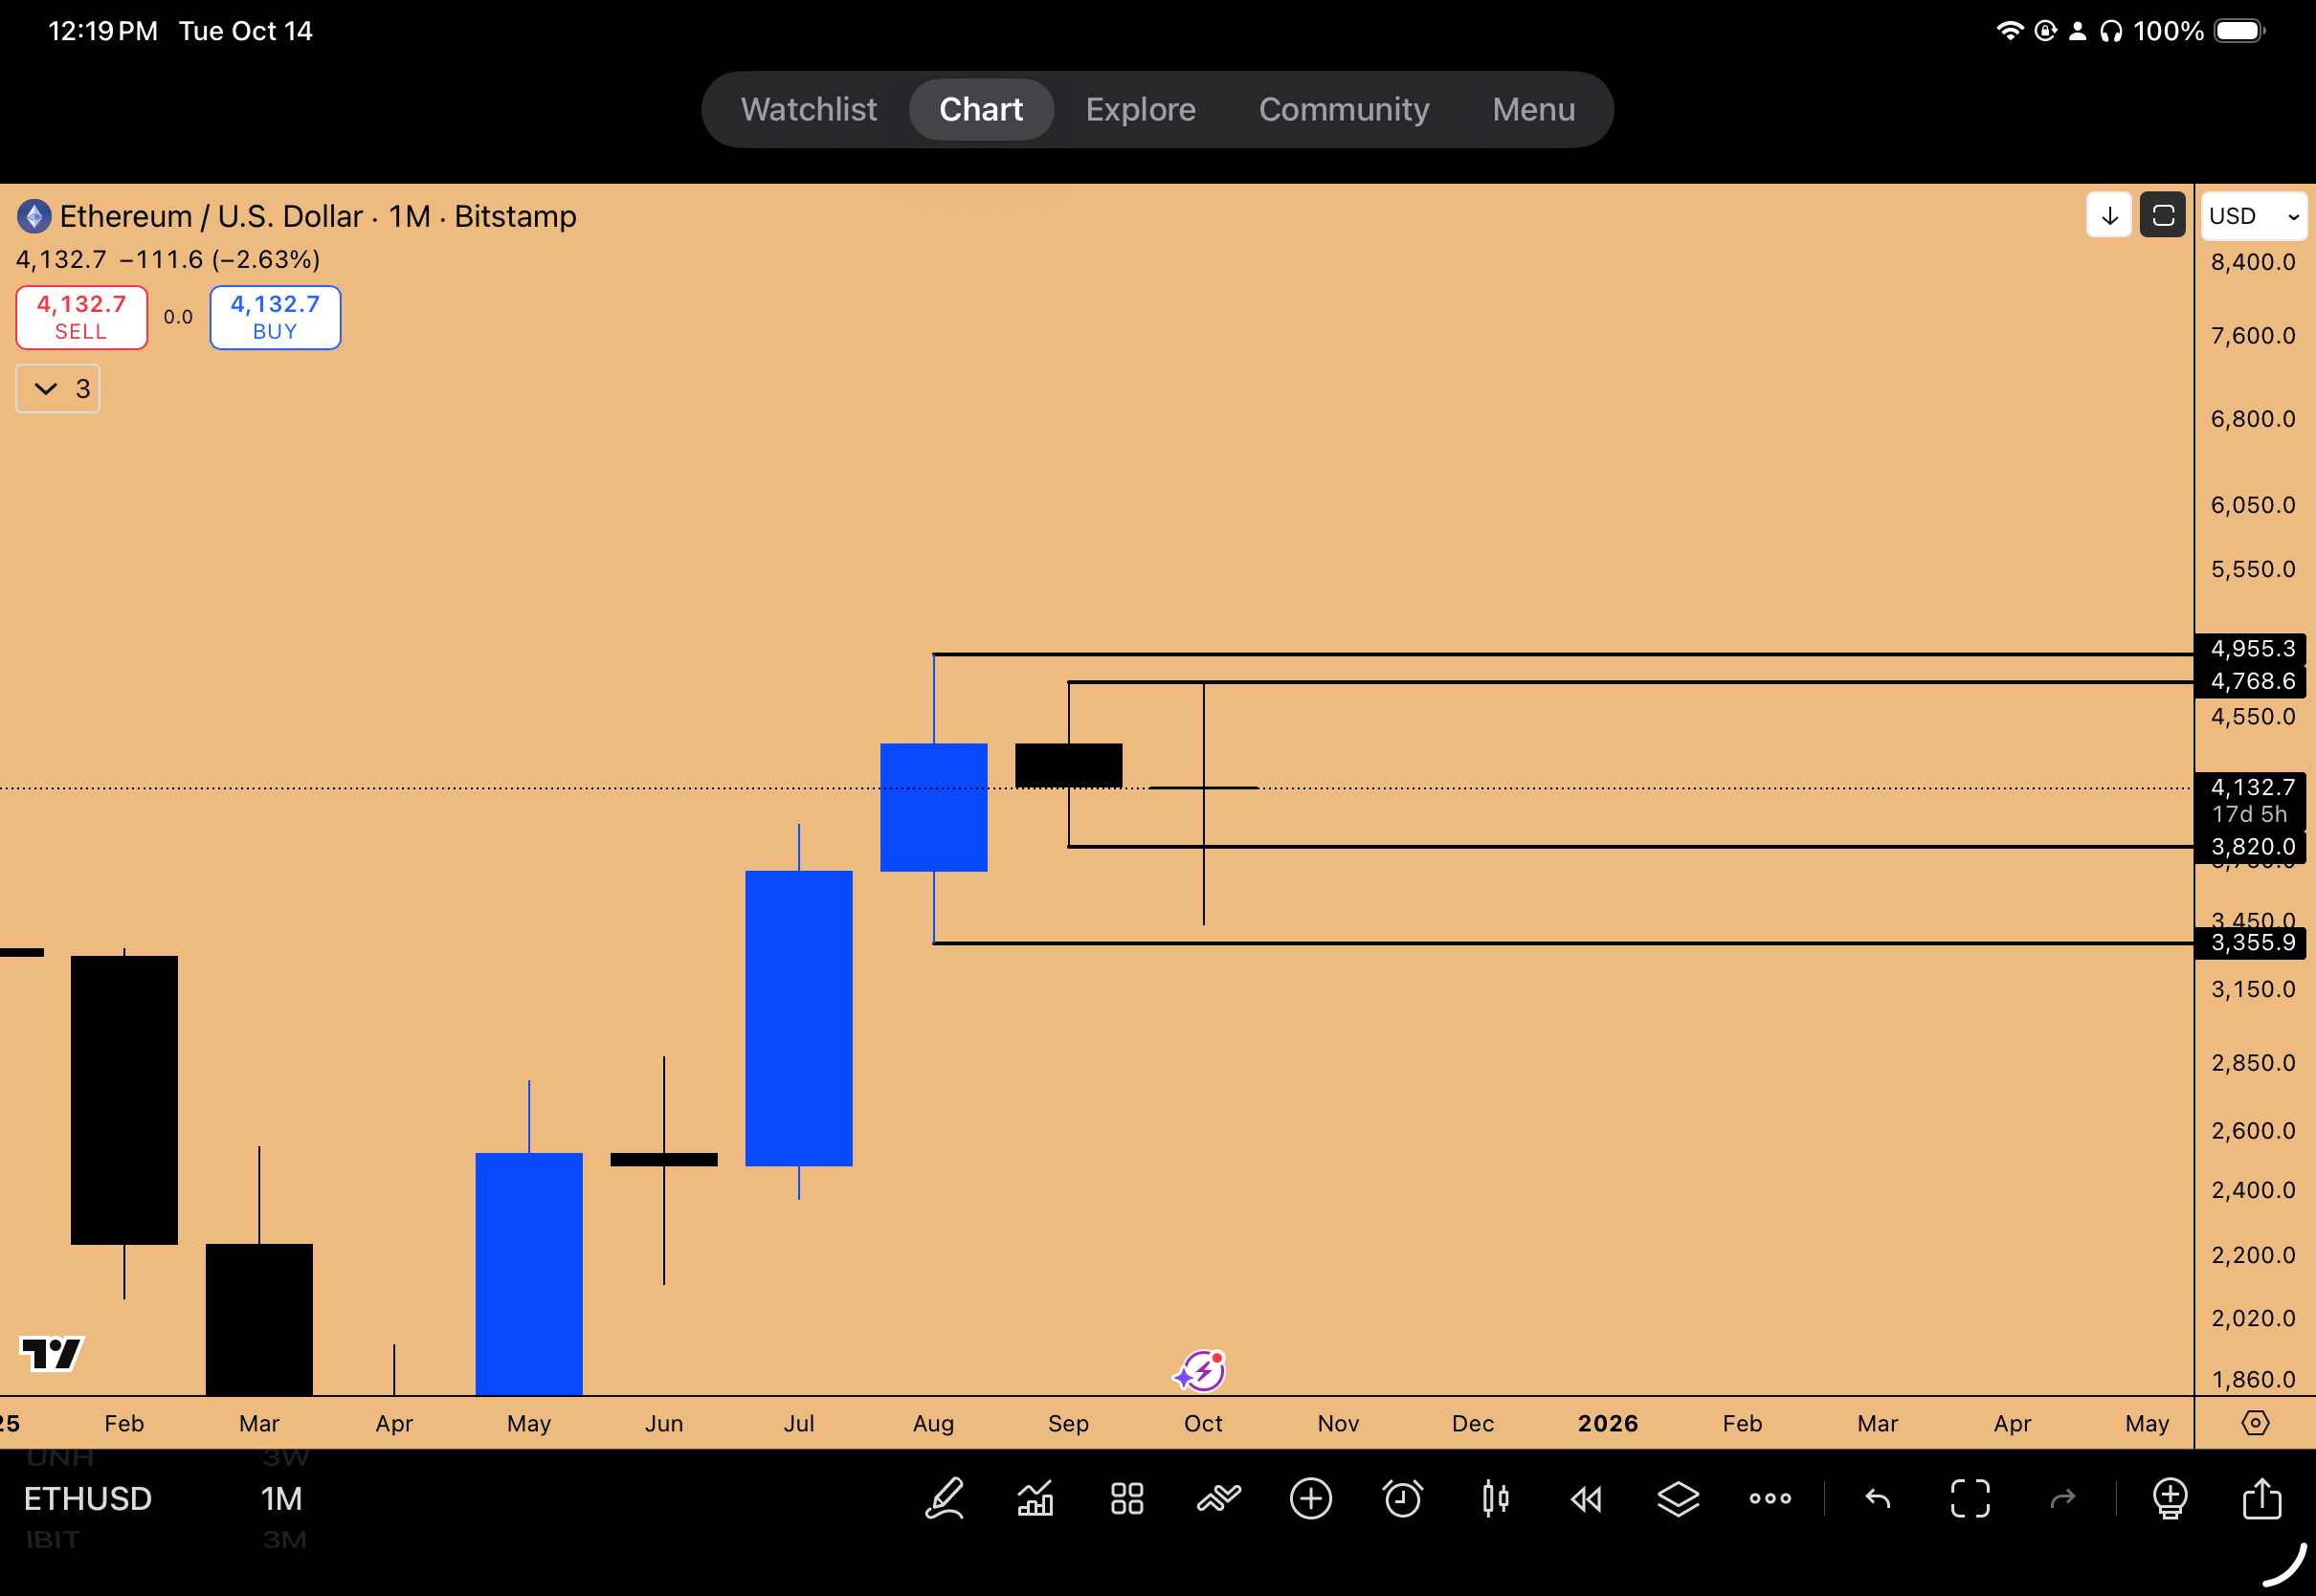
Figure 5: Inside Monthly Candle Failure pattern in play, waiting on confirmation once October, 2025 monthly candle closes
🕰️ Historical Parallel: Bitcoin’s 2024 Flagging Pattern
The current pattern in Ethereum is highly reminiscent of Bitcoin from November 2024.
In that instance, Bitcoin was flagging for 6 months. While Ethereum may not flag for 6 months, the pattern is very similar:
Equal Highs: Bitcoin left equal highs at $71,000.
Lower High: It created a lower high, tagging trend line resistance.
Liquidity Sweep: It went for the downside liquidity first in a very fast fashion.
Reversal and Consolidation: It rejected the low, bounced higher, pulled back to a higher low, and filled more space in the pattern.
Breakout: Going into the November presidential elections, a massive breakout occurred.
This back-and-forth consolidation is what builds energy for the breakout move. This energy buildup is very prevalent in the current Ethereum chart pattern.
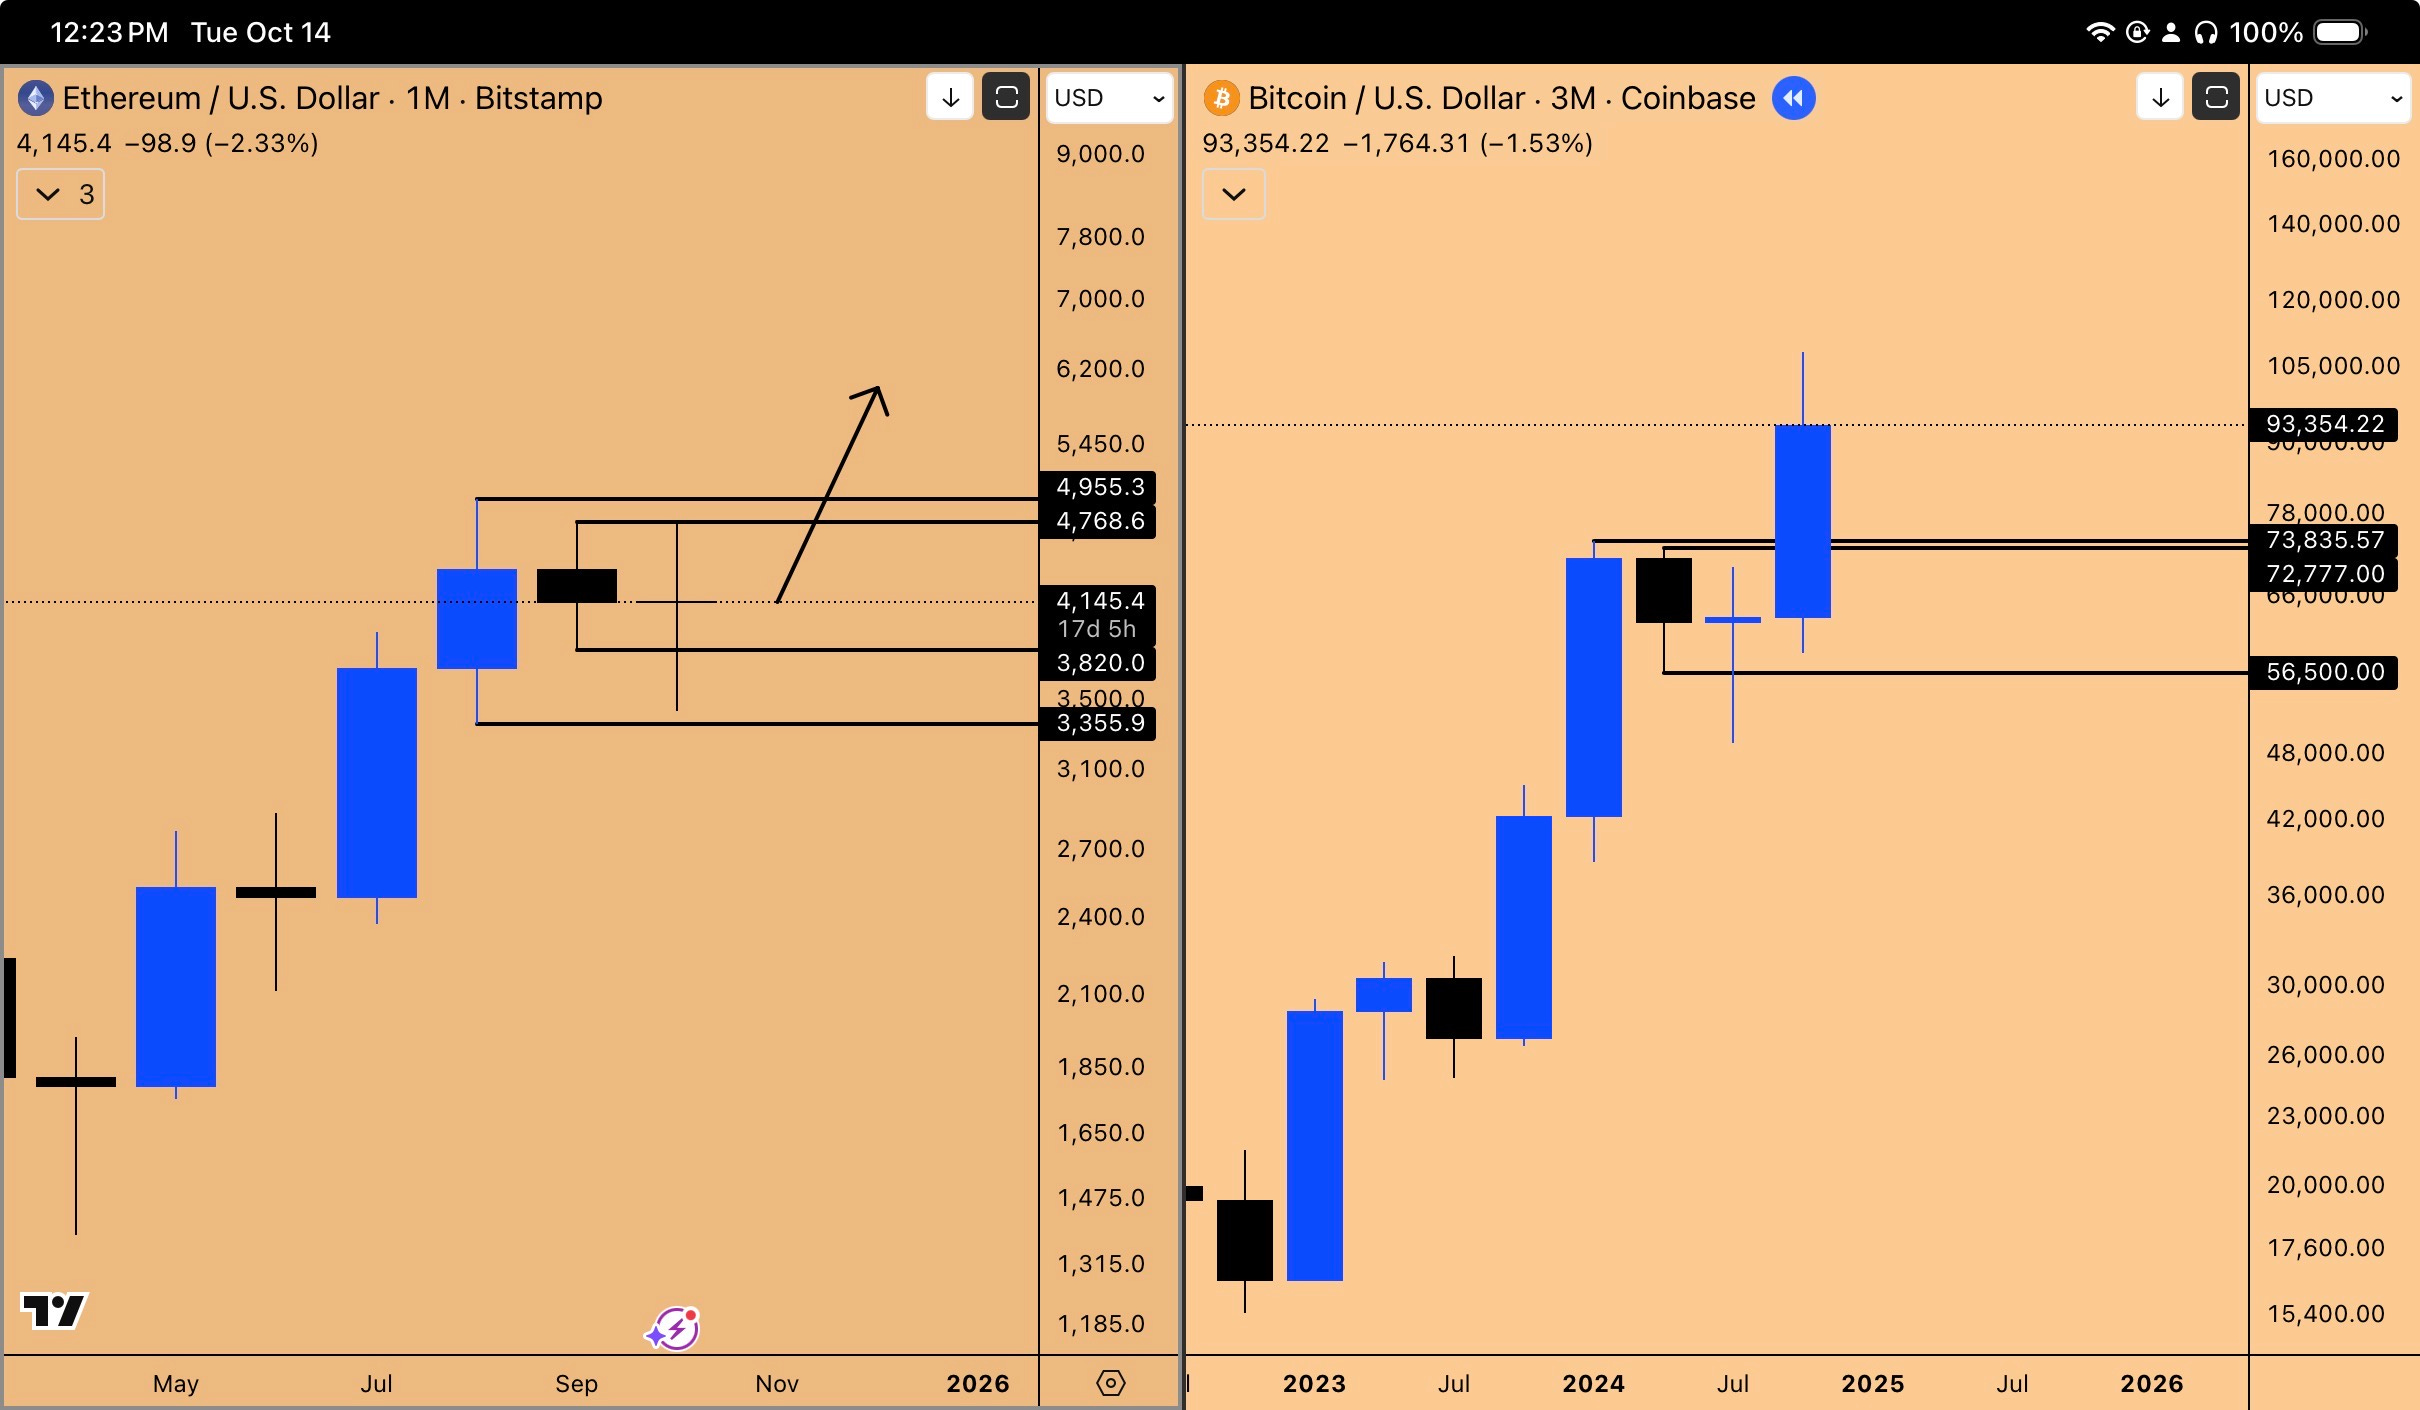
Figure 6: ETHUSD 1-month vs BTCUSD 3-Month. Similar Inside Bar Failure pattern in formation, resonating the price fractal in play
Timing the Expansion and Key Failures
The current expectation is that Ethereum will respect the trend lines, potentially bumping into resistance, pulling back, and filling the pattern a bit more. The breakout catalyst is anticipated to be the Big Tech earnings reports at the end of October.
The strategy is not to chase Ethereum here but to give it time to confirm the Inside Monthly Candle Failure. The market just took out the inside monthly candle’s low. The expectation is that it will confirm this as a failure this month, and the next month (November) is when the proper expansion to the upside will happen.
This pattern is also similar to what Bitcoin did on the Quarterly Chart previously:
Bitcoin took out the inside quarterly candle low.
It spent the entire quarter closing as a failure.
The next quarter (opening in October) is when the expansion started.
Ethereum is replicating this pattern on the monthly chart. It has 18 days left to confirm the failure.
Higher Timeframe Structure and Stops:
While Bitcoin’s status regarding the previous quarterly candle low may be debated, Ethereum has definitively not broken its previous quarterly candle low, which sits at $2376. This level is being used as a mental stop-loss for spot positions.
The assumption is that the bottom wick for the new quarterly candle is now in, and expansion to the upside will begin, likely in November after two weeks of sideways digestion. Furthermore, Ethereum is also confirming an Inside 3-Week Candle Failure pattern. If this confirms over the next 13 days, it provides high conviction for a long position targeting the next 3-week upside expansion.
ETH/BTC Analysis
The ETH/BTC pair is very interesting. It came down to test a key support zone and rejected it. The same pattern present in ETH/USD is also present in ETH/BTC: the Inside Monthly Candle Failure. This reinforces the thesis that ETH will go higher because ETH/BTC is expected to go higher. A noted weekly FVG (Fair Value Gap) also provides incentive to long Ethereum, though adherence to the plan of waiting for confirmation or a better opportunity to add leverage is prioritized (we will cover this live in the premium discord channel).
Advanced Leverage and Risk Management Strategies
A significant portion of the analysis focuses on how to utilize leverage responsibly while safeguarding capital, emphasizing a shift away from traditional crypto exchange mechanisms towards more robust financial instruments.
The Perils of Perpetual Futures
The use of perpetual future contracts on crypto exchanges is strongly discouraged. This stance was solidified back in 2022 following the FTX collapse. The inherent risk lies in liquidation events, such as the one witnessed on Friday.
Crypto firms often utilize cross-leverage functions that can lead to entire accounts being liquidated due to rogue events or volatility spikes. While traders might gather 80%-90% returns, it is not worth the gains accumulated if a one off event leads to losing everything you have worked hard to accumulate. The primary job of a trader, once a stack is grown (e.g., to $20k, $40k, or $100k), is to safeguard that capital and not let it go to zero due to conditions out of your control.
The desire for high leverage (10x, 20x) often stems from being UNDERCAPITALIZED. Traders try to make decent returns by risking more with small capital. While this can grow a small account, the risk of a single event wiping out all progress remains high.
Preferred Leverage: Prop Firms and Leveraged ETFs
If leverage is desired, there are safer alternatives that do not mess with your capital stock.
1. Prop Firms:
Using proprietary trading accounts (like FTMO or E8 Markets) allows traders to use the firm’s capital. If a liquidation event happens, it is not the trader’s personal capital being fully liquidated. The prop firm industry essentially copied the liquidation system from exchanges like BitMEX or Binance, knowing that people often blow accounts due to emotions and over-leverage. At least with prop firms, the capital being lost is theirs (or often just a demo account).
2. Leveraged ETFs:
Leveraged ETFs listed on the New York Stock Exchange (NYSE) or NASDAQ provide exposure without the risk of liquidation wicks common on crypto exchanges. They don’t have the same liquidity issues.
If Bitcoin goes up 5%, the ETF goes up 5%. Leverage can be applied on top of this. AI tools can be used to find these instruments.
BITX: A 2x leverage ETF on Bitcoin, trading since October 2023.
ETHU: A 2x leverage ETF for Ethereum listed on CBOE.
Example Application: If Ethereum is anticipated to break out next month, positioning in ETHU provides enhanced returns. In a past month where ETH returned 47%, ETHU returned 83% (close to the theoretical 94%). This is a foolproof way to access leverage (though lower than 10x or 20x) while ensuring the investment doesn’t go to zero due to exchange-specific issues.
The Options Advantage: Time in the Market vs. Timing the Market
A fundamental shift in trading philosophy involves moving towards options contracts, prioritizing long-term trends over short-term timing.
“Timing the market is very hard. But time in the market is far more useful than timing the market.”
Options allow traders to buy time. Instead of positioning for a day trade, the focus shifts to positioning for an entire 30-day or 90-day period (a month or a quarter). Day-to-day volatility (down 5% or 10%) becomes less relevant if the higher timeframe analysis is correct, as the market is expected to retrace and continue the trend.
Weathering Volatility:
Options provide the flexibility to hold positions through extreme volatility, which is nearly impossible with futures.
Example: The Tariff News: When the news broke on Friday that Trump was tariffing China 100%, the NASDAQ dropped significantly (QQQ down 4%). 99% of people would not have longed the market there, especially going into the weekend, fearing a gap down on Sunday futures open.
However, holding swing long positions in options allowed weathering this drop. When news broke over the weekend that the tariffs were being reversed, the futures opened with a 600-point gap up.
Traders using futures would have missed this entire move. With options, the paper drawdown suffered on Friday was significantly reduced (QQQ drawdown went from 4% to 1.67% at the open) without needing to time the bottom perfectly—which is practically impossible.
Shielding from News Headlines:
Options help shield traders from emotional reactions to news headlines. When volatility strikes, the mind starts racing (e.g., will China respond? will tariffs expand?). This fixation on news can cause traders to forget their technical plan developed during the quarterly analysis.
To shield from this, options are used with sufficient time behind them. The expirations currently being used are February 2026 or April 2026. This allows positioning through October, November, December, January, and February, ensuring that short-term news cycles (like the tariffs, or past conflicts like US/Iran conflict) become irrelevant in the longer term. The focus remains on the macro drivers: earnings, revenue expectations, and FOMC rate cut decisions, which add liquidity to the markets.
🛡️ Capital Preservation and Trading Psychology
If returns like 70% or 100% are deemed insufficient, the issue is not leverage; it is being undercapitalized. The best funds in the world (like Bridgewater Associates at 26%) yield around 30-50% a year.
Approaching the market with a mindset of needing 300% returns leads to failure. It forces traders to take setups that are not there. The adjusted trading style involves only taking A+ trade setups. This requires having capital on the sidelines and being comfortable waiting for the right opportunity (e.g., waiting for the monthly failure confirmation on ETH before positioning for November).
Trying to trade the current volatility (down 10%, up 10%) conditions traders to believe they must be in the market 24/7. This emotional engagement will eventually force mistakes, regardless of how robust the trading strategy is.
🔎 Equities Deep Dive: AI, Earnings, and Setups
The focus for the upcoming quarter is heavily weighted towards equities, particularly Microsoft, due to the impending earnings reports and the ongoing AI revolution. The recent volatility provides an opportunity to deploy capital into high-conviction setups.
VIX Spikes as Entry Signals
The drawdown on Friday caused the VIX (Volatility Index) to spike. This is something you want to see when positioning on a longer-term basis.
Past Example: The last higher timeframe long positioning occurred in April 2025 when VIX was at 53 or 60.
Current Situation: VIX touched 22 and is beginning to come down.
Historically, going into October and November, there is generally a spike up in VIX before it fades down. This spike is necessary for hedge funds and institutional managers to start opening long positions going into the earnings events and to set the stage for the November rally.
VIX Technical Setup:
There is an Inside 3-Week Candle on the VIX. The highs of this candle were just run to the upside. The expectation is that VIX will spend the next 10-11 days deflating this spike and close as a failure.
The next 3-week candle opens on October 27th, coinciding with Big Tech earnings. Once they beat earnings, VIX will start trending lower, targeting downside liquidity. VIX and the market are inversely correlated; when VIX goes down (as it did today by 12%), QQQ, SPY, Microsoft, and Apple go up. Fading the volatility spike is the entry signal.
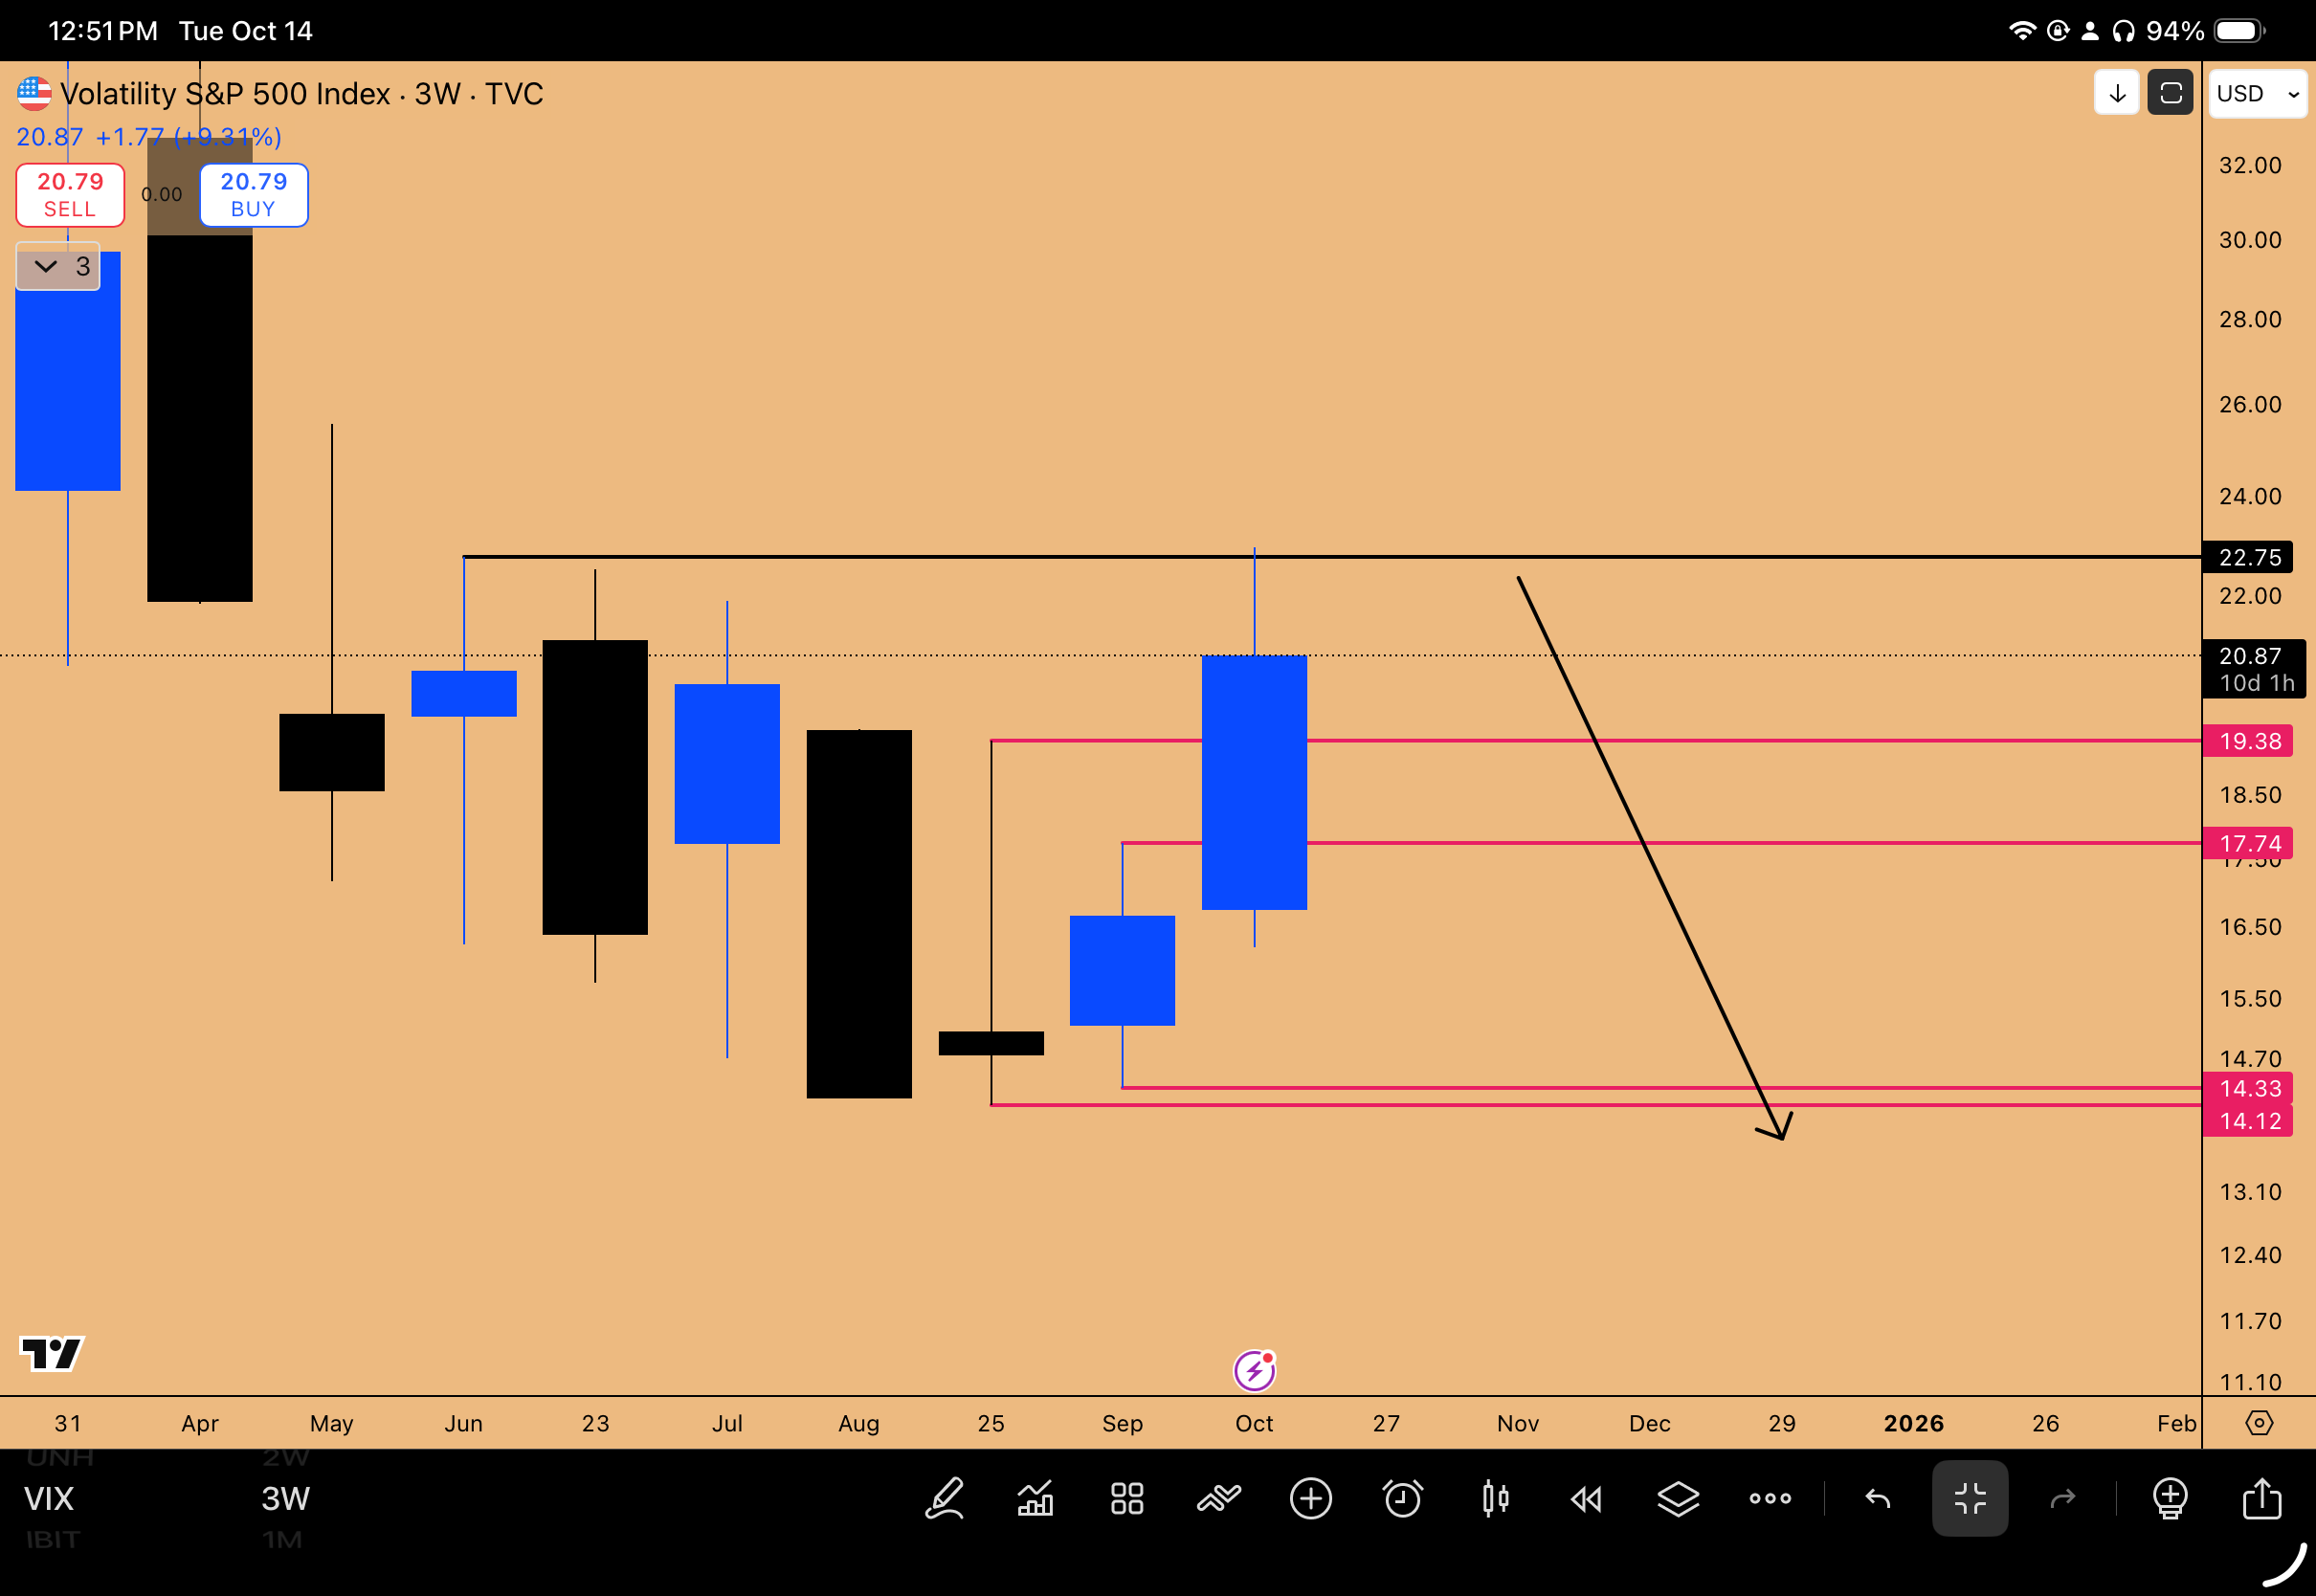
Figure 7: Inside 3-week candle pattern in play, expecting a failure to develop on this breakout, which would target liquidity to the downside
Microsoft (MSFT): The AI Epicenter and the OpenAI Deal
Microsoft is at the epicenter of the AI revolution. Recent research into the relationship between Microsoft and OpenAI has revealed critical details about their partnership, formalized in a September 2025 non-binding Memorandum of Understanding (MOU).
Key Findings from the MSFT/OpenAI Partnership Research:
Structure: OpenAI is not a subsidiary of Microsoft. It operates as an independent capped profit entity. The September 2025 MOU redefined the partnership, emphasizing mutual governance, technology access, and infrastructure diversification.
Infrastructure Reliance: OpenAI is reliant on using Microsoft Azure services at least 70% to 80% of the time (the remaining 20% is Oracle cloud). As OpenAI grows, Microsoft grows with it.
Exclusive Access: Microsoft gains early, preferential access to OpenAI innovations (like GPT-5). New models will be available first and exclusively in the Azure AI services studio.
Azure Exclusivity for API: OpenAI’s API remains exclusive to Microsoft’s Azure cloud services platform. Enterprises needing to work with large datasets using OpenAI models must go through Microsoft Fabric and the Azure OpenAI service. Microsoft charges fees for hosting the data and running the models.
The Blockbuster Financial Advantage: This is the critical insight. Based on the September 2025 MOU, approximately 49% of OpenAI’s future profits from any commercial activities will be given to Microsoft. This revenue will be reported in the Intelligent Cloud Services segment (Azure).
Earnings Implications:
This 49% profit share arrangement was implemented in September 2025. It was not present in the prior earnings report (July 30th, 2025). Therefore, Microsoft has not yet reported any profits based on this new structure.
The upcoming earnings report on October 29th, 2025, will be the first time this new revenue stream is reflected. This is also the first time AI-based revenue will be significantly reported in Microsoft’s earnings. Given OpenAI’s current valuation of $504 billion, the implications for Microsoft’s revenue growth are substantial.
MSFT Technicals and Historical Q4 Performance
Technical Analysis:
The higher timeframe pattern remains the Inside Monthly Candle Failure. The target remains $555 (the inside monthly candle highs).
Support Levels: Using the opens indicator on the two-month chart reveals stacked opens at $500.47. This is a very strong S/R level that the market defended during the recent dip. This region has developed into a very strong weekly support.
Rainbow Pattern: A Rainbow Pattern is forming on the two-day chart. This occurs when the weekly open, daily open, and monthly open all stack together, indicating a massive expansion move is coming (either up or down). Given the bullish monthly pattern, the breakout is anticipated to the upside.
Bull Pennant: For classical charting, a bull pennant or triangle formation is developing, which is common after vertical moves and signifies energy building for a severe breakout.
The trigger for this move is expected to be the earnings report. In the meantime, sideways action is likely.
Historical Q4 Performance Analysis:
A detailed analysis of Microsoft’s Q4 performance (the entire 3-month period: Oct, Nov, Dec) over the past 15 years (2009-2025) reveals a strong bullish tendency.
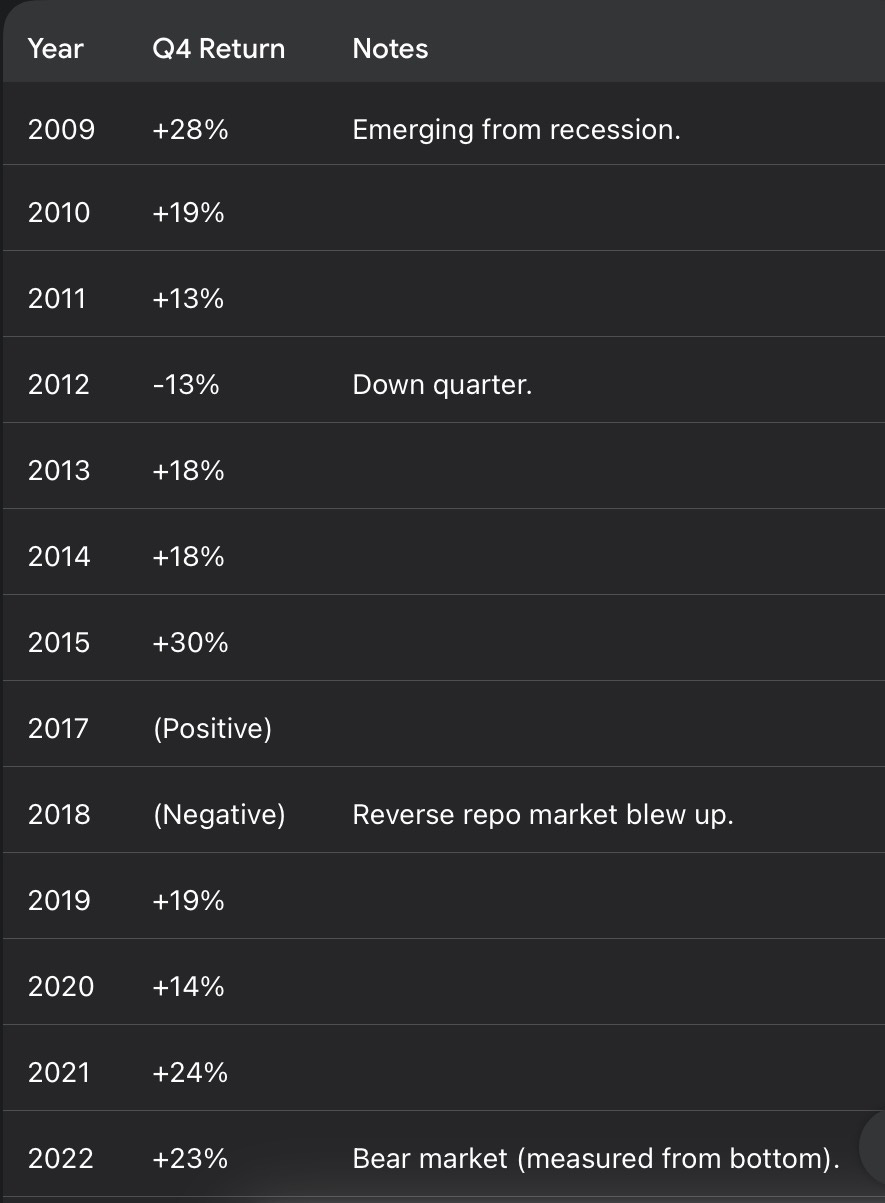
On average, Microsoft renders an 18% return in Q4.
Timing the Move:
Analyzing the daily charts within these quarters reveals that the majority of the move often happens in October, specifically due to the earnings report. Earnings gaps (gap ups) are consistently visible in the charts during the strong quarters.
You want to be present in the market before earnings comes in, not after. The earnings event itself is what provides the proper move.
Current Outlook and Positioning:
We are only one week into Q4 2025. So far, the upside move has only been 3% or 4%. If the historical average of 18% return plays out, Microsoft should be sitting at $604.
The positioning strategy is based on this statistical data, fundamental patterns (AI revenue), and technical setups. The goal is to capture the entire 18-20% run. Expirations are set for February 2026, positioning not just for Q4 2025 but also the beginning of Q1 2026. Patience is recommended, ignoring news headlines and letting the option contracts ride out until at least the end of November.
Meta (META): A High-Conviction Q1 2026 Play
Meta is identified as a very good opportunity for deploying capital. It is one of the larger tech companies that has undergone a sizable correction from its August 2025 highs.
Technical Analysis:
On the two-month chart, Meta has gone sideways for the past four months (since July).
It is trading above a strong support zone, identified as a proper 3-month support zone (based on a quarterly engulfing candle).
There hasn’t been follow-through to the upside yet on the quarterly chart.
Seasonality and Positioning:
The strategy is to position for the long term, capturing not only this quarter (Q4 2025) but also the next quarter (Q1 2026). The expiration target is April 2026.
Q1 seasonality for Meta is exceptionally strong:
Q1 2023: +73% return
Q1 2024: +53% return
Q1 2025: +33% return
For the past 3 years, Meta has delivered north of 30% return in the first quarter. Even historical data (pre-2022) shows strong Q1 performance (e.g., 2019 +35%, 2020 +22% pre-COVID).
The Setup:
Instrument: META Options
Expiration: April 17th, 2026
Strike: $850 (Current price ~715; All-time high 796).
Target: $860 (1.61 extension), potentially $950 (if 30% Q1 return occurs).
Allocation: 10% of the portfolio.
The expectation is that if it reaches the all-time high, it will push beyond it. The primary bet is on the Q1 2026 expansion, but a jump during the October 29th earnings event would be a bonus.
Correlation Note: Meta’s price action is eerily similar to Bitcoin’s (IBIT). Meta’s recent move below a key low seems to have triggered Bitcoin to top out and catch up with Meta’s downside movement.
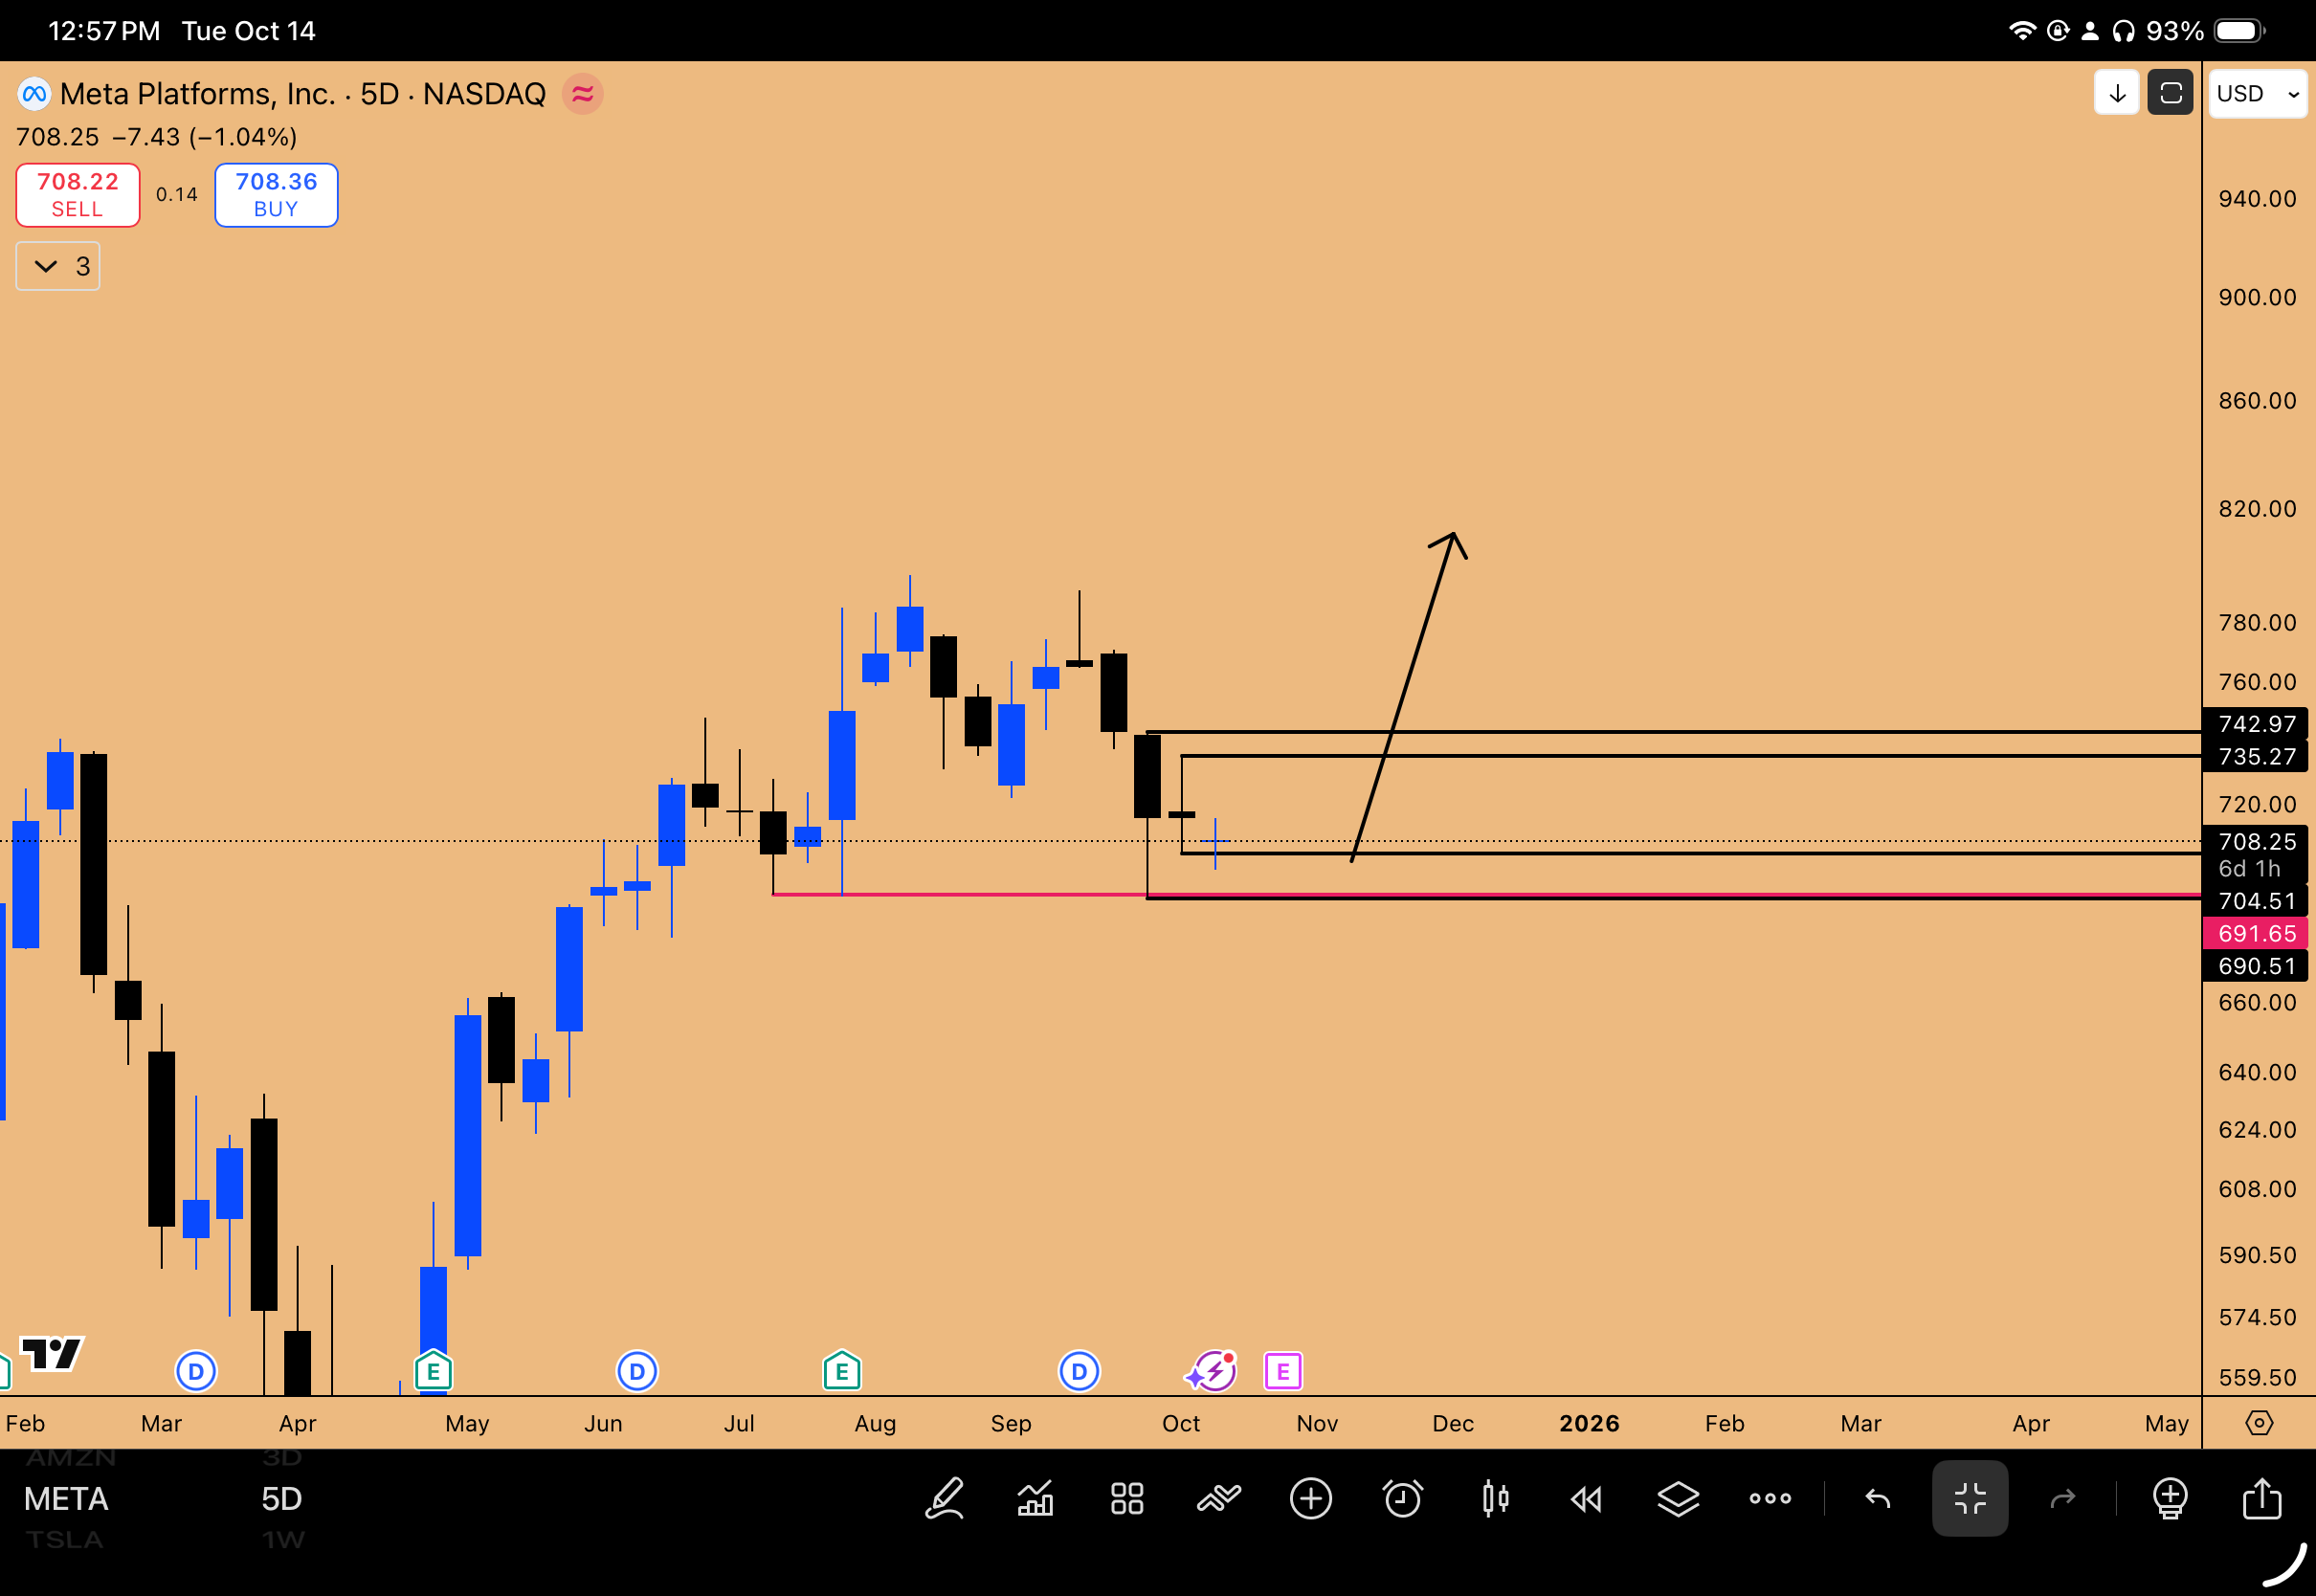
Figure 8: META Swing Long setup in play, targeting New All Time highs going into Q1, 2026
➕ Other Key Assets and Tariff Immunity
AI Stocks and Geopolitics:
It is crucial to understand that the business models for most AI companies (Microsoft, Netflix, Meta, Google) are largely unaffected by what is happening with the US-China trade war. Big players use these geopolitical events as an excuse to incite fear and buy positions from retail sellers at lower prices, knowing that revenue will accelerate regardless.
The only company potentially affected is Apple (AAPL), but even Apple often gets exemptions from tariffs (e.g., due to its $500 billion investment in US manufacturing). These companies are often immune because they comply with political desires (like bringing jobs to the US).
Specific Asset Analysis:
AVGO (Broadcom): AVGO announced a deal with OpenAI to buy new compute. The technical pattern in play was the Inside 3-Week Candle Failure (also inside two-week). This illustrates how patterns reflect positioning before the news comes out.
Oracle (ORCL): Also showing an Inside 3-Week Candle Failure. Despite the market collapse on Friday, Oracle retraced the move and closed as a bullish engulfing, showing how little AI companies care about geopolitics.
Amazon (AMZN): Holding a key S/R support zone. Amazon Web Services (AWS) is a major player in AI and a direct competitor to Azure; AWS is expected to lift the earnings report.16 The position remains open with a March 2026 expiration. Amazon and Meta move together; both are expected to bottom and move up together. The potential pattern is an Ascending Triangle, which will look bullish if earnings push it toward resistance.
JPM (JP Morgan): The quarterly candle has gone through its down wick, tagging support and rejecting it. It is a setup worth considering for quarterly upside expansion, but positioning now is a gamble because earnings are tomorrow (Oct 14th).
PLTR (Palantir): Currently consolidating.17 The pattern suggests waiting for a tap of the downtrend line support to enter. The catalyst is likely the earnings report on November 10th.
Costco (COST): Keep on the watchlist for 2026. If this quarter stays range-bound, it could print a Double Inside Quarterly Candle. This is a very strong pattern, suggesting no further downside and a high probability of long-term expansion, based on past instances of this pattern in Costco.
💡 Key Takeaways and Outlook
As we navigate the volatility of early Q4 2025, the overarching outlook remains bullish, heavily reliant on the upcoming earnings season. The recent market flush, triggered by tariff news, served to clear out inefficiencies (like the Bitcoin IBIT gap) and provide entry opportunities (as indicated by the VIX spike).
The primary catalyst remains the end of October, with Big Tech earnings and the FOMC meeting converging around October 29th-30th. The NASDAQ’s strong seasonality is expected to drive the market higher, with Bitcoin and Ethereum following suit. Bitcoin is consolidating above the critical $107k support, while Ethereum is building energy within an Inside Monthly Candle Failure pattern, poised for expansion likely in November.
In equities, the AI narrative is dominant. The revelation that Microsoft will begin reporting 49% of OpenAI’s profits in the upcoming earnings report presents a massive fundamental tailwind, supporting historical data that suggests an average 18% Q4 return for MSFT. Meta also presents a high-conviction setup targeting significant upside into Q1 2026.
Crucially, risk management strategies emphasize utilizing instruments that mitigate liquidation risks. Shifting away from perpetual futures towards leveraged ETFs and long-dated options (expiring Feb/April 2026) allows for capturing quarterly trends while prioritizing capital preservation. Time in the market remains superior to timing the market.
As we head into the thick of earnings season, watch for the confirmation of technical failures (VIX 3-week, ETH monthly) and the market reaction to the initial earnings reports.
What’s your take on the Microsoft/OpenAI revelation? Are you positioning for the Q4 rally? Share in the comments let’s discuss strategies. Subscribe for more market breakdowns!
Disclaimer: This isn’t financial advice – just market musings from the charts. Always do your own research.
If you enjoyed this deep dive, please share it with fellow traders!