

This Week Market Analysis: S&P 500 Targets 7900, Bitcoin’s Macro Decoupling, and the Yen Volatility Playbook


Executive Summary
The financial landscape of 2026 is shaping up to be a “year like we have never seen before,” characterized by unprecedented momentum in global indices and a significant structural shift in how major assets like Bitcoin correlate with traditional macro indicators. This comprehensive analysis, dissects the intricate layers of current market dynamics from the psychological pitfalls of “fat tail” trading errors to the high-probability technical setups in the S&P 500 and London Fix strategies.
The market has entered 2026 with a “manic rally” in Asian indices, with the Hang Seng and Nikkei already achieving 70% to 80% of their typical annual returns within the first month of trading. Historical data suggests that when January closes in the green, the S&P 500 boasts a 93% to 95% probability of finishing the year with an average return of 16%. This points toward a year-end target for the S&P 500 of approximately 7900, supported by a unique confluence of “big impact events,” including the 250th Anniversary of the United States, Donald Trump’s 80th birthday, and an anticipated stimulus check in June.
However, this bullish outlook is not without its traps. The report includes a rigorous post-mortem of a failed Bitcoin long position that serves as a cautionary tale on the dangers of emotional discomfort and “Type 2” errors. The analysis reveals how a missed 600-pip move in USD/JPY a “magnet area” created by a gap at 147.75 led to a forced entry in Bitcoin, overriding intellectual engrams and technical discipline. This underscores a critical lesson for 2026: in a high-volatility environment where even seasoned analysts are baffled, maintaining a “fire drill” readiness for dips is more vital than chasing breakouts.

Looking forward, the report outlines a “dip-buying playbook” utilizing market breadth indicators (stocks above the 50-day moving average) and the VIX over the 3-month VIX ratio. A spike to the 1.1 level in this ratio has historically signaled intermediary bottoms, offering asymmetric betting opportunities. Additionally, the Bitcoin market is facing a “full-blown decoupling” from the National Financial Condition Index (NFCI), suggesting a bearish trajectory toward levels under 60k unless a recovery above 90k-95k occurs. With the Bank of England meeting and NFP on the horizon, traders are encouraged to look toward the 4 PM London Fix as a pivotal anchor for pricing and supply-demand zones. Are you prepared to navigate a market that could finish the year up 16%, or will the volatility of “manic rallies” wash you out?

Post-Mortem Analysis: The Psychology of the Bitcoin Long Position
The Strategic Intent and Initial Accumulation
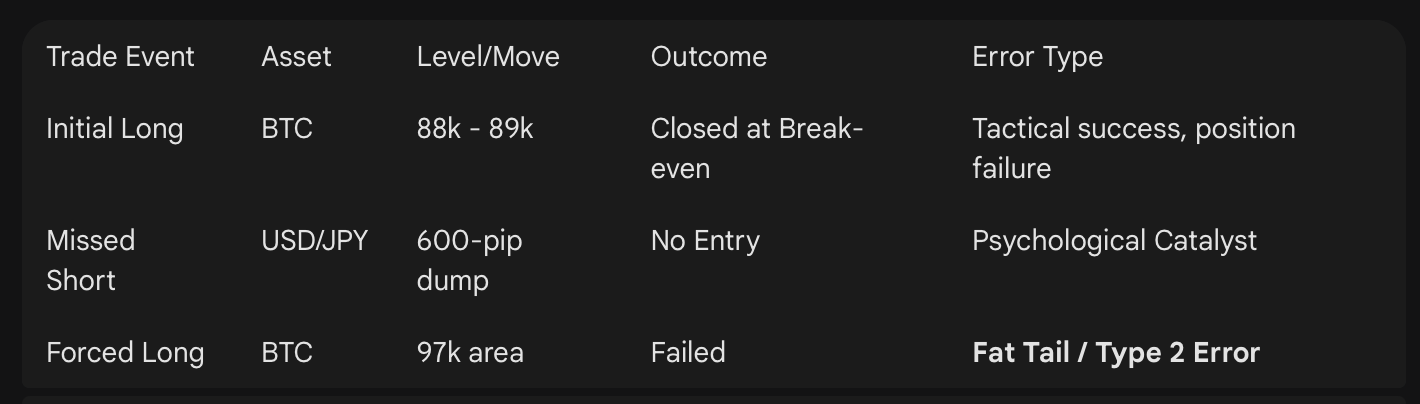
The journey into the current Bitcoin cycle began nearly two months ago, sparked by a pivotal capitulation move in mid-to-late November 2025. This move provided the necessary technical confirmation to begin aggressive accumulation. The initial strategy centered around building a position near the 88k and 89k levels, with the asset eventually surging toward 97k. At this juncture, the setup appeared promising, aligning with the expected path of the six-week cycle.
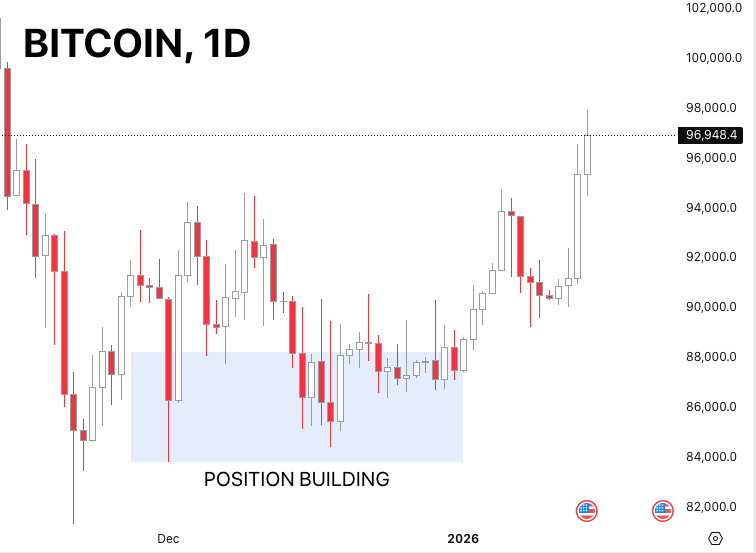
However, the “global pickup” required to attack the psychological and technical milestones of 105k or 120k failed to materialize. While tactical trades alongside this position were closed in full profit, the primary position trading strategy suffered from a lack of momentum. Yet the market’s “meandering” nature eventually led to the core position being closed at break-even. The intent was to systematically lock in gains and add to the position upon a climb above the six-week cycle strategy levels, but the market had other plans, leading to a period of stagnation that tested trader’s resolve.
Identifying the Fat Tail Error and Psychological Traps
The real failure occurred at the start of the subsequent Fed meeting. While technical levels suggested another long opportunity, the trade was marred by a “fat tail error” a mistake the analyst had sworn to eradicate. This error was twofold: the trade was entered too early in the cycle, and it lacked the necessary macro alignment. Even though the risk-to-reward ratio was theoretically “insanely great,” the broader sentiment and macro lineup were absent.
The post-mortem reveals that this was not a failure of technical analysis but a failure of psychological discipline. The analyst became a “servant to the technicals,” overriding the intellectual knowledge that a later entry with more confirmation would have been safer. This “Type 2 error” was driven by an underlying emotional discomfort a “magnet” effect from a missed opportunity in another asset class. This serves as a stark reminder for 2026: even a high-probability setup can fail if the trader is “forcing” the move to compensate for previous missed gains.
The USD/JPY Catalyst: How Missed Gaps Drive Bad Decisions
The root cause of the Bitcoin error was found in the USD/JPY currency pair. Throughout Q4, the analyst had been tracking a massive gap-up at 147.75 that occurred around early October. In the Forex market, such gaps act as “magnets,” eventually being filled sometimes taking over a year, though usually much sooner. The anticipation of this gap-fill was a core part of the Q4 thesis.
On January 23rd, USD/JPY experienced a violent, 600-pip dump in just a few hours. This move happened so subtly and rapidly that the analyst was left on the sidelines. The psychological impact of missing a 600-pip move that was correctly predicted created an “emotional discomfort” that translated into impatience in the Bitcoin trade. The missed USD/JPY trade led to the “forcing” of a Bitcoin long because the trader could not sit comfortably with the missed opportunity. To succeed in the high-volatility 2026 environment, traders must upgrade their processes to ensure that a “missed move” in one asset does not lead to an “unnecessary risk” in another.
Currency Market Analysis: Navigating Yen Pair Volatility
The Manic Rally in Yen Pairs
The current state of the Yen pairs specifically USD/JPY, CAD/JPY, and GBP/JPY is described as a “manic rally.” These assets have been moving in a “relentless” upward trajectory, making shorting them an extremely high-risk endeavor that “nobody in their right mind” should attempt without significant confirmation. Despite the palpable existence of gaps like the 147.75 level in USD/JPY, the sheer strength of the trend has overridden the technical pull of those magnets.
The analyst attempted shorting AUD/JPY, managing a 60-pip profit before the trend resumed, ultimately leading to a break-even exit. This highlights the “violent” nature of these moves; when the correction finally comes, it is likely to be so swift that traditional playbooks may not suffice. The market is currently in a “trending” mode where the directional bias is so strong that even tactically “great” levels for shorts are being steamrolled.
The GBP/JPY Short and the VIX Correlation Failure
A specific tactical trade in GBP/JPY was attempted based on a dual thesis: a strong technical level and the anticipation of a VIX blowout. The VIX had been trading suppressed around the 16 level, and the analysis suggested a move toward the 20s or mid-20s, which typically triggers a “risk-off” environment. In such scenarios, Yen pairs usually “cool down” or retreat.
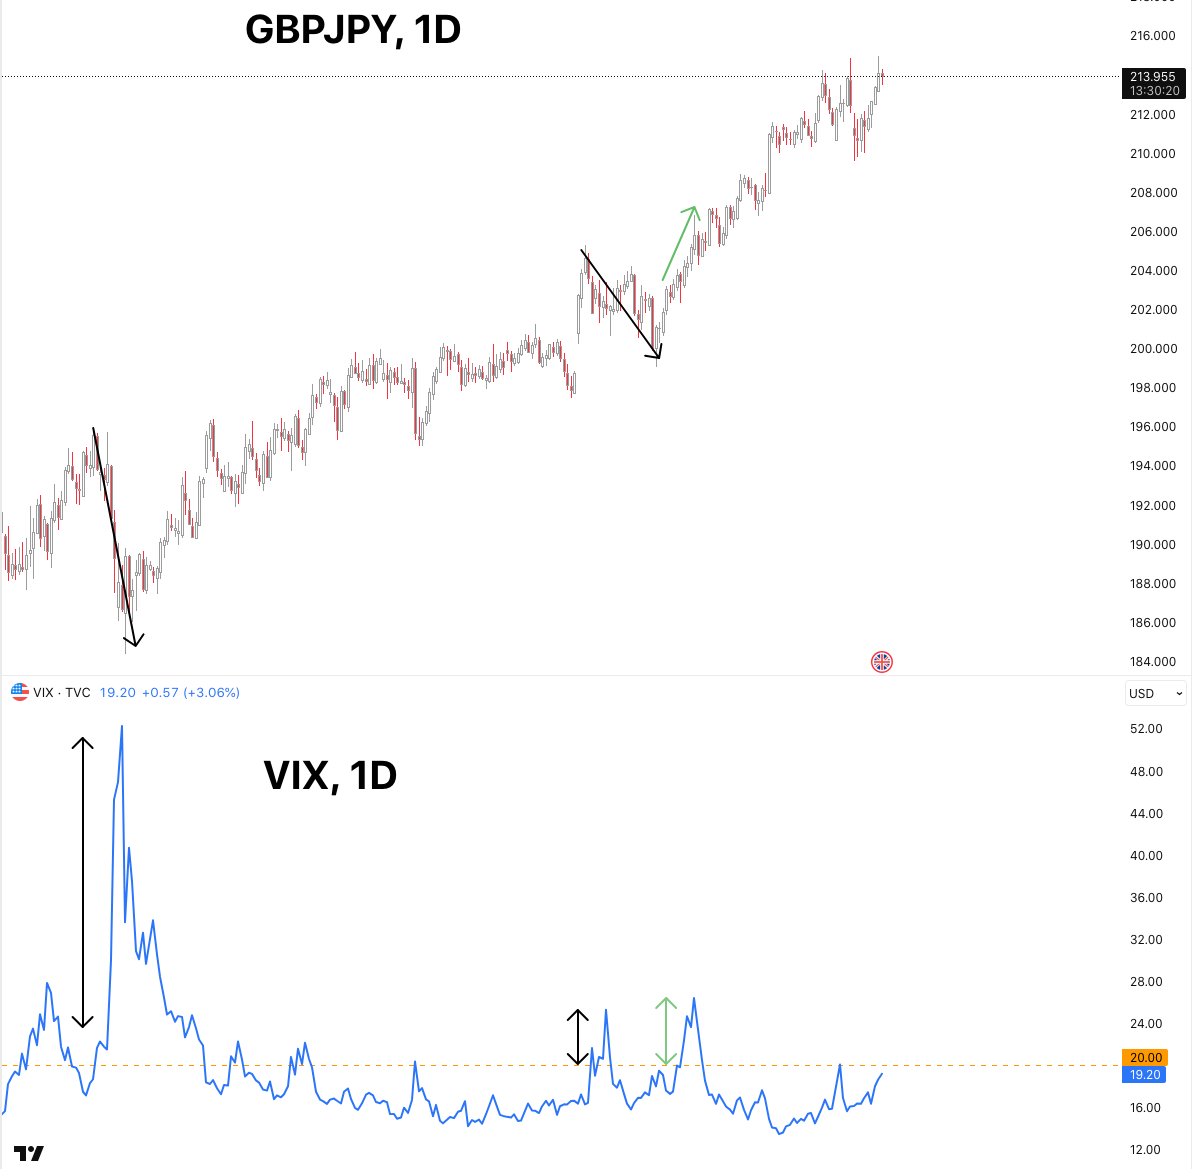
However, the expected correlation failed. Despite indices occasionally diving and the VIX reacting, GBP/JPY rocketed higher by over 200 pips. This underscored a vital lesson for 2026: we are in a market where the “trending” nature of the currency pairs is decoupled from standard volatility triggers. The decision to cut the position short rather than “bleeding” it was a crucial exercise in capital preservation. Traders must be “kind in their own reflection,” recognizing when they are on the wrong side of a trend and stepping out before a wider stop is hit.
Tactical Adjustment: Wider Stops and Position Management
Because of the extreme volatility and “manic” nature of the 2026 Yen pairs, the report suggests a shift in trade management. Utilizing wider stops is not about accepting more risk, but about allowing the flexibility to “add, take away, or completely step out” as the market reveals its hand. This approach allows the trader to remain in tune with the market rather than being whipped out by noise. The goal is to avoid the “bleeding” of positions in a market that is clearly going in one direction despite “logical” reasons for it to reverse.
Global Indices and the 2026 Economic Outlook
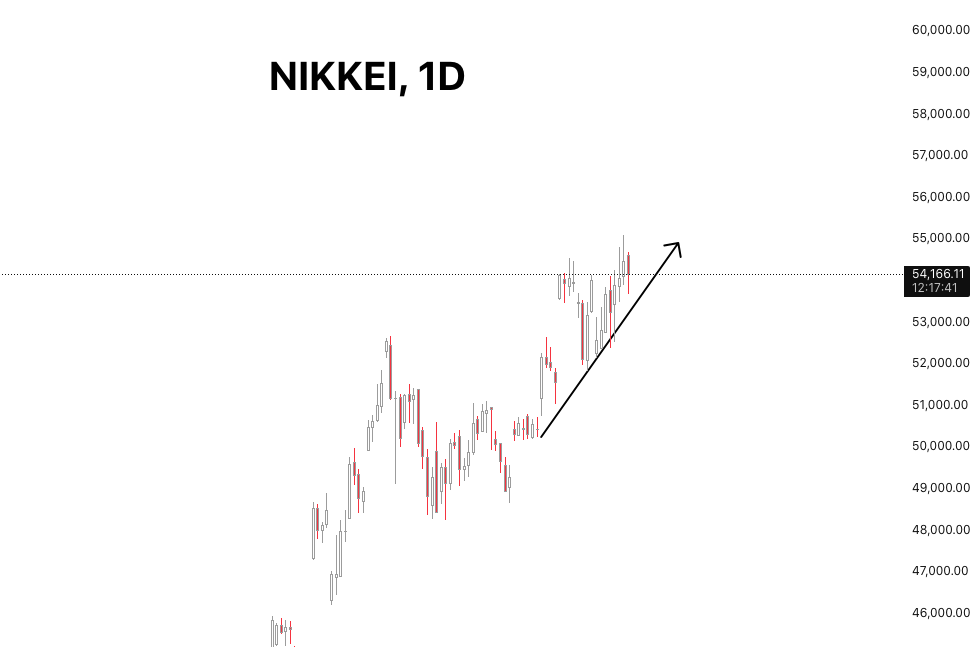
Asian Markets: Hang Seng and Nikkei Performance
A “health check” on global liquidity reveals that the East is currently leading the charge. The Hang Seng (Hong Kong Index) has performed flawlessly since the start of 2026, shooting “straight out of the open” with a 9% rally before entering a minor retracement. This move is largely fueled by stimulus coming from China, contrasting with the lack of stimulus currently seen in the US.
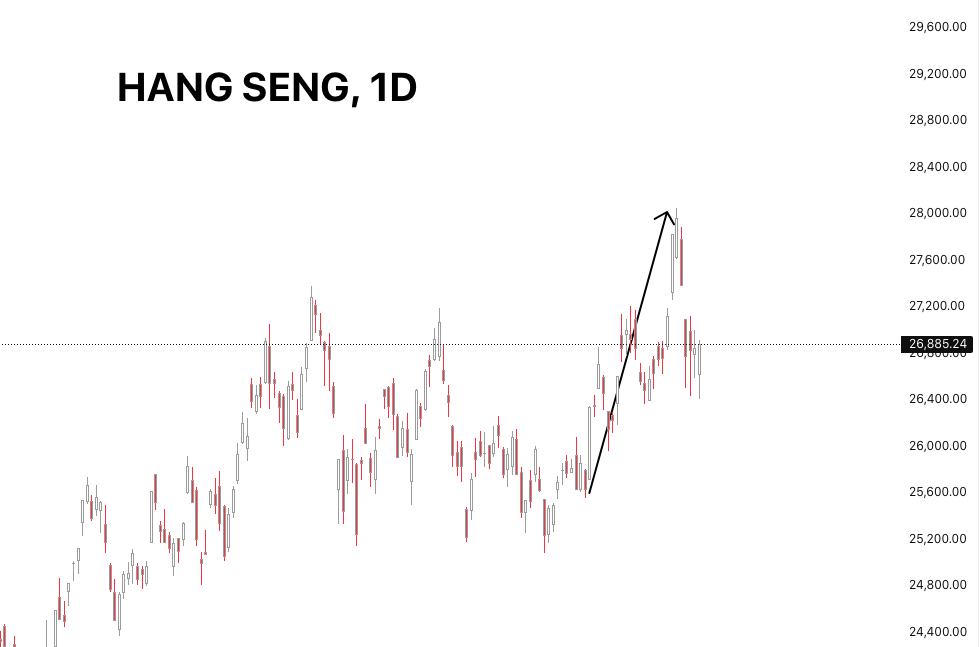
Similarly, the Nikkei started the year on January 2nd with a relentless move, gaining roughly 8%. For these indices to hit 70% to 80% of their average annual return in just the first month is an anomaly. Historically, these markets find a “happy place” with annual returns between 8% and 14%. This suggests two possibilities for 2026: either we are embarking on a year with returns in the 20% range a “year like we have rarely seen before”or a significant “reload” crash is imminent to reset the liquidity levels before the next leg up.
The S&P 500 Bull Case: The 16% Projection

The outlook for the S&P 500 in 2026 is exceptionally bullish, backed by a staggering 93% to 95% historical probability. Analysis shows that when January finishes in a bullish position, the S&P 500 has historically returned an average of 16% by year-end. Based on the start of 2026, this trajectory places a year-end target for the S&P 500 at approximately 7900.
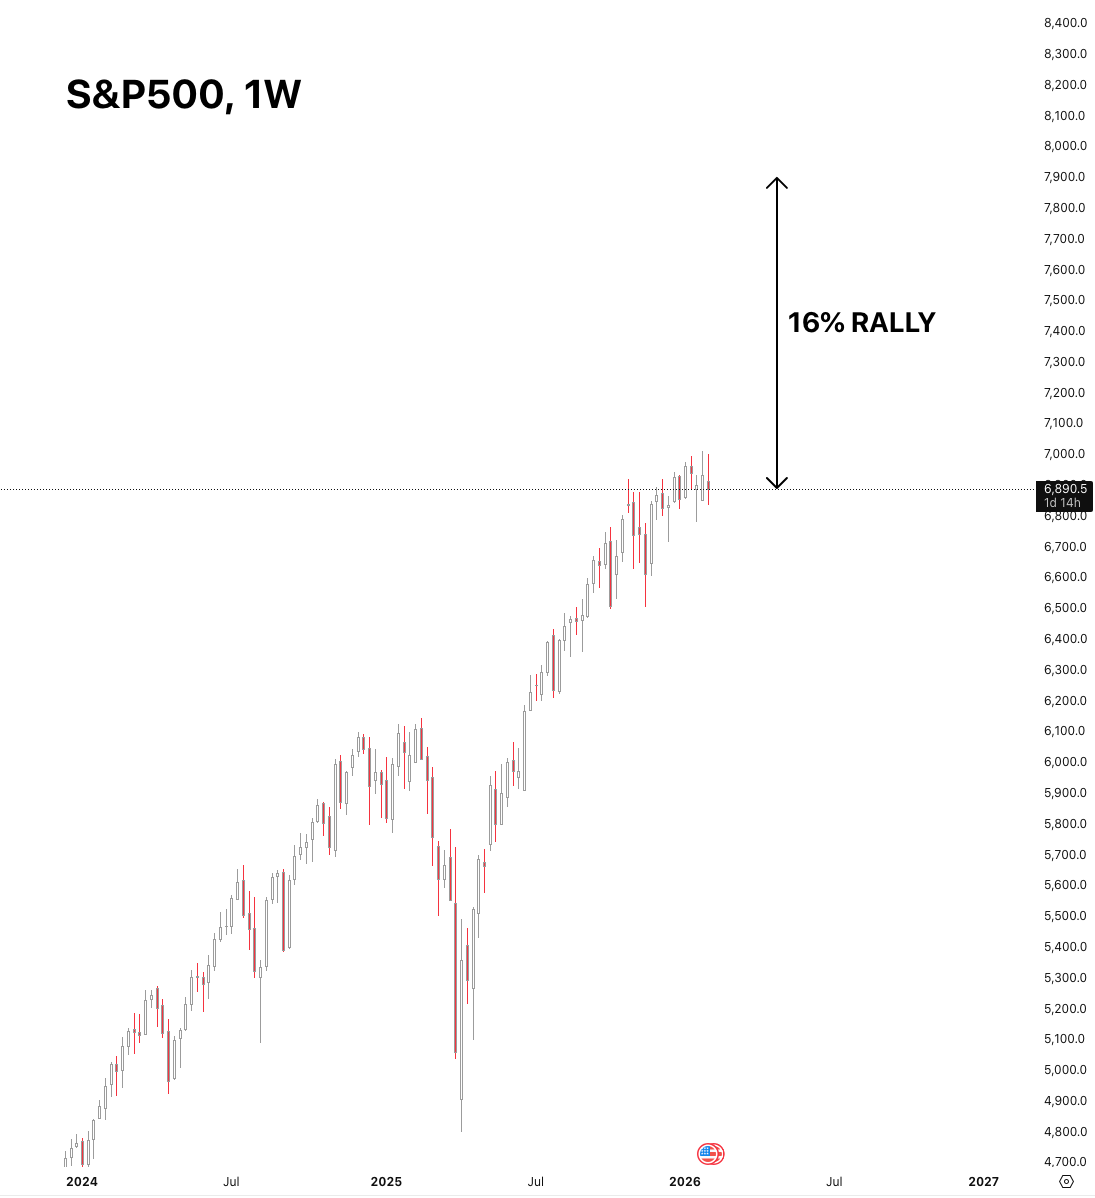
Several “big impact events” support this 16% projection:
Midterm Elections: Governments are historically inclined to boost equities during election cycles.
250th Anniversary of the USA: A major cultural and political milestone likely to be met with market-friendly sentiment.
Donald Trump’s 80th Birthday: Another significant event that could coincide with political or economic announcements.
June Stimulus: An anticipated stimulus check in June 2026 provides a concrete liquidity catalyst.
While the trajectory is up, the “path of travel” involves taking out new all-time highs, potentially followed by a “liquidity tap” south of the December lows to “suck everyone in” before the final smash toward the 7900 level.
Market Breadth and the “Fire Drill” Plan
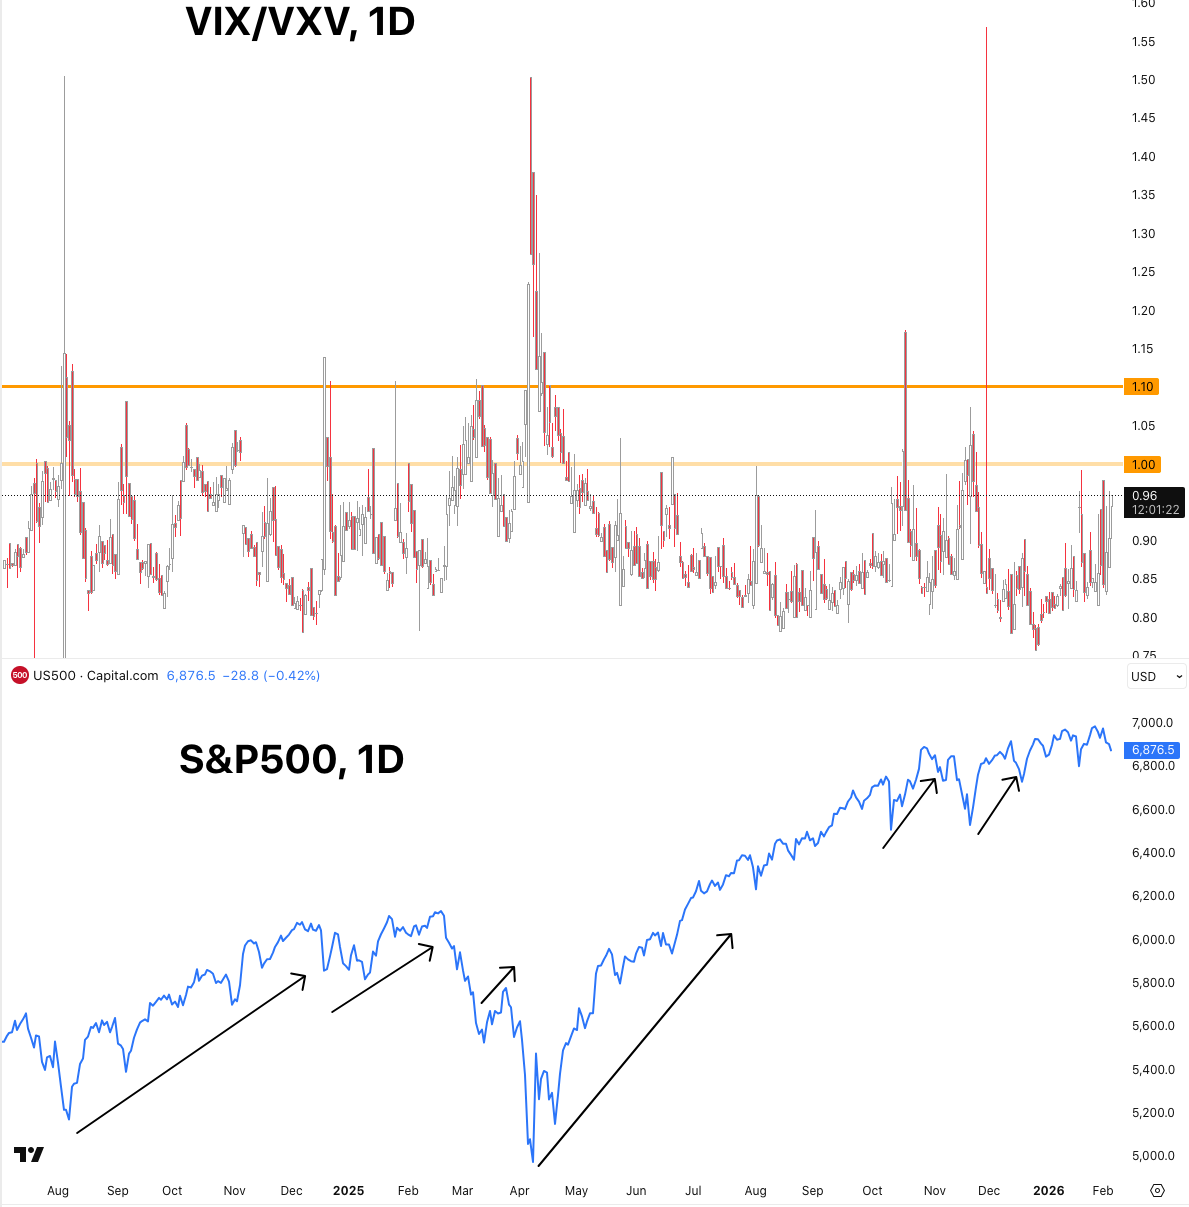
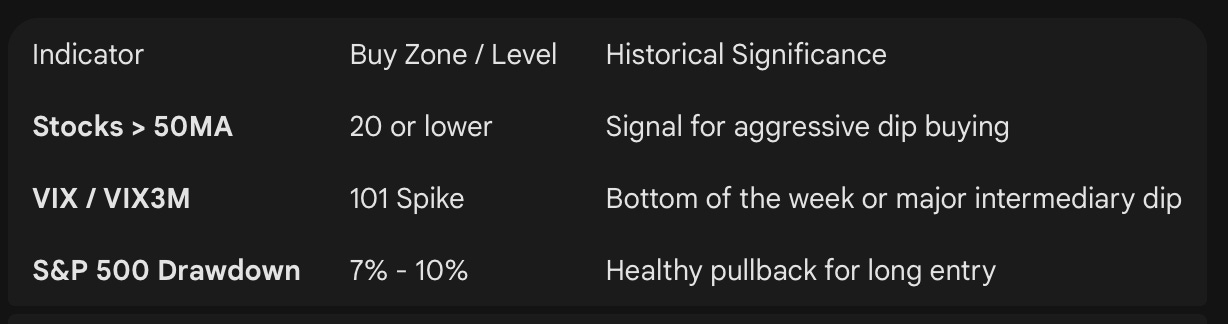
To navigate this bullish year, the report details a “fire drill” plan for buying dips. Aggressive dip-buying is not done blindly; it requires specific indicators to hit extreme levels. One such indicator is the percentage of stocks above their 50-day moving average. Levels of 20 and under are the primary target for entering long positions during heavy selling.
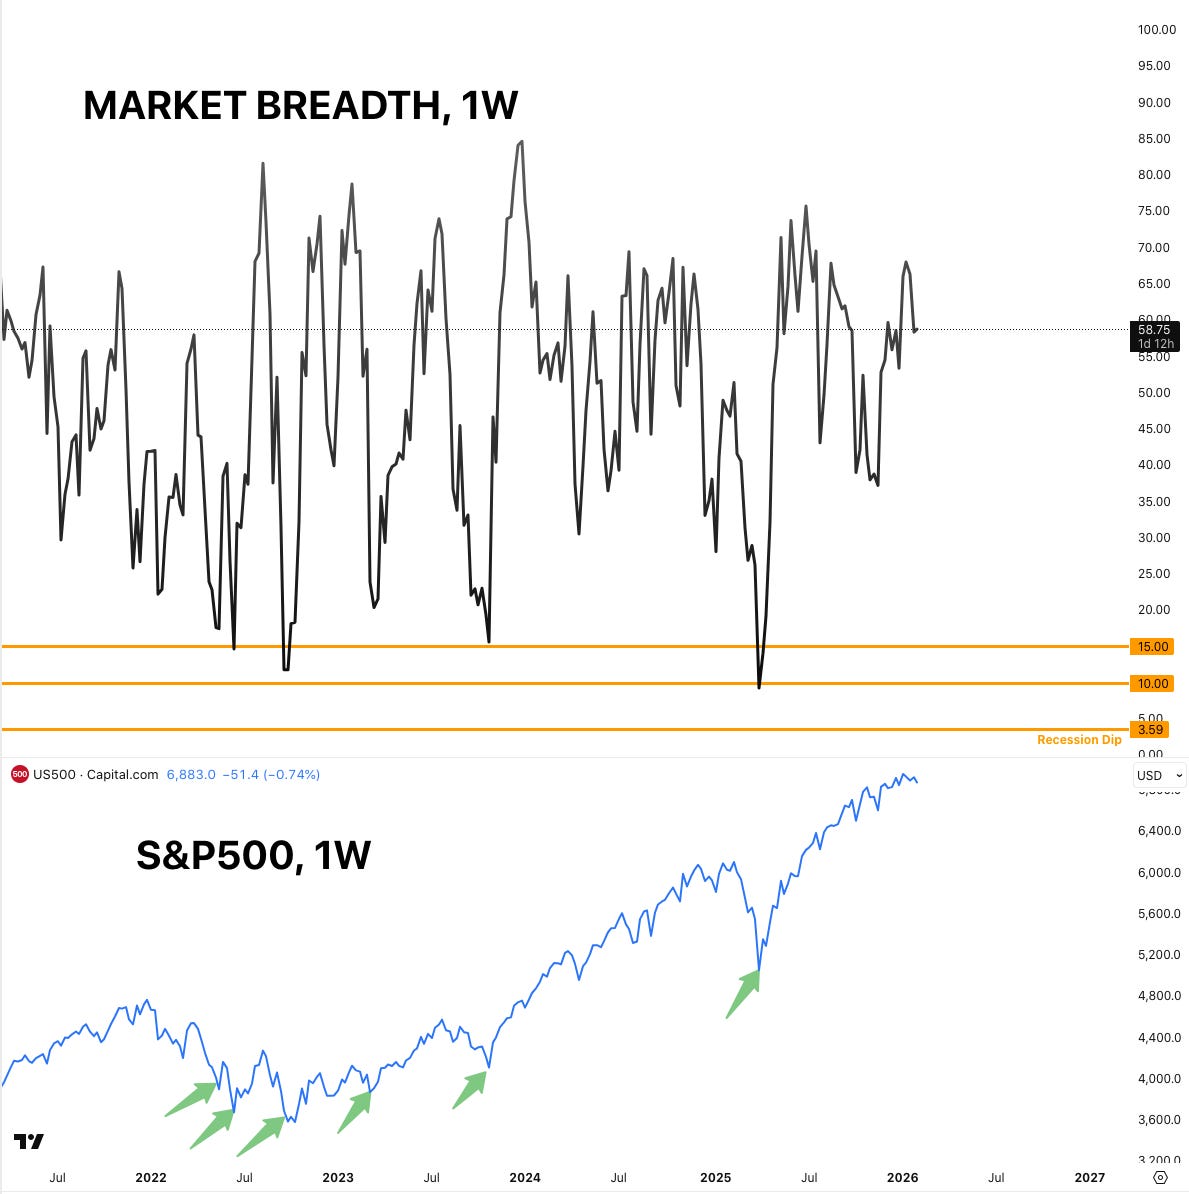
Furthermore, the VIX over the 3-month VIX ratio. When the S&P 500 experiences intermediary dips of 7% to 10%, a spike in this ratio to the 1.1 level serves as a “momentum buying opportunity.” This setup was perfectly executed in May 2025 and August 2025, where catching the dip led to gains of 55% in the S&P 500 and even higher in the NASDAQ. By having this plan in place now, traders can “react rather than analyze” when the inevitable 2026 pullbacks occur.
Currencies and Commodities: Synthetic Insights and Structural Deficits
The “Magic Dollar Index” and EUR/USD Directions
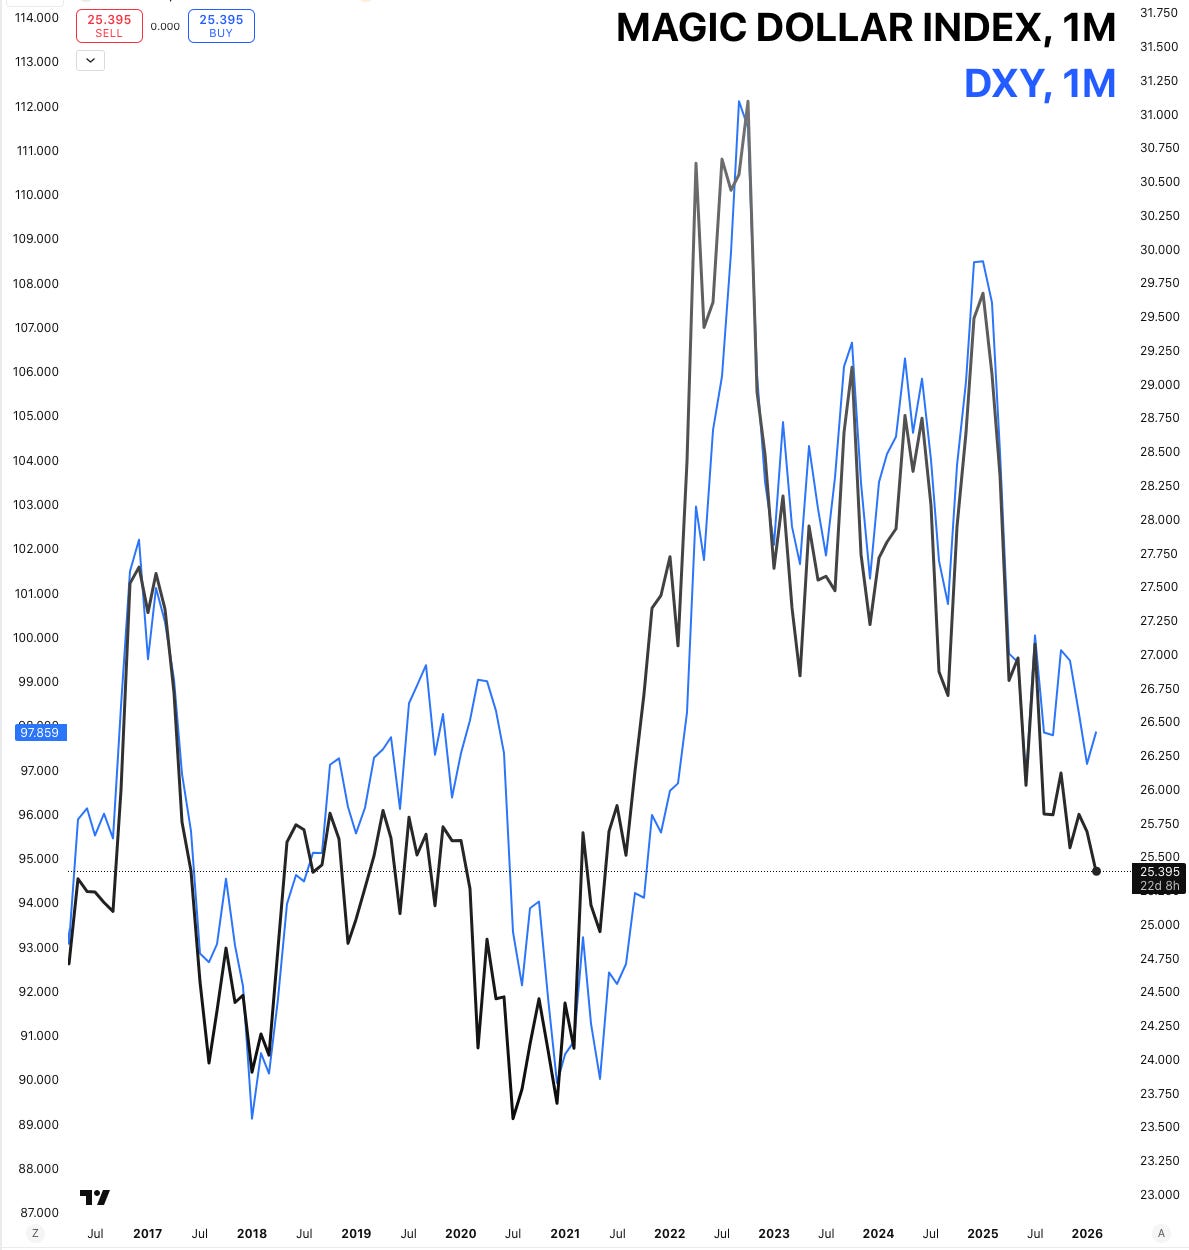
To understand the US Dollar’s true trajectory, introducing a synthetic “Magic Dollar Index” a calculation of TIPS (Milan Exchange) / IEF * 100. This chart typically moves in “lockstep” with the DXY, but provides a heads-up on future moves when deviations occur. Currently, the index is trading low, suggesting that EUR/USD (which is over 90% correlated to the DXY) should be challenging its latest highs.
The analysis points toward EUR/USD moving from its current 1.1832 level back toward the range extremes of 1.20. This is further supported by the USD/CNH (Dollar/Chinese Yuan) chart. In high-volatility markets where analysts are uncertain, USD/CNH tends to lead EUR/USD. The current “peeling away and touching base” behavior of these pairs indicates a period of “big volatility” ahead excellent for day trading, but challenging for position traders hoping for clean breakouts.
Commodities: The Copper Long and Oil’s Consensus
The commodity sector presents a mixed bag of structural trends and “retail traps.”
Copper: Currently bouncing off the 50% and 25% percentile levels of the Fed range. While a “structural deficit” supports a long-term bull market that began in 2024, the report warns that “everybody on the street” is long. Copper is a “mad market” prone to violent liquidations, as seen during the tariff-induced dips of 2025.
Oil: Trading around $63, with a heavy market consensus pointing toward $90 or $100. While a low-risk entry with a dip below $50 or even $45 would be ideal ,the current trend is “stacked” to the upside. However, at current levels, it is not considered a “low-risk environment” for new capital.
Silver and Gold: Silver appears to have hit a “blow-off top” with retail piling in, suggesting a potential wash-out. Gold is more “constructive” but has shown “toppish” behavior around the 5500 level. If gold continues to climb beyond these formations, it moves “outside the tool set” for safe engagement. Silver has topped in our books.
Bitcoin’s Structural Analysis: The NFCI Decoupling
The Breakdown of Fundamental Correlations
The most significant development for crypto traders in early 2026 is the “full-blown decoupling” of Bitcoin from the National Financial Condition Index (NFCI). Historically, Bitcoin has followed the NFCI (on an inverse basis) with extreme precision; when money becomes fluid and the NFCI drops, Bitcoin rises. This correlation held firm during the “summer of 2024” when the index correctly predicted a massive Bitcoin explosion regardless of the US election outcome.
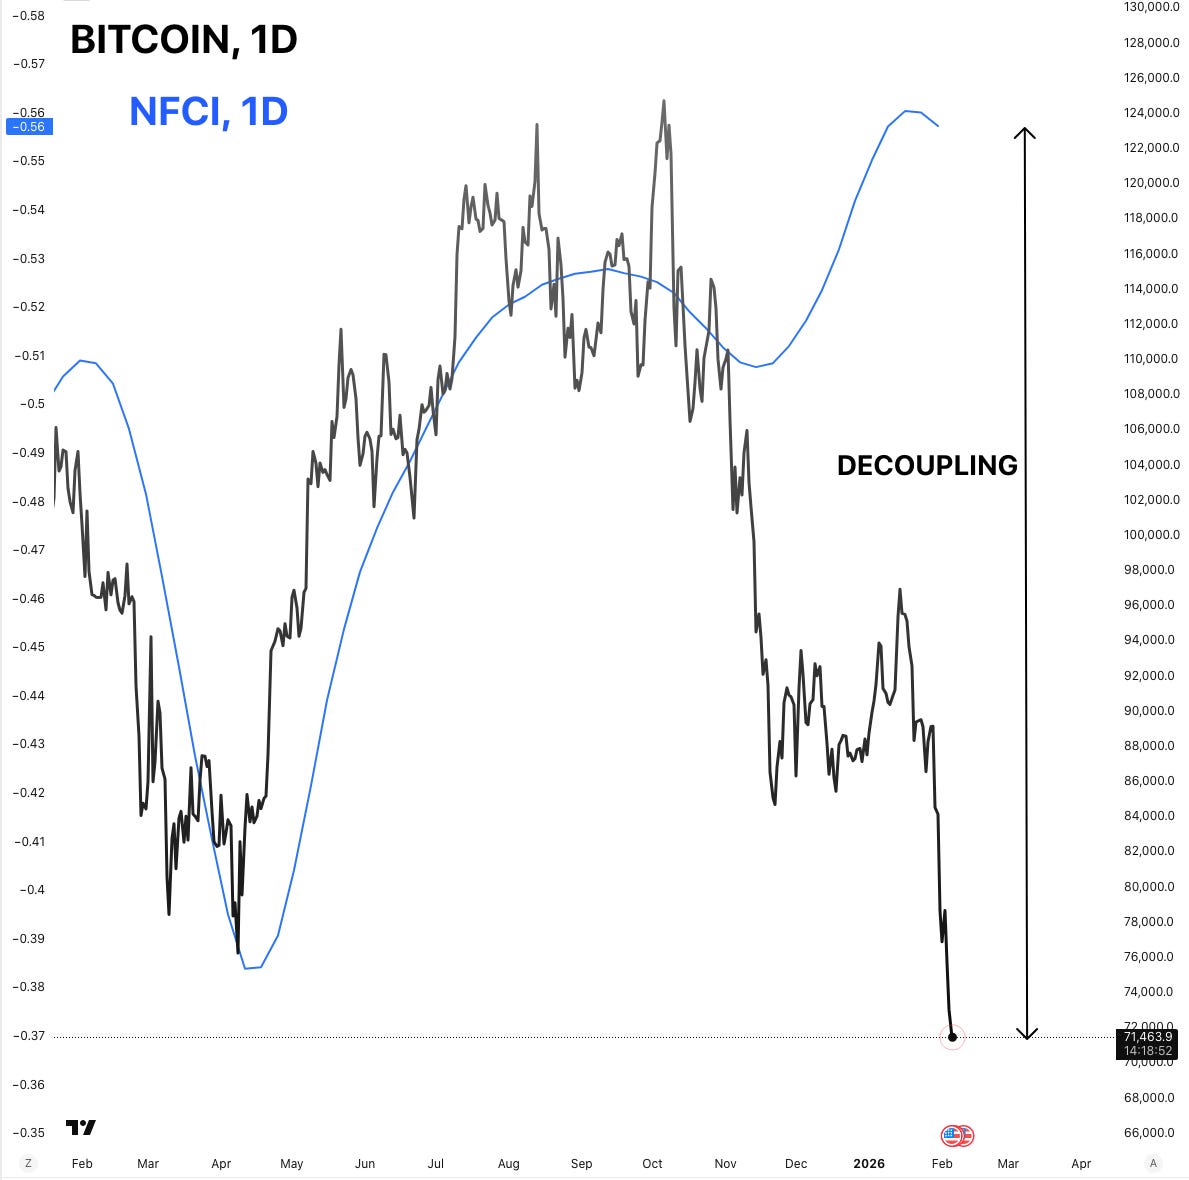
In 2026, this relationship has broken. Despite the NFCI suggesting Bitcoin should be moving up, the asset has “kept falling.” This decoupling means that macro indicators are no longer a reliable “saver” for Bitcoin positions. The asset is currently paying attention to “something different,” and until this new correlation is understood, the market remains “price-dependent” rather than “macro-dependent.”
Price Targets and the 90k Barrier
The outlook for Bitcoin for the remainder of Q1 and Q2 2026 is bearish. The current “direction of travel” points to levels below 60k, potentially revisiting the price levels from the summer of 2024. The reasoning is purely technical and sentiment-driven:
The 90k-95k Resistance: Unless Bitcoin can climb back above the 90k level, longs should not be entertained except for short-term tactical plays.
Fed Range Rule: Bitcoin has broken out of its “Fed range” to the downside. Statistically, there is less than a 10% chance it will trade back above the range (towards 98k) before the next Fed meeting in March.
Traders are advised to wait for a “new range” to be found. The current market is heavy, and “the trade was short.” For those not already in the move, it is “too late to the party” to short now, but also too early to buy.
Strategy: The Bank of England and the 4 PM London Fix
Mechanics of the London Fix
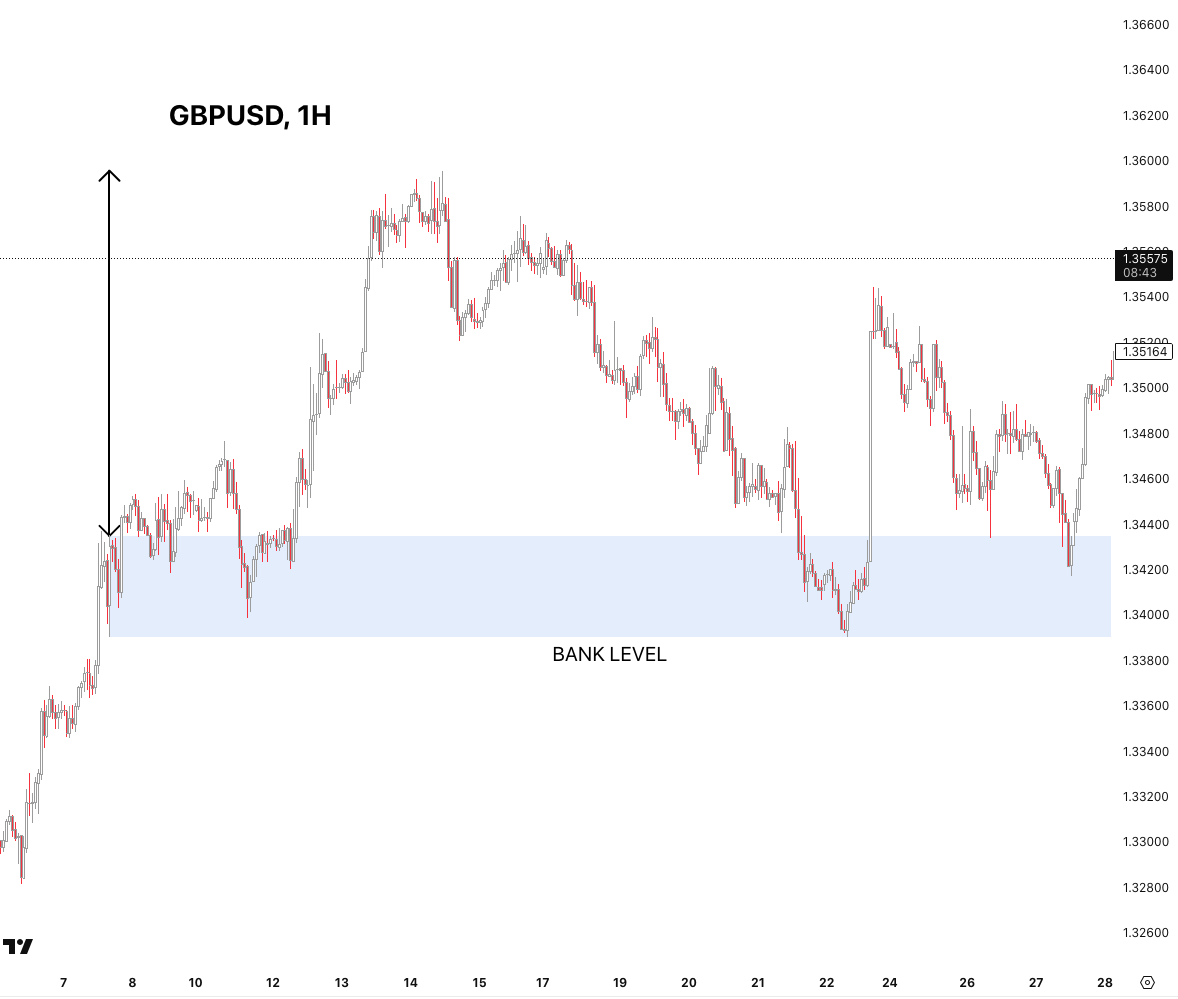
A cornerstone of the institutional strategy discussed is the 4 PM London Fix. At this time, major banks benchmark prices for assets like GBP/USD, allowing asset managers to value their global order books. This concentration of institutional activity creates immense supply and demand zones that act as “springboards” for future price action.
When the London Fix coincides with high-impact news, such as a Bank of England (BoE) meeting, the resulting range becomes a “pivotal price level” that can hold for weeks. The report identifies these ranges as essential “anchors” for both short and long positions.
Historical Evidence of Fix Rejections
The effectiveness of the London Fix is demonstrated by historical data from previous BoE meetings:
August 7th Meeting: The 4 PM Fix created a zone that “held all of August.” Upon retesting the zone, the market “zoomed out over 158 pips.”
November 6th Meeting: The hourly fix candle became a “defended level” for almost the entire month of November, eventually providing a 70-pip rejection and rally.
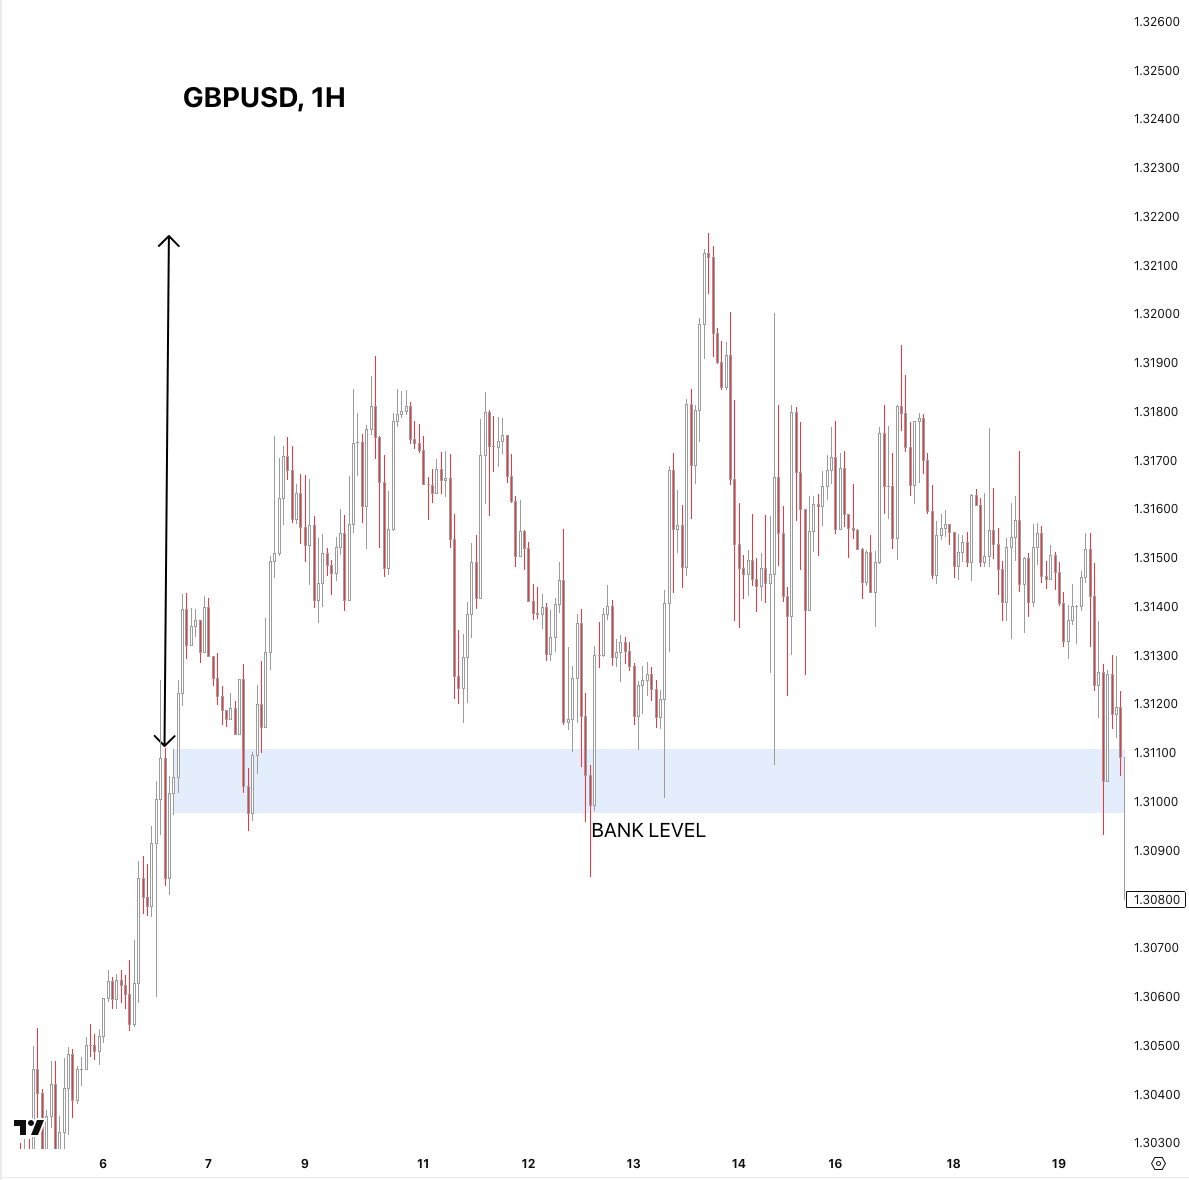
With the next Bank of England meeting scheduled for Thursday (February 5, 2026), followed by NFP on Friday, a “new zone” will be created. Traders should watch the 4 PM GMT hourly candle on Thursday; the boundaries of this candle will likely define the trading range for the remainder of February.
Key Strategy: Identify the high and low of the 4 PM GMT hourly candle on the day of the BoE announcement. Treat this zone as a “pivotal anchor.” A rejection from these levels offers high-probability, low-risk entries.
Key Takeaways and Outlook
As we navigate the first week of February 2026, the market presents a dichotomy of “manic” institutional rallies and retail traps. The S&P 500 remains the “crown jewel” of the bullish thesis, with a 16% target and a clear 7900 year-end objective, supported by a trifecta of political and stimulus catalysts. However, the path to 7900 will likely involve a “fire drill” dip of 7% to 10%, which we are prepared to buy when the VIX/VIX3M ratio hits 101.
In contrast, Bitcoin has entered a period of structural uncertainty. The decoupling from the NFCI and the failure of the 90k support suggests a move toward sub-60k levels is the path of least resistance. Meanwhile, the Yen pairs continue their relentless climb, cautioning us against premature shorting despite historical gaps.
Actionable Checklist for the Week:
Monitor the Bank of England meeting TODAY for the 4 PM London Fix zone.
Watch for a USD/JPY retracement toward the 147.75 magnet, but only with VIX confirmation.
Prepare for NFP Friday volatility by referencing the “Magic Dollar Index” levels.
The market in 2026 is moving at a pace “never seen before.” It is a year of asymmetric opportunities for those who can remain grounded in logic and disciplined, and a year of “fat tail errors” for those who let emotional discomfort drive their trades.
What’s your take on the Bitcoin decoupling? Are you a buyer at 60k or waiting for the 95k reclaim? Share your strategy in the comments, let’s discuss!
Disclaimer: This isn’t financial advice – just market musings from the charts. Always do your own research.
If you enjoyed this deep dive, please share it with fellow traders!
TRADE STRONG
MIAD