

This Week’s Trader’s Risk Map: From Sudden Yen Gaps to Crypto’s Deep Freeze — Tracking the Market’s Next Turning Points


Executive Summary
Welcome to this week’s deep dive, marking 12 months of these webinars since we kicked off around the US election last year. It’s been a remarkable year of market events, from Trump and Kamala Harris’s election pull to today’s complex environment.
Today, we are laying out the “Risk Map” a comprehensive guide to understanding where we are, what the key risks are, which assets are poised to move, and when to reassess our positions. We’ll cover legacy markets, FX (specifically the Yen), metals, and the crypto market, before wrapping up with the looming government shutdown and its implications.
The core of our analysis begins with a unique “crystal ball” chart an anomalous correlation between the DAX ETF / S&P 500 ETF ratio (offset by ~25 days) and EURUSD. This indicator, which has held for 16 quarters, is currently signaling a potential dip for EURUSD as we head into the end of November. While macro reasons are scarce, this flow-based indicator has proven remarkably prescient, especially around quarter-ends.
From there, we dive into the FX market’s most glaring risk: massive, unattended gaps on Yen pairs.
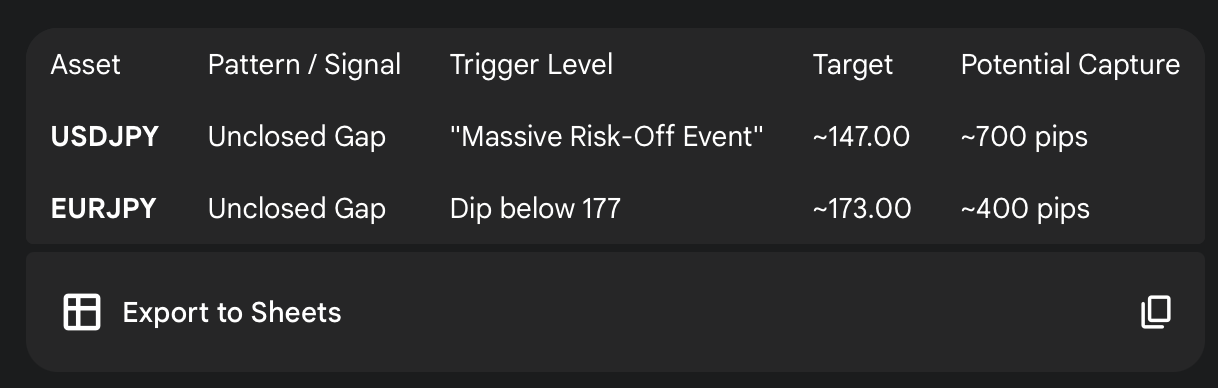
USDJPY has a gap targeting 147, a potential 700-pip drop.
EURJPY has a similar setup, with a trigger below 177 targeting the gap at 173, a 400-pip move.
These gaps won’t close on their own; they are waiting for a “massive risk of event.” When this event happens, we must be ready to “punch” while others are scrambling.
To identify that event, we turn to our key correlations, primarily the 90% probability relationship between US Real Yields and the S&P 500.
Scenario 1: Real Yields DOWN + S&P 500 UP = Dollar DOWN (EURUSD UP).
Scenario 2: Real Yields UP + S&P 500 DOWN/Choppy = Dollar UP (EURUSD DOWN).
Crucially, the signal for our Yen gap-close trade is a third scenario: Real Yields DOWN + S&P 500 DOWN. This combination has historically led to dramatic Yen strength, such as the 800-pip drop in EURJPY in February 2022. This is the signal we are waiting for.
We also examine our key stock market risk indicators:
SPY/TLT Ratio: Currently high, but consolidation warns of strained financial conditions.
SOX/FXY Ratio: A high-volatility, leading indicator that moves faster than the S&P 500.
Market Breadth (% > 50-day MA): Our “shut your eyes and buy” indicator. It’s currently weak, with the market held up by the Magnificent 7. But if it dips to its key low zones (15%, 10%, or 3.59%), it has historically marked generational bottoms (COVID, Oct 2023, Dec 2018 and GFC).
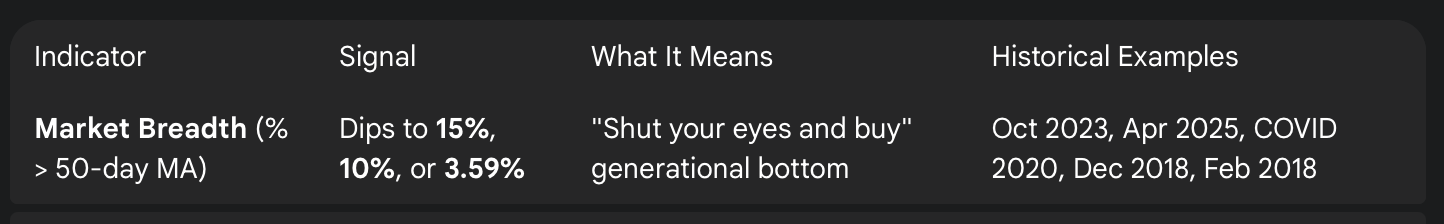
VIX/VIX3M Ratio: The “bottom caller.” A spike to 1.10 signals a powerful, buyable dip, as seen in mid-October which preceded a 250-point S&P rally.
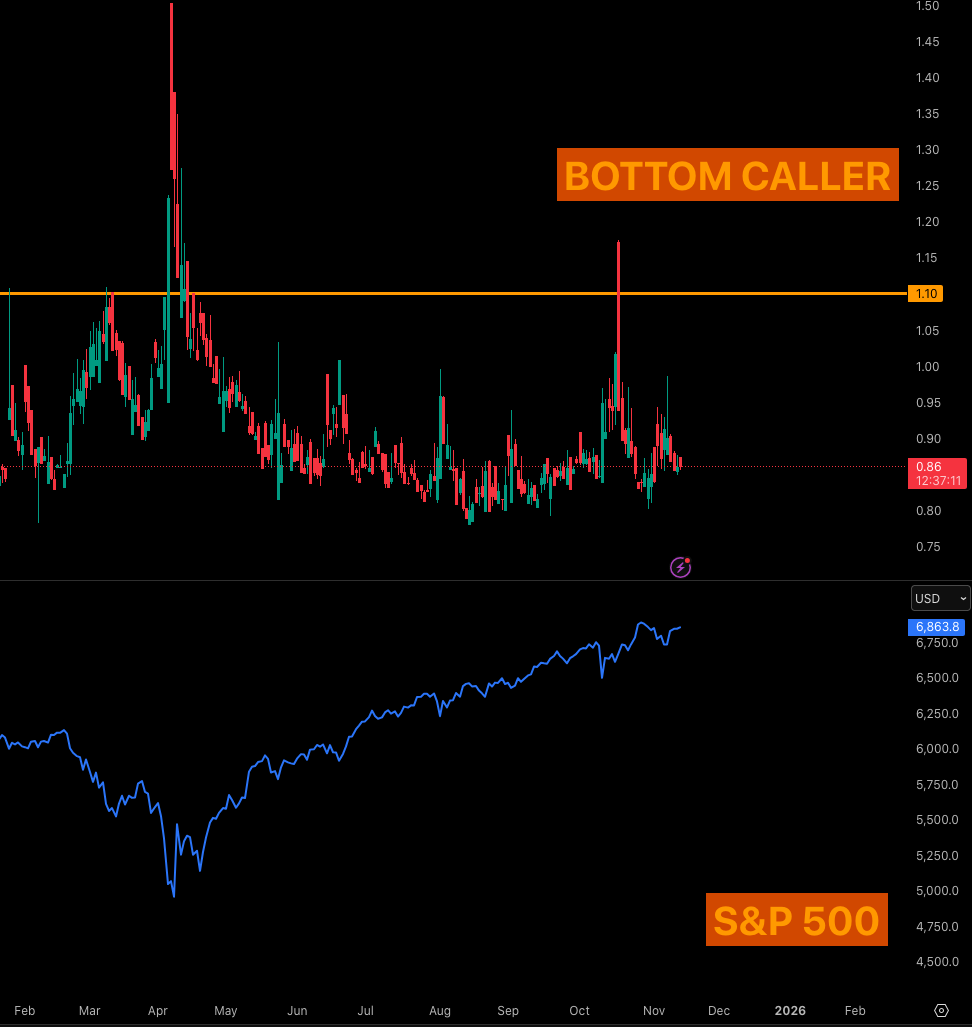
In the crypto market, the outlook is decidedly bearish. Bitcoin has shown no sustained strength, and our analysis points to a potential drop to the $70k level. The only driver that matters right now is the Financial Condition Index (FCI). This slow-moving, 105-asset index is currently tightening, an environment where Bitcoin cannot rally. An inverted FCI chart has precisely called Bitcoin’s tops and bottoms, and it’s currently pointing down. Until the Fed’s future “stealth QE” (moving mortgage maturities to bills in December) and a stop to QT loosen conditions, we have no interest in buying. This bearishness extends to Solana (broken under $170) and Ethereum, where any rally is a shorting opportunity.
Finally, we discuss the government shutdown threat in late January 2026. This is a political move by the Democrats for the 2026 midterms. For traders, this means a likely Gold rally starting in early-to-mid January as the market anticipates the event. We also close with a critical look at somatic trading using your emotions not as liabilities, but as signals to be reappraised, helping you build a high signal-to-noise ratio and avoid bad trades.
What does this risk map mean for your portfolio? Let’s dive in.
📈 FX Deep Dive: The “Crystal Ball” and Unclosed Gaps
The EURUSD “Crystal Ball”
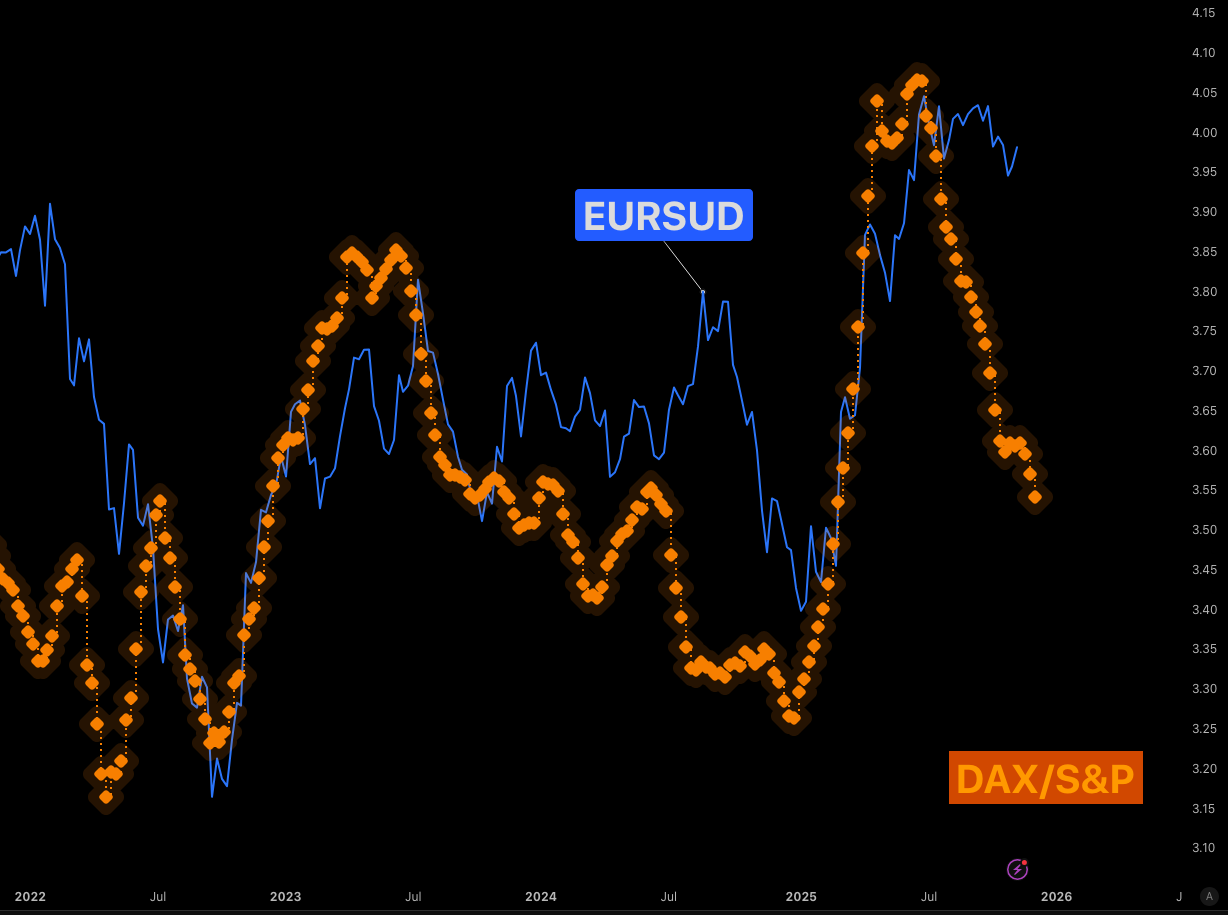
To understand where the dollar is headed, we first look at a unique, and admittedly anomalous, chart that has been working with uncanny accuracy. This “crystal ball” is a ratio of the German DAX ETF over the S&P 500 ETF.
By offsetting this ratio’s moving average forward by about 25 days, it has shown a remarkable ability to forecast the flows for EURUSD , particularly into month-end and quarter-end. This chart has “...been holding for 16 quarters. So it is silly. It is silly accurate.”
The underlying logic seems to be that when the “...DAX losing out to S&P 500 eventually will lead to stronger flows into the dollar than the euro.”
The Current Reading: Going by this chart, it looks likely that EURUSD wants to dip again as we head toward the end of November. While there is no overwhelming macro reason for this move (forces are relatively balanced), these flow dynamics have been a reliable guide. We will shelve this “crystal ball” for now, but if it works again, it puts us well ahead of the curve.
The Massive Yen Gaps: A Risk-Off Trade in Waiting
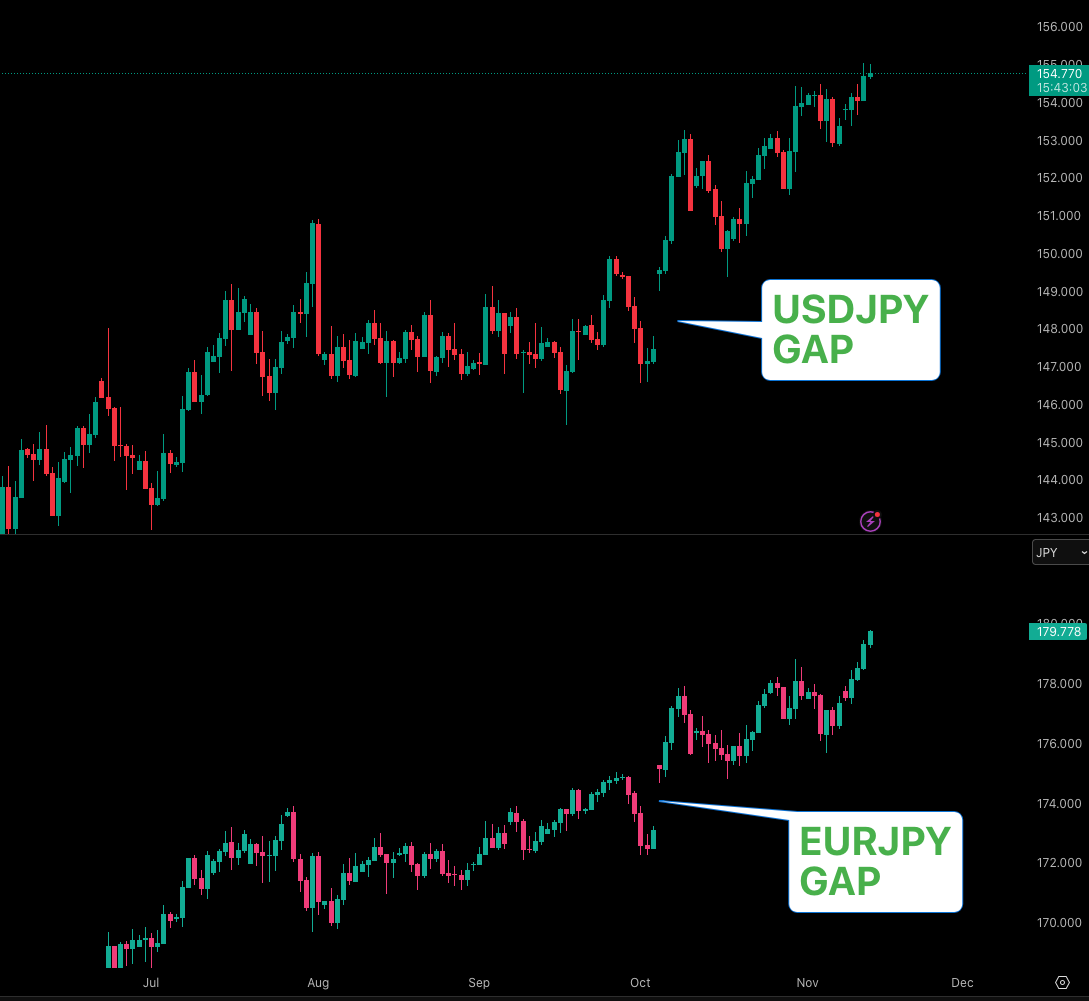
The most glaring opportunity and risk in the FX market is the presence of massive, unclosed gaps on the Japanese Yen (JPY) pairs.
“...FX does not tend to leave gaps this size unattended.”
These gaps are concerning due to their size and what it will take to close them. We are expecting that “...eventually there is going to be risk off events, something really bad is going to happen, and yen is going to get bid.”
Here are the specific trade setups we are monitoring:
On EURJPY, the chart shows consecutive bids that look “...on fumes and they will dry out.” We are not taking a short or long position yet. Instead, the plan is to wait: “...When I see a dip in this current Fed cycle underneath 177, I will be attacking the gap at 173 allowing to capture about 400 pips or so.”
This will likely be a unanimous move across all Yen pairs, but it will not happen in a vacuum. “...I doubt we are going to see a big move like this... without any narrative. I think the narrative will drive that.”
Why Yen?
Right now, Risk is on. There is “...no point putting your money into yen when... Nikkei is sitting at all-time highs... German DAX... S&P 500 is smidging away from all time highs.” It is difficult to buy risk-off assets at these times, but that is “...usually when you see the best risk-off moves as materialise.”
The Strategy: We are preparing now so we are not caught off guard. When this risk-off event sparks the move to close those gaps, “...everybody else will be scrambling looking for lower highs... we should be already punching.”
🔬 Understanding the Market Engine: Real Yields and Key Correlations
To know when to punch on that Yen trade, we need to know what signals to watch. The engine driving these macro moves can often be found in US Real Yields.
The 90% Correlation: Real Yields, S&P 500, and the Dollar
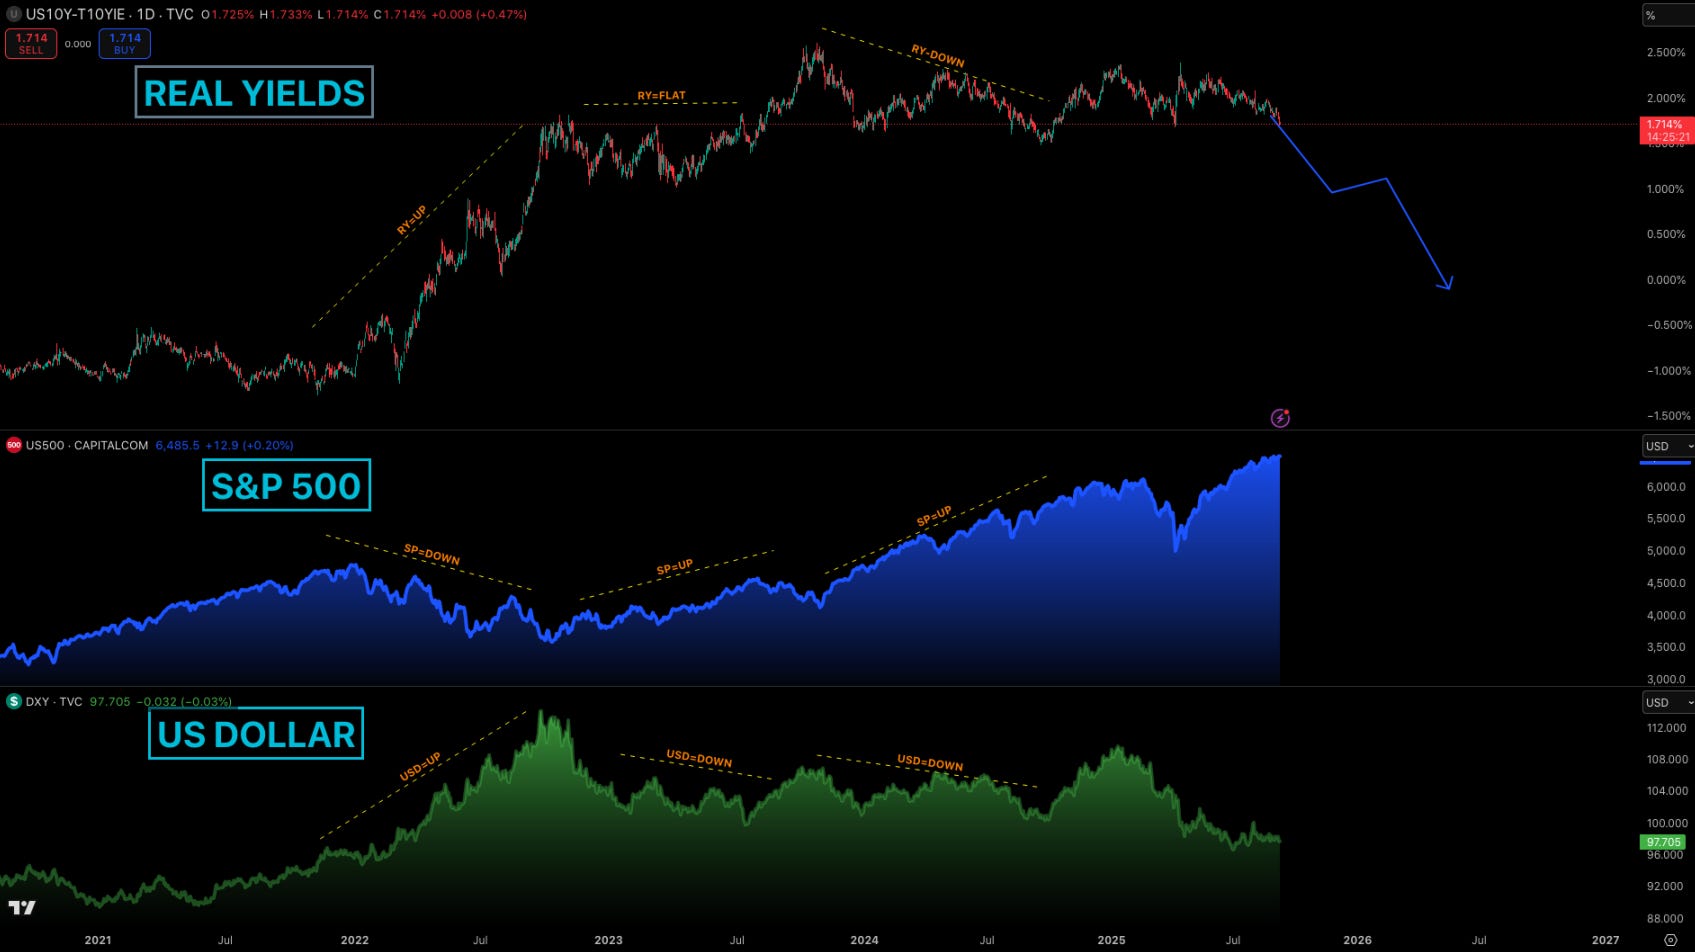
Real Yield is the return you get on a 10-year US bond after accounting for inflation (currently just under 1.8%). Its relationship with the S&P 500 gives us an incredibly clean, high-probability signal for the US Dollar.
There are two primary scenarios that have a 90% correlation:
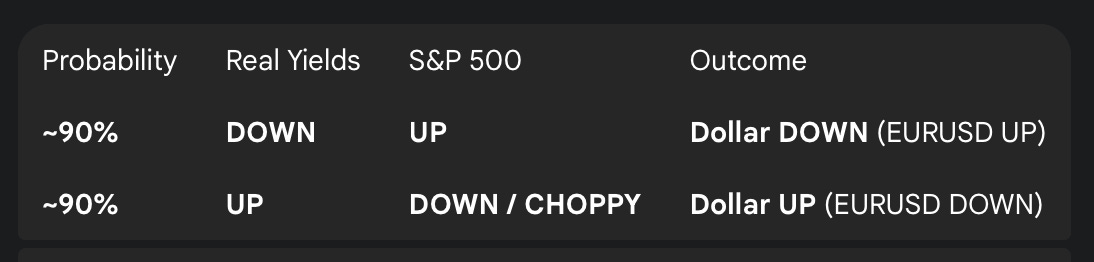
The first scenario is a classic risk-on environment: suppressed yields, a raging bull market in stocks. The second scenario (rising yields, falling stocks) is classic risk-off, leading to a dollar bid, as we saw from September 2024 to mid-January 2025.
The Signal for the Yen Gap-Close Trade
This brings us to the most actionable correlation. By adding the Yen to this matrix, we find the exact signal for the gap-close trade.
The Setup (High Probability):
Real Yields: DOWN
S&P 500: DOWN
Result: EURJPY DOWN (Dramatically)
This combination of falling yields (a flight to safety in bonds) and a falling stock market (a flight from risk) is rocket fuel for the Japanese Yen.
We have seen this play out historically:
July-August 2024: “...small little bump here... Euro JPY absolutely died, real yields also were diving.”
February 2022: “...Real yields clearly falling off a cliff. S and P 500, all bearish bids, and Euro JPY lost to the tune of about 800 pips.”
Key Takeaway for Traders: This is the signal. We want to be looking for the S&P 500 tapping out and real yields starting to dive again. That will be the signal for us to start the Yen gap-close trade.
📊 Reading the Tape: Key Stock Market Risk Indicators
How do we know when the S&P 500 is “tapping out”? We use a specific set of risk barometers to gauge the market’s internal health.
Risk Barometer 1: SPY / TLT Ratio
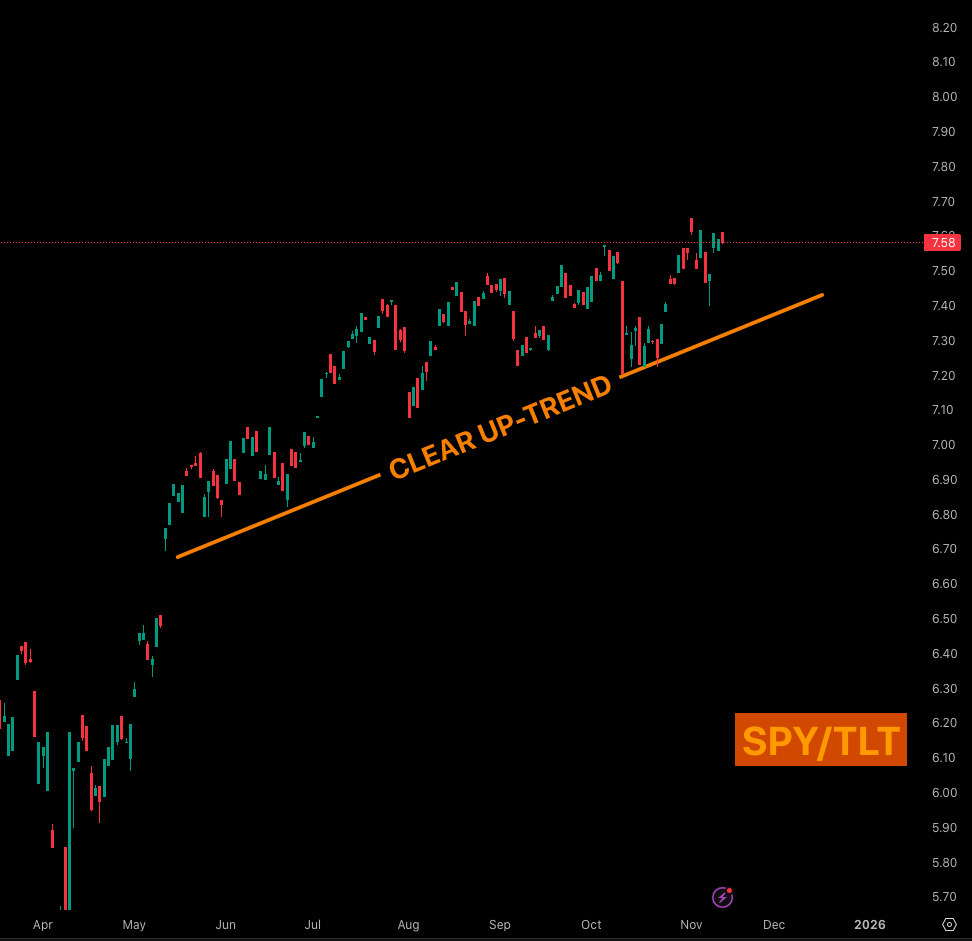
This ratio chart of the S&P 500 ETF (SPY) over the 20+ Year Treasury Bond ETF (TLT) is our primary risk-on/risk-off gauge.
What it means: As long as it is moving up, risk is on.
The Warning: When it breaks down, as it did in February 2025, it signals true risk-off flows. “...it just crashes out because people will go for the exits.”
Current State: It is “sitting high and sitting proud” but has been consolidating since July of last year, reflecting strained financial conditions.
Risk Barometer 2: SOX / FXY (The Leading Indicator)
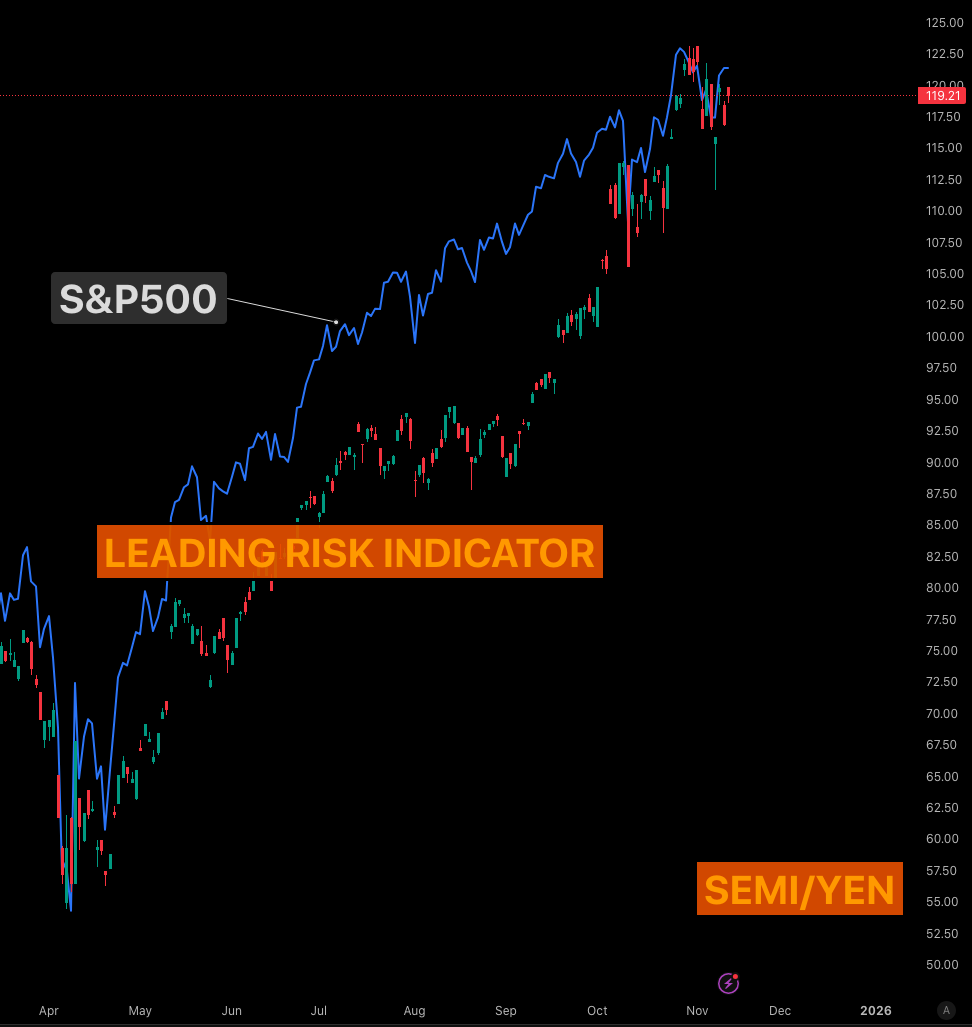
This is a “highly, sensitive leading indicator” but is also extremely volatile. It’s the ratio of the Semiconductor ETF (SOX) to the Japanese Yen (FXY).
What it means: It has a strong correlation with the S&P 500 but “...tends to move a bit quicker, particularly during the Asian session.” It gives us a heads-up on risk sentiment.
Risk Barometer 3: Market Breadth (% Stocks > 50-Day MA)
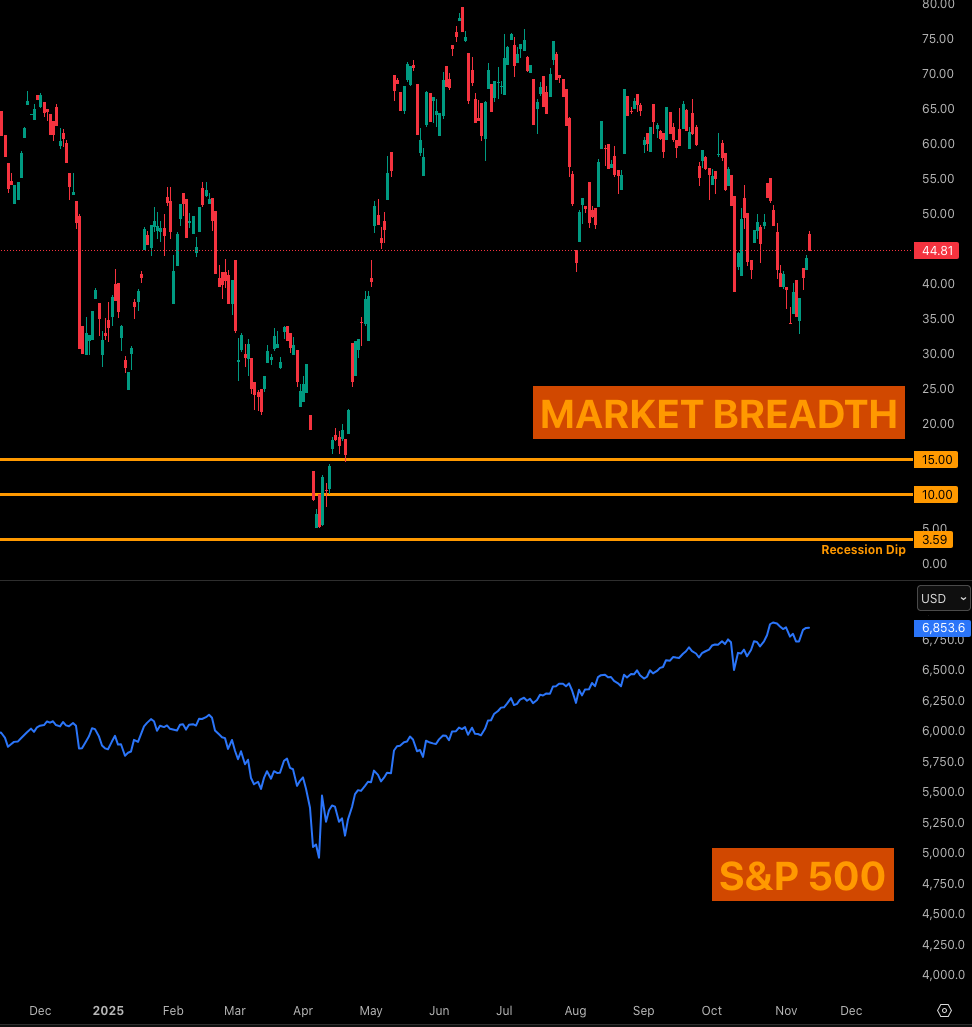
This is perhaps the most powerful bottom-catching indicator we have. It measures the percentage of stocks trading above their 50-day moving average.
Current State: The market’s health is poor. “...the entire market has been suffering since summer and has only been select few that are driving this market, mainly the Magnificent 7.” This narrow breadth is a weakness.
The “Shut Your Eyes and Buy” Signal: When this indicator collapses, it tells you the market is in a full-panic capitulation. Nobody wants to buy, which is precisely when you should.
These are the key “buy” zones and the historical bottoms they’ve marked:
This indicator is “...very reliable.” It doesn’t happen often, but when it does, it’s the signal.
Risk Barometer 4: The VIX / VIX3M “Bottom Caller”
This is a more frequent, but still reliable, bottoming signal. It’s the ratio of the front-month VIX over the 3-month VIX (VIX3M).
The Signal: A sharp spike into the 1.10 level.
What it means: This doesn’t call a generational bottom, but it “...tend[s] to get a really good market bottom for a really long time.”
Recent Example: We saw this signal print during the scare in mid-October, around Friday, the 10th of October. It gave a great entry “...and since then it has been... fairly robust from there, you had like a, 250 point rally...” on the S&P 500.
Crypto Market Outlook: A Financial Winter?
Now, let’s apply this risk analysis to the crypto market. The picture here is not optimistic.
Bitcoin’s Bearish Bias and the $70k Target
Bitcoin’s chart has been weak. It “...has clearly broken down... below the 6 week cycle range...” but failed to find a sustained breakout. While levels like 77k, 80k, or 85k are possible, the underlying drivers for a rally are not there, yet.
Our Stance: “...the things in place for Bitcoin are not there to see that sustained rally. To me, it looks like more that the bottom wants to fall out, the lows are going to surrender, and we are going to see that 70K area to buy cheaper.”
The Only Indicator That Matters: Financial Condition Index (FCI)
Why the bearish bias? Because of the Financial Condition Index (FCI). This is a massive, lagging indicator that accounts for ~105 different assets (bonds, yields, dollars, flows, etc.) to measure credit availability.
How it works: When the FCI chart moves UP, financial conditions are TIGHTENING. This means less credit, and investors move back from the “risk curve” (from risk-on to risk-off).
The “Precise” Correlation: By inverting the FCI chart, you can “...see how precisely it has been by finding Bitcoin tops and bottoms.” It is a slow-moving boat, but that’s exactly what you need when nobody knows what’s happening.
Current Reading: The FCI is tightening (moving up), meaning the inverted chart (Bitcoin’s “fuel”) is moving down. It is “...telling it that Bitcoin has got nothing... no feel to to attack new all time highs.”
Until this chart turns around, the analyst has “...no interest in finding finding out where the bottom is...”
The Fed’s “Stealth QE” and the Future Bull Case
What will make the FCI turn? The Fed.
Future Catalyst 1: Starting in December, the Fed will “...start moving some of their mortgage, maturities into bills.” This is, in our view, “a stealth QE.”
Future Catalyst 2: They will also be stopping quantitative tightening (QT).
The Fed understands conditions are tightening and they will act. “...The moment they start to do something about it, they will not stop until they are successful.”
This is the future bull trigger: “...once they make financial conditions loose again... Bitcoin starts moving up. If Ethereum starts moving up and Solana will start moving up, going towards all time highs again.” We are just not there yet.
Altcoin Outlook: Solana and Ethereum
This bearish view extends to the entire altcoin market.
Solana (SOL): “...confidently broken under 170.” This was a key range indication that it is on a bearish floor for the remainder of the 6-week cycle (until the mid-December Fed meeting).
Ethereum (ETH): The same is true for Ethereum. “...Any bullish movement to me really looks like to be just an opportunity to either close out longs or maybe even potentially have a look at pressing the short side.”
🏛️ Catalysts on the Horizon: The Government Shutdown
Looking ahead, the government shutdown is a key narrative.
The Key Asset: Gold.
The Pattern: Historically, Gold tends to find a dip during the shutdown, but it “...will find another leg up...” about two weeks before the shutdown threat materializes.
The Next Threat: The next shutdown is very likely coming at the end of January 2026.
The Trade: We will be looking for Gold to find bids and start a new leg up around early-to-mid January.
This is not a one-off event. The Democrats “...are very likely going to use this shutdown as a campaign for the midterm elections in... November 2026.” We should expect these shutdowns to continue, which will “...eventually wear the US economy as well.”
🧘♂️ The Trader’s Mind: Somatic Trading and Emotional Signals
Finally, we spent the last few minutes of the webinar on the most important topic: the trader. The markets are a limbo of narratives, but your internal state, your somatic experience, is a critical data point.
Mapping Your Sensations

As a trader, you are constantly bombarded with sensations from price action, news, lack of sleep, or real life. This information translates into bodily sensations: anxiety, happiness, a sinking feeling.
You must learn to categorize that information as good, bad, or useful. This is how you build a “map” to strategize, rather than just being pulled back and forth by the market.
Reappraising Emotion: The Key to Good Decisions
Many traders think the goal is to remove emotion. This is wrong. “...without emotion, you cannot make any decisions. Every decision as a human being is based on emotions.”
The skill of a good trader is to reappraise their emotions and use them as signals.
Example 1: Anxiety.
Bad Trader: Feels anxious, panic-buys a dip that keeps dipping.
Good Trader (Reappraisal): “I am going to use that anxiety as a signal, maybe market has not bottomed out yet, and it is just forcing me to take bad entries.” Result: You avoid the bad trade.
Example 2: Greed.
Bad Trader: Feels greedy, holds for “just a little more,” and watches a winner turn into a loser.
Good Trader (Reappraisal): Feels “super greedy” and recognizes the market is overextended. **Result: You “...get out of the market because you do not want to be left holding a losing bag.” The cardinal rule: Do not let a winning trade turn into a loser.
Building Your High Signal-to-Noise Ratio
You cannot do this just by “thinking about it.” You must track these signals over time. Only by looking back can you see the sequences: “...This happened, this happened, this happened, all of this in the past has meant X, Y, and Z.”
This is how you produce a high signal-to-noise ratio. A good signal isn’t just on a chart; it’s “...how you perceive that data...” and the sequence you’ve learned to identify (Every week we teach this skill learn more about it here).
Key Takeaways and Outlook
As we head toward the end of the year, our Risk Map is clear. We are watching for a flow-driven dip in EURUSD and the eventual, violent closure of the Yen gaps (400-700 pips). The signal for that trade will be Real Yields and the S&P 500 falling in tandem.
We will remain patient, watching our “bottom-catching” indicators like Market Breadth (15%/10%/3.59% levels) and the VIX/VIX3M (1.10 spike) to tell us when to buy a deep-discount equity dip.
In crypto, we remain bearish. The Financial Condition Index is tightening, and until that reverses (likely via the Fed’s “stealth QE” in December), our bias is for a $80-70k Bitcoin target.
Finally, we are marking our calendars for mid-January to watch for a Gold rally ahead of the end-of-January government shutdown threat. And above all, we will continue to use our own somatic signals as a key part of our trading map.
Disclaimer: This isn’t financial advice just market musings from the charts. Always do your own research.
If you enjoyed this deep dive, please share it with fellow traders!
Trade Strong
Miad