

This Week’s Turmoil and Opportunity: The Crypto Derisking Playbook


Executive Summary
The pressing question for every trader right now is simple but critical: Is this just froth coming off the top, or is there a proper, systemic de-risking event underway?
To answer this, we must look beyond the price action and investigate where the liquidity is actually flowing. Today’s deep dive analyzes the rotation of capital, specifically looking at the divergence between rising real yields and falling equities, and what the credit spreads are screaming about risk appetite.
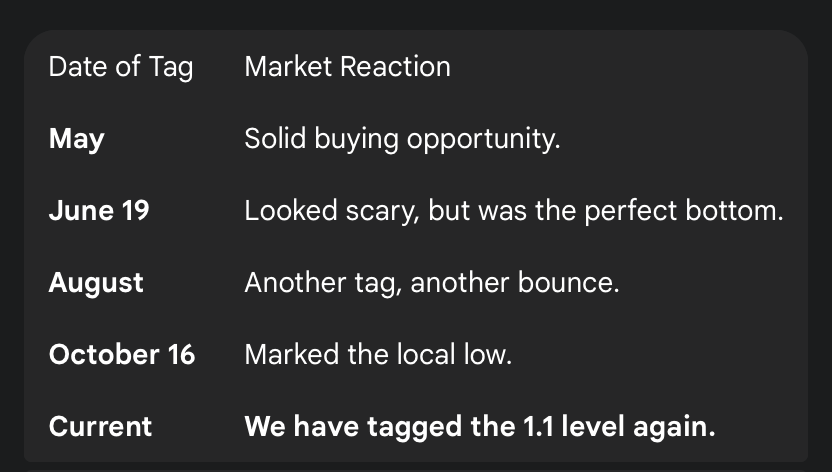
Despite the fear, we are seeing high-probability contrarian indicators flashing. The VIX/VIX3M has tagged the critical 1.00 Overbought/Oversold (OB/OS) level a rare signal that has historically marked medium-term bottoms in May, June, August, and October this year. Furthermore, our proprietary 6-Week Fed Cycle Strategy suggests that assets like the S&P 500 and DAX have hit key percentile accumulation zones (specifically the 75th percentile on the S&P), offering a potential bounce heading into December.
In this post, we will break down:
Crypto Flows: Why Stablecoin dominance at 8% is the line in the sand for the bull market.
Risk Barometers: How blowing-out credit spreads are signaling a potential Bitcoin bottom near 70k.
The VIX 1.00 Signal: Why maximum fear might be the perfect buy signal for equities.
The 6-Week Cycle Masterclass: A complete breakdown of how to trade the price ranges between Fed meetings to eliminate emotional decision-making.
Actionable Setups: Specific entry, stop-loss, and target levels for the S&P 500 and Oil.

Crypto Markets: The Leading Indicator for Risk
We begin with crypto because, right now, it is acting as the primary leading indicator for broad market risk. Crypto assets sit furthest out on the risk curve; when investors feel “risk-on,” they flock here first. Conversely, when liquidity tightens and investors need to take chips off the table, crypto is the first asset class to get sold.
Currently, Bitcoin, Solana, and Ethereum are unanimously telling us that investors are retreating. However, a sell-off does not automatically imply a crash. We need to determine if capital is leaving the ecosystem entirely or simply rotating to find better value.
Stablecoin Dominance: The 8% Threshold
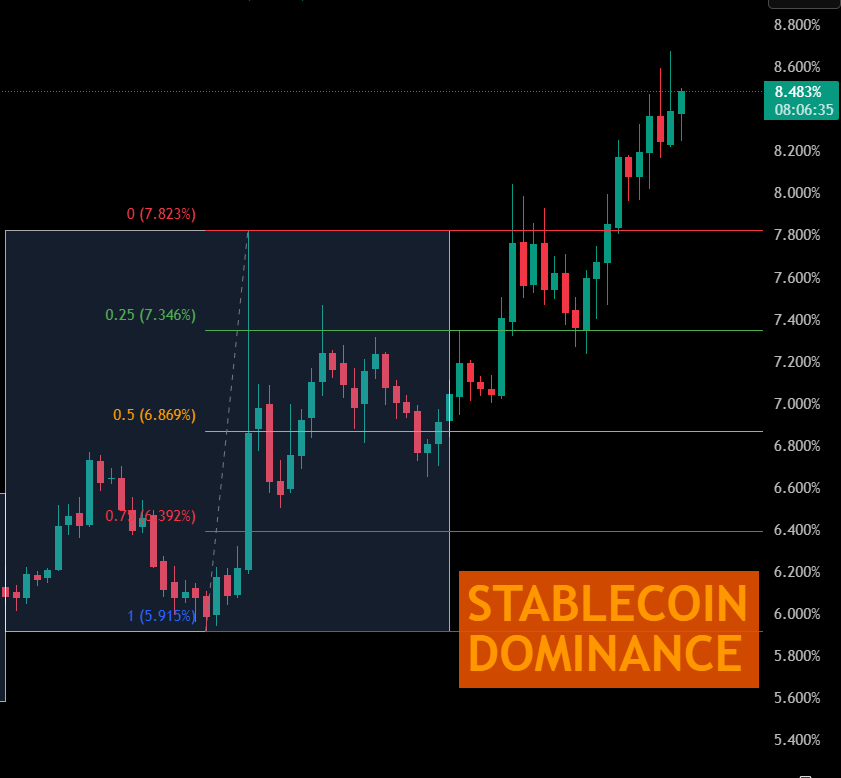
The most critical chart to watch right now is Stablecoin Dominance. This metric tells us what percentage of total crypto liquidity is sitting on the sidelines in dollar-denominated stablecoins.
Current Level: Approximately 8%. This is high levels we haven’t seen since around November of last year.
The Risk: If this 8% level flips and dominance pushes aggressively toward 10% or 11%, crypto liquidity will get squeezed. The probability of a sustained rally in this current Fed cycle is less than 10%.
The Bull Case: For a rally to sustain, we need to see this metric trickle back down toward the 6% level.
Currently, the chart is breaking out bullish (meaning investors are fleeing to stables).
Altcoin and Bitcoin Dominance
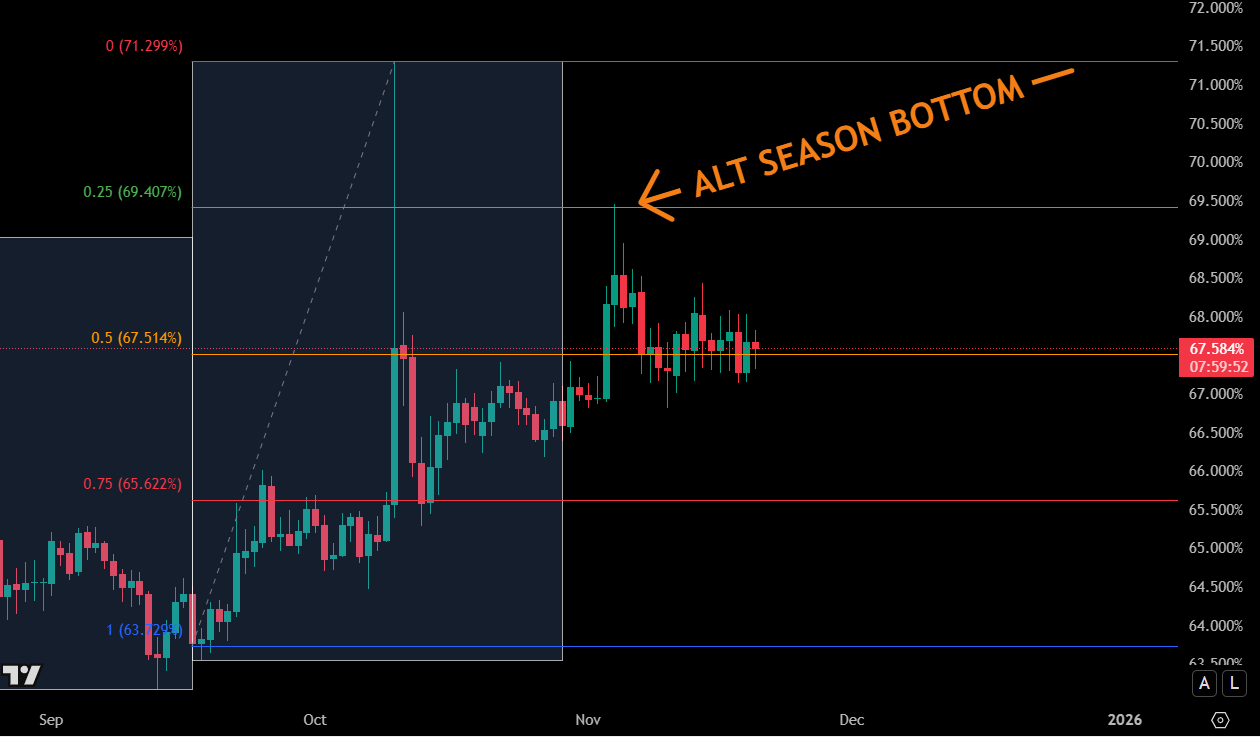
Interestingly, the Stablecoin plus Bitcoin Dominance chart is holding up fairly well for altcoins. This supports the thesis that money is not leaving the crypto market in a panic; rather, it is rotating out of core coins and getting stashed around the network to buy other assets at cheaper levels.
This aligns with our long standing outlook for a multi-month bottoming process in the September-to-December window of 2025:
Ethereum Example: We entered September at the highs (no buy zone). The dump on October 10th provided a setup, but flows suggested lower levels were coming. Those lower levels are now being achieved.
Outlook: We are on track for a strong bid opportunity in December, ideally coinciding with the start of the new Fed cycle (post-December 17th). The market is shaking out weak hands, but the altcoin market has not “tapped out” it is finding value.
Macro Risk Barometers: Yields, Spreads, and Volatility
To confirm if this is a “buy the dip” scenario or a “run for the hills” event, we look at three specific institutional gauges.
1. Real Yields vs. Equities
Real yields are stalling at their highs, but they are not falling off a cliff. Crucially, they are diverging from the S&P 500.
The Dynamic: Equities are down, but real yields are up. This combination tends to be bullish for the US Dollar. Until this relationship changes, we view the market through a lens of dollar strength. If yields were crashing alongside equities, that would signal a true systemic risk-off event, which we are not seeing yet.
2. Credit Spreads (The High-Yield Index)
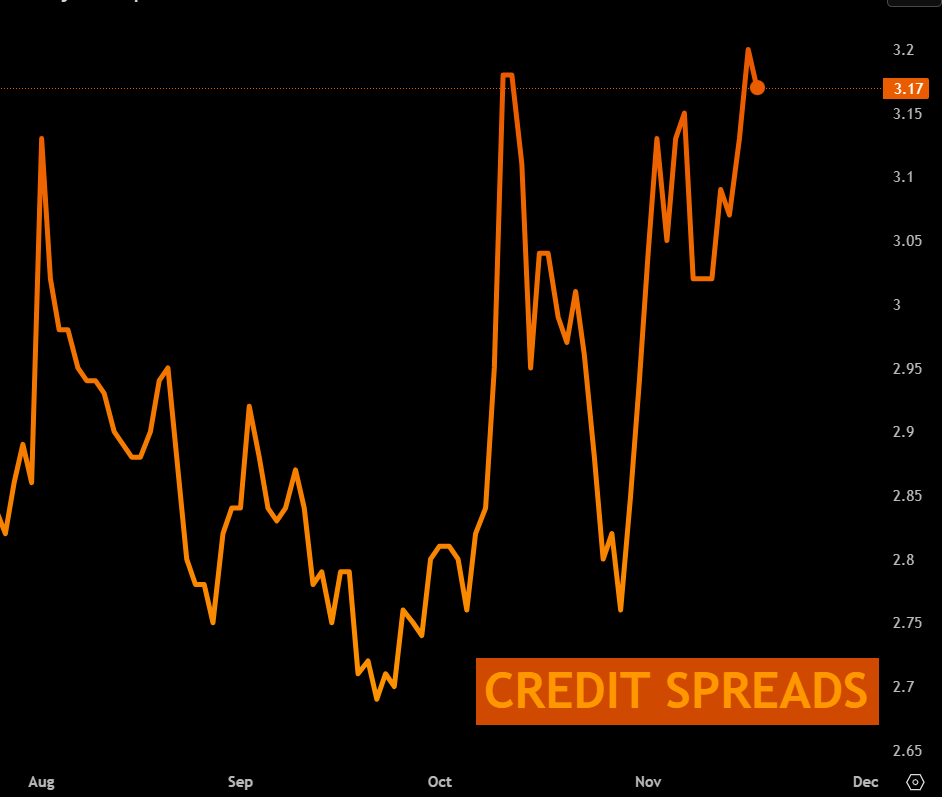
For those unfamiliar, credit spreads measure the difference in yield between a “risk-free” US Government bond and a high-yielding US Corporate bond.
Tightening Spreads (Down): Investors perceive low risk; the gap between government and corporate default risk shrinks. This is “Risk-On.”
Widening Spreads (Up): Investors are worried; they demand a higher premium to hold corporate debt. This is “Risk-Off.”
Current Status: Spreads are undoubtedly blowing out. They are spiking up, signaling fear.
Bitcoin Correlation: Bitcoin is highly sensitive to this. Spikes in credit spreads often correlate with bottoms in Bitcoin. Based on the current blowout, we could see Bitcoin test lower levels perhaps the 70k area which would present a very interesting long opportunity.
3. The Financial Conditions Index
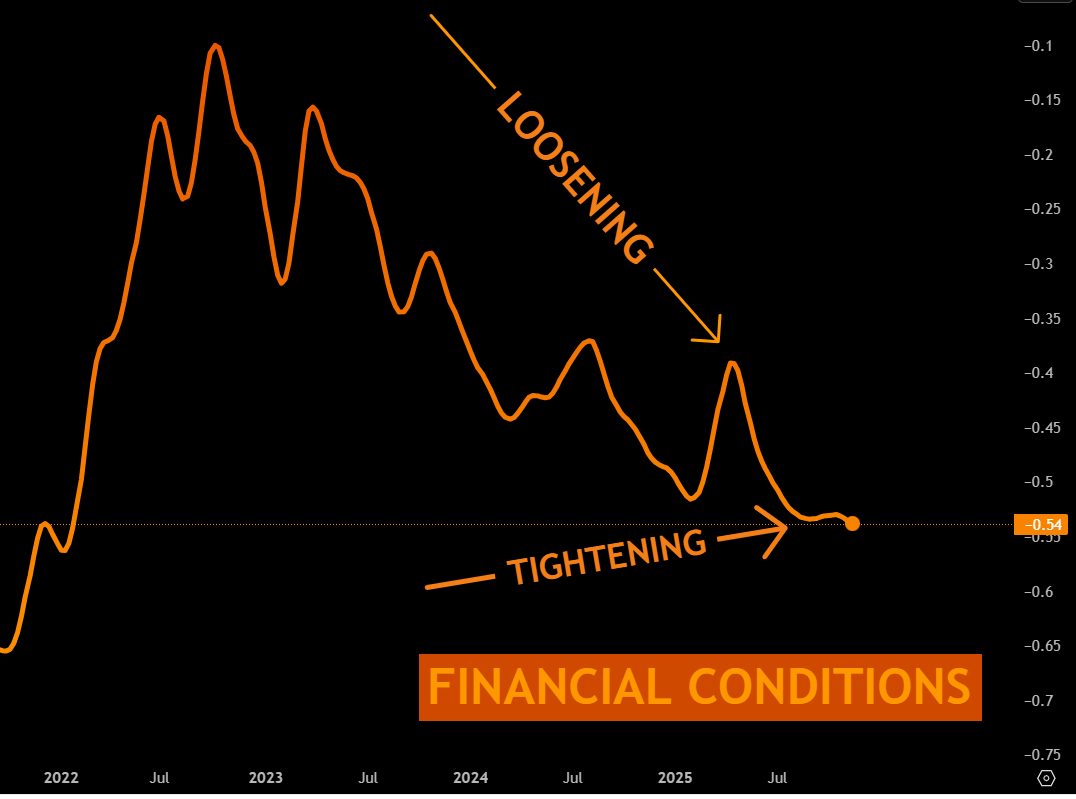
This is a slower-moving, lagging indicator (lagging by weeks/months).
Trend: It has started to bottom out and turn back down. A downtrend here means liquidity is becoming more abundant.
Analysis: While this should be good for crypto, Bitcoin isn’t reacting yet. We likely need to see consecutive moves here to confirm the trend. For immediate trading decisions, Credit Spreads are the faster, more reliable signal.
4. The VIX/VIX3M 1.00 Contrarian Signal
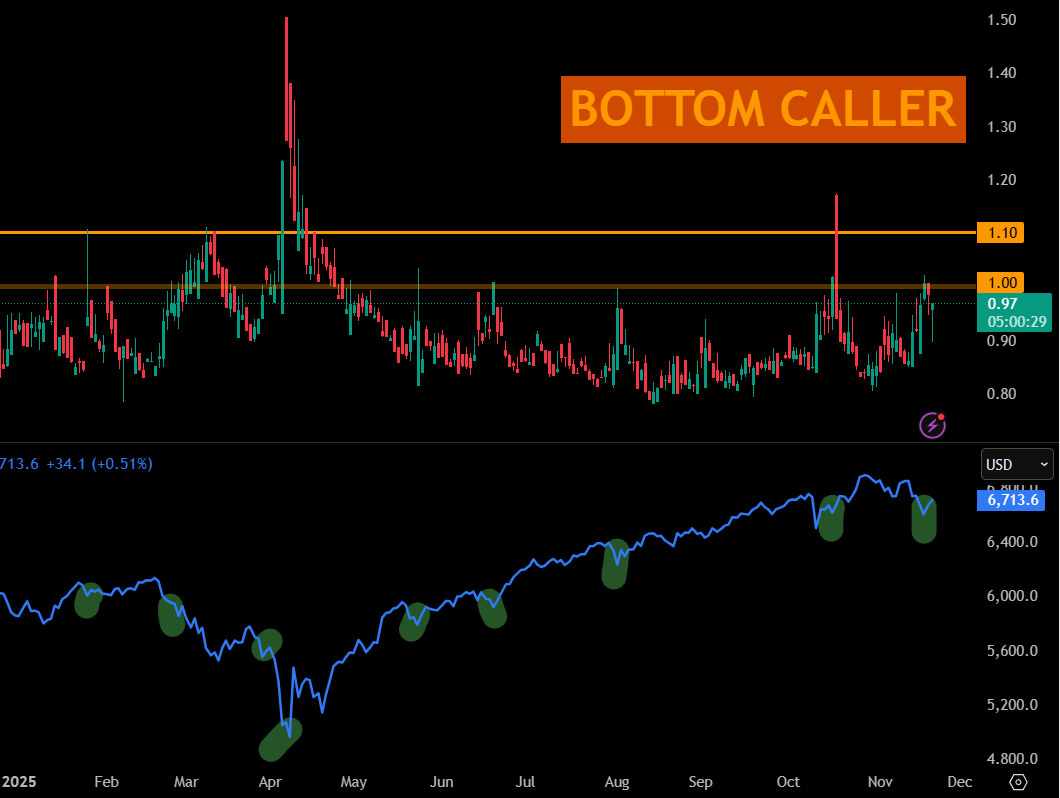
Last night, we highlighted the VIX OB/OS (Overbought/Oversold) level. We specifically look for spikes to the 1.0 level over a three-month term. This is a rare event, occurring only a handful of times a year, but it is highly consistent as a medium-term bottom signal for risk assets like the S&P 500.
Key Insight: While the 1.0 level has a ~70% hit rate, the 1.1 level is in the 90th percentile of reliability. Fear is high, and no one believes in a turnaround, which is exactly when this signal works best.
The 6-Week Cycle Strategy
Our primary methodology for navigating these volatile conditions is the 6-Week Fed Cycle. This strategy streamlines decision-making, removes emotional biases, and keeps traders on the right side of institutional flows.
The Core Concept
Between every Federal Reserve meeting, institutions create a specific price zone. They accumulate or distribute positions within this range.
Current Cycle: Established between the September 17th meeting and the October 29th meeting.
The Rule: If price breaks out and closes outside this range, the probability of it reversing all the way to the otherside of the range before the next Fed meeting is less than 10%.
Next Meeting: Scheduled for December 17th.
Implications for DAX Today
Because we have broken out, even if we get a “Santa Rally” or tax-season bounce, it is highly unlikely we will punch back to the highs of the previous range before December 17th. The most likely scenario is a bounce followed by frustrating chop until the new cycle begins in mid-December.
Execution: How to Trade It
We divide the Fed Cycle range into quartiles: 25th, 50th, and 75th percentiles.
Entry: We buy/sell at these percentile lines.
Risk Management: Stops are placed outside the master range.
Compounding: If the trade moves in our favor to the next percentile (e.g., 25th to 50th), we add to the position and move the stop loss on the first position to lock in profit. This allows us to have multiple positions running while only risking floating profit.
direction of the breakout is depending on macro forces
Case Study: The DAX
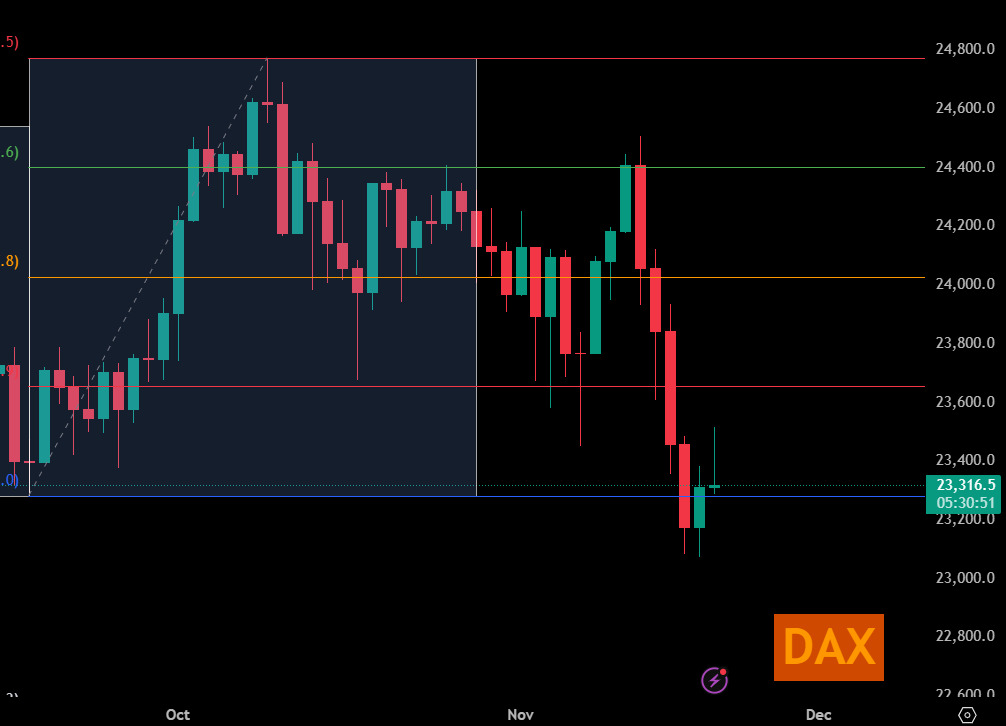
In the current cycle, the DAX offered a perfect bearish setup. It bounced off the 75th percentile, offering an entry. It dropped to the 50th and 25th, allowing for add-ons. Retrospectively, selling at these levels (three positions running) would place a trader well in the money today, with minimal time spent staring at charts.
Actionable Setups and Outlook
Based on the convergence of the VIX 1.00 signal and the 6-Week Cycle levels, we are eyeing specific setups.
S&P 500: The Contrarian Long
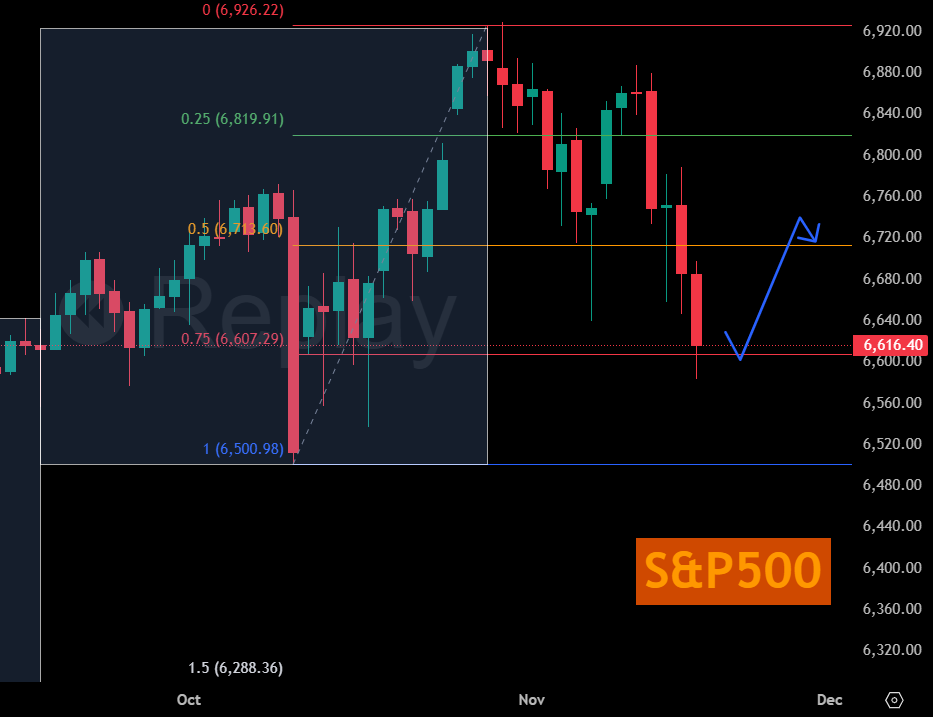
The S&P 500 has dropped into the 75th percentile of its cycle, roughly the 6610–6660 area.
The Setup: With max fear in the market and the VIX spiking, a rally from here is a high-probability play.
Entry: 6610–6660 zone.
Target: A move north of 6700 in the short term. We are looking for a potential 150-point move (equivalent to a ~400-point move on the NASDAQ).
Stop Loss: Approximately 6550 (Or outside the range).
Note: NVIDIA (NVDA) earnings are approaching. The data itself matters less than the market’s reaction. If the reaction aligns with our bullish bounce thesis, we expect the S&P to climb.
Oil
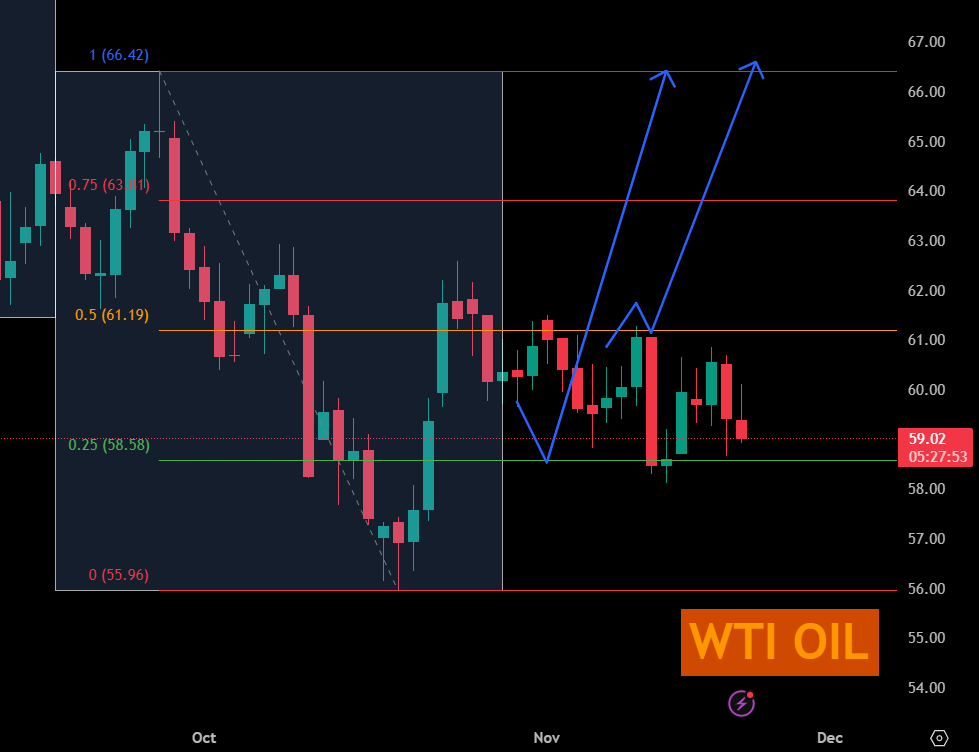
We remain bullish on Oil based on the 6-Week Cycle.
Buy Levels: First buy at 58.46, second buy around 61.
Strategy: Lock position and hold.
Viewer Q&A: Forex Flows and Risk
Question: “Last week you mentioned we need to understand forex flows to understand risk conversation. Could you explain that properly?”
Answer: The Foreign Exchange (Forex) market is the ultimate arbiter of capital flow. It tells us if money is truly fleeing a country or economy.
In a typical “Risk-Off” scenario (where the world is ending), we expect to see “Carry Trades” unwind. This means pairs like AUD/JPY, USD/JPY, and GBP/JPY should be falling off a cliff as investors rush back to the safety of the Japanese Yen.
Current Reality: This is not happening. The Yen is not strengthening significantly.
Context: Japan and China are facing specific regional issues (China restricting travel to Japan, hurting Japanese tourism). This idiosyncratic weakness is preventing the Yen from acting as a pure safe haven right now.
Similarly, the Swiss Franc (CHF) another safe haven is not signaling panic. USD/CHF and AUD/CHF are not crashing.
Key Takeaway: The Forex markets are telling us that risk is not “down the gutter.” The lack of panic in FX supports our thesis to buy the dip in equities (S&P 500) rather than preparing for a total collapse (Note that exact levels and entry times were discussed during the live webinar and at the time of posting may have been rendered clear).
Key Takeaways and Outlook
As we head toward the end of the week, remember that entering a trade is the easy part. The heavy lifting is identifying the risk environment.
De-Risking is Real but Controlled: Crypto is selling off, but stablecoin dominance suggests rotation rather than a total exodus (unless we break 10-11%).
Buy the Fear: The S&P 500 at the 75th percentile combined with a VIX/VIX3m 1.0 spike is a mathematically favorable setup for a bounce.
Watch the Calendar: Tomorrow brings the first NFP (Non-Farm Payrolls) print since the shutdown. This data will be pivotal for the Dollar.
December is Key: We are waiting for the December 17th Fed meeting to potentially reset the cycle and offer a multi-month bottoming opportunity in Altcoins.
Disclaimer: This isn’t financial advice just market musings from the charts. Always do your own research.
Trade Strong
Miad