

Trading Mastery: The Six-Week Fed Cycle, London Fix Strategies, and Navigating Macro Liquidity Flows


Executive Summary
Welcome to the Speculator's Edge deep dive recorded on Wednesday, September 10, 2025. This session provides an exhaustive breakdown of the mechanical strategies we utilize to reduce redundancy and error in trading, alongside a comprehensive macro analysis of the current market environment defined by high liquidity, questionable data quality, and the anticipation of the next Federal Reserve actions. In a market characterized by mechanical behaviors in specific environments, how can traders gain a consistent edge? We explore two core proprietary strategies: the London Fix and the Six-Week Cycle.
The London Fix, occurring daily at 4 PM London time, provides institutional benchmarks that act as critical intraday springboards. This strategy is particularly potent around events like the upcoming US CPI report, where the post-CPI fix consistently generates moves of 70 to about 200 pips (LD Fix Video Primer).
We then dissect the Six-Week Cycle, a strategy designed for accumulating positions ahead of structural breaks between Fed meetings. This method boasts an extraordinary feature derived from nearly a decade of research: “up to 80 to 90% of the time, If there's a move, your stop loss is safe.” This reliability stems from the observation that institutions rarely break both the high and the low of the previous inter-meeting cycle. We review its recent application in Gold, yielding astronomical returns with entries at 3345 and 3400, its success in Apple (AAPL) in July, and its power in crypto. For example, the strategy facilitated Ethereum (ETH) accumulation in June at the 2300 and 2600 levels, capturing the move toward the 4800-5000 level( 6-WK Cycle Primer).
On the macro front, we analyze why markets continue to absorb bad economic news, like the recent NFP data. The driver remains abundant liquidity seeking a home. However, the SPY/TLT ratio (Stocks vs. Bonds), currently at 7.29, indicates a split risk appetite, having stalled since hitting 7.42 in July. Money is flowing into both equities and safe havens like TIPs (Treasury Inflation-Protected Securities), causing the velocity of the S&P 500 rally to slow. This liquidity has significantly spilled over, driving Ethereum’s recent 91% leap.
We examine the stagnant US Dollar, which hasn't moved since April, maintaining a bullish bias on EURUSD toward 1.18. A major theme is the low quality of economic data, highlighted by job revisions being off by nearly 1 million, causing market skepticism and keeping the 10-year yield stuck around the 4% level. Looking ahead, the next Fed meeting is pivotal, featuring the new Summary of Economic Projections (SEP). The market currently prices in six 25 basis point cuts through October 2026, targeting a rate of 2.75%-3.00%. We explore the long-term expectation that the Fed will eventually be forced back into Quantitative Easing (QE) when bond market volatility (the MOVE index) explodes.
Key Takeaways from this Session:
Mechanical strategies like the London Fix and Six-Week Cycle are essential for removing discretion and focusing on direction and risk management.
The Six-Week Cycle offers unparalleled stop-loss safety (80-90%) when identifying structural breakouts between Fed meetings.
Liquidity remains the dominant force, supporting risk assets despite slowing economic data, but the velocity in equities is slowing (SPY/TLT ratio sideways).
The market is increasingly skeptical of low-quality economic data, impacting yield movements and near-term Forex trends.
The upcoming Fed meeting and SEPP will dictate the next cycle, with expectations for continued rate cuts and eventual QE.
Current Positioning: Maintaining a calculated approach, holding long positions in Gold and the DAX.

Note: The Role of the Substack and Webinars
The Speculator's Edge Substack serves as a critical repository for summarized versions of all webinars. It allows members to quickly figure out, in under a few minutes, what charts were discussed, what’s important, and provides a constant reference point. This is particularly useful during busy weeks when you may not be in the mood to listen to a voice talking for 40 minutes or so.
However, the core will always be the live webinars. These sessions allow for discussions in greater detail, imparting micro nuances, and facilitating interactive learning where members can question back to then learn and take away from the discussion. The webinars and the Discord community are the primary vehicles for growing together as traders.
A Quick Discord Structure and Community Interaction View
The Discord server is meticulously broken down into different types of sections to streamline information. Dedicated channels exist for:
Equities
Crypto
Altcoins (Alls)
Forex
Commodities
Indices
Traders Chat (separate)
This structure ensures focused conversation and efficient access to relevant analysis.
🎉 Exclusive for Subscribers Only!
For the next 3 days ONLY, you can unlock a special discount just for being on this list.
Don’t miss it. When it’s gone, it’s gone.
Mastering Mechanical Trading: The London Fix and Six-Week Cycle
In trading, we try to take as much as possible away from the discrepancies. We try to reduce redundancy, reduce error, and just get better at everything we do. In the quest to achieve this, we have found that the market is very mechanical in some particular assets and environments. Two core strategies utilize these behaviors to provide a statistical edge, forming an arsenal for continuous profit extraction throughout the year.
The London Fix: Institutional Benchmarks and Daily Springboards
On a day-to-day trading basis, the London Fix is a crucial mechanical strategy rooted in institutional behavior dating back to the 90s.
The Mechanism and Rationale:
Every day after 4 p.m. London time, major London banks fix prices across all assets, including forex, commodities, and equities. The purpose of this is twofold:
Benchmarking Portfolios: If a client rings up in the evening or morning and asks their money manager about their profits, the manager does not look at the live market because that can change mid-conversation. They look at whatever fix has been provided to calculate the portfolio value.
Rebalancing Portfolios: Bizarrely, the money manager will also use that fix to rebalance the portfolio.
This institutional reliance makes the London Fix profoundly important and ensures it will continue being important.
Trading Application:
We use the London fix as a springboard to get into a trade. On an intraday chart (typically the hourly chart), we isolate the 4 p.m. London time candle. The range of this candle creates a zone that tends to become important for major moves the following day.
Entry Triggers: Entry relies on lower timeframe nuances like a two-bar reversal (explained in the resources on the Discord channel) or a static move like a pin bar. Price action is key to get into those moves.
Risk Management: Majority of the time, this strategy is used when a macro view is already established. The zone primarily helps manage risks, which is another word for stop loss. When you have a macro tailwind, “It just literally, it taps it and just goes. And it's very, very lucrative.”
Cross-Asset Applicability: This phenomenon occurs across every single asset, including crypto. It was notably effective during Bitcoin’s intense rally in 2024 and this year, where on a daily basis, it was “literally tapping the level, going higher, tapping the level, continuing higher.”

Created with TradingView

Key Fixes and CPI Volatility:
While the fix occurs daily, certain days hold more importance:
Tuesday Fixes: Tend to be fairly important for movements within the week.
Thursday Fixes: Tend to be important for the following week.
Arguably the most important fix of the entire month is the London Fix for the CPI report of the United States, as it moves the market quite dramatically. The London fix after the CPI tends to create larger moves, catapulting price one way or another to the tune of 70 to about 200 pips, fairly consistently. The level for the upcoming CPI fix on Thursday will be communicated for potential trades.

You can learn more about it here: LD Fix Video Primer
The Six-Week Cycle: Accumulating for Structural Breaks with High Safety
The Six-Week Cycle is a great way of accumulating a position in anticipation of a structural break. Its defining characteristic is its unparalleled reliability in protecting capital. As emphasized in the session: “I love it this much because up to 80 to 90% of the time, If there's a move, your stop loss is safe. And I have never met, never seen a strategy like this in the market that keeps your stop loss safe every single time.”
This strategy becomes very relevant as we will have a new six-week cycle starting next week.
The Core Principle:
The strategy isolates the high and the low of the price action occurring between one Fed meeting and the other. Instead of taking monthly or quarterly candles into consideration, it focuses strictly on the inter-meeting period.
The foundational discovery, based on deep research and eight or nine years of work, is that banks and market institutions do not break both the highs and the lows within the subsequent six-week cycle.
If the market breaks up, the direction will continue being up, and it is unlikely to reverse and break the low within the same cycle.
Alternatively, if it breaks down, it's unlikely to go back up as well within the same cycle.
This provides a significant operational opportunity. If we know with great certainty the market can only break out to one side, all we need to do is find out which side we're about to break out. This allows traders to stop focusing on price movements, volatility, stop placement, and entry timing.
The Entry Strategy and Modified Fibonacci Levels:
Once a directional bias is established (e.g., bullish), we draw a modified Fibonacci level over the previous six-week cycle's range to identify buying zones.
Modified FIB LevelApplication0%The High of the previous cycle25%Potential accumulation zone50%Potential accumulation zone75%Potential accumulation zone100%The Low of the previous cycle
The strategy involves buying these lower levels (e.g., the 25% band activated) in anticipation of an upside breakout. The stop loss is usually placed behind the 75% level, or sometimes the 100% level, depending on the market environment.
Strategic Advantages and Limitations:
This mechanism allows traders to scale into positions and lean into bigger trades without using much brain power. It is scalable for any account size, from $10,000 to $500 million. When working within these bigger positioning zones, traders can disperse and hide their entry, which is crucial in illiquid markets where size could move the price (though Gold is big enough to trade $1 billion without being noticed).
The primary limitation is the requirement for patience, as traders often want quick results today rather than waiting six weeks for a trade to play out. It is a mechanism to get into trending moves and shines when combined with macro conviction to pick the right market at the right time.
Applying the Cycle: Case Studies in Gold, Apple, and Crypto
The versatility and strength of the Six-Week Cycle strategy are evident across various asset classes. It works with stocks and phenomenally well on crypto, including altcoins, which was initially unexpected but proved great.
Gold (XAUUSD) - The Recent Astronomical Move:

The strategy recently demonstrated its power in the gold market, where it really shines.
In the current cycle, a long bias was identified.
Entry 1: We got in at 3345, keeping risk management around the 3280 levels.
Entry 2: A second position was opened at 3398.
The anticipation was a break higher, which occurred as Gold launched significantly from these consolidation zones. (Note: Gold had previously done nothing in the Six-Week Cycle since May, following a breakout in April).
Apple (AAPL) - Equities Application:
We traded Apple back in June/July using this strategy. The previous six-week cycle was mapped out, we bought within those zones, and “you can see it absolutely pulled away from those prices.”

Bitcoin (BTC) - Scaling in During Fear:
One of the bigger trades was back in May, scaling into Bitcoin when everybody wanted to get out.
The low of the previous six-week cycle was identified at 76,500.
Despite starting low in the cycle, the strategy dictated buying the dips, noting we may scrape lower but don't worry, buy it. Crucially, we never had a lower daily close beyond 76,500.
We bought the 100% level and the 75% level.
As it broke higher, scaling out began when everybody else wanted to buy, with positions largely exited in July.
Ethereum (ETH) - Accumulating the Trend:
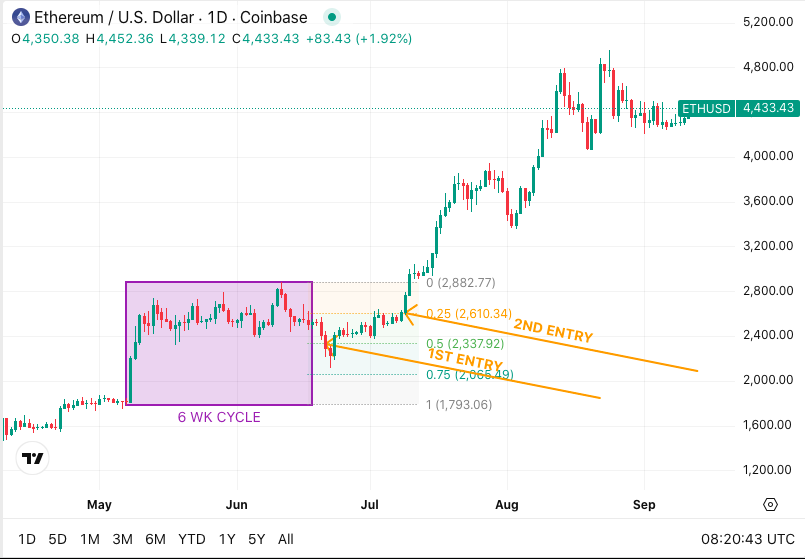
The strategy worked the same on Ethereum. In the previous cycle (June), the accumulation zone provided clear buying opportunities, keeping traders on a buying spree.
Traders would have bought the 2300 level and the 2600 level.
Holding these positions would see them currently sitting near the 4800, nearly 5000 level.
This is how you get into big trending markets, allowing traders to focus on finding direction rather than worrying about timing dips or news events.
You can learn more about it here: 6-WK Cycle Primer
Macro Market Analysis: Liquidity Dynamics, the Dollar, and Data Quality
Turning attention to the broader markets, we analyze the implications of recent data, such as the NFP job losses. Largely, the market has been absorbing the bad news for the dollar in the stock market (like the German DAX or S&P 500) and the US dollar itself. For instance, on the previous NFP around August 1st, the S&P 500 saw a dip towards the 6200 level and has since continued to rally. This tells us a very important thing: while the economy is slow, liquidity is great and keeps trying to find a home.
Analyzing Risk Appetite: The SPY/TLT Ratio
To understand where liquidity is flowing, we look at the SPY/TLT ratio — the ratio between the US stock market (SPY) and the US government bond market (TLT). This is profoundly important for understanding how risk evolves over the weeks and months.
The Ratio: Currently sitting at 7.29.
Rallying Ratio: Indicates the market is more risk-on and wants to find a home where it generates more income (favoring stocks).
Dropping Ratio: Indicates the market is pushing liquidity more towards safe assets like the bond market (as seen in February and April).
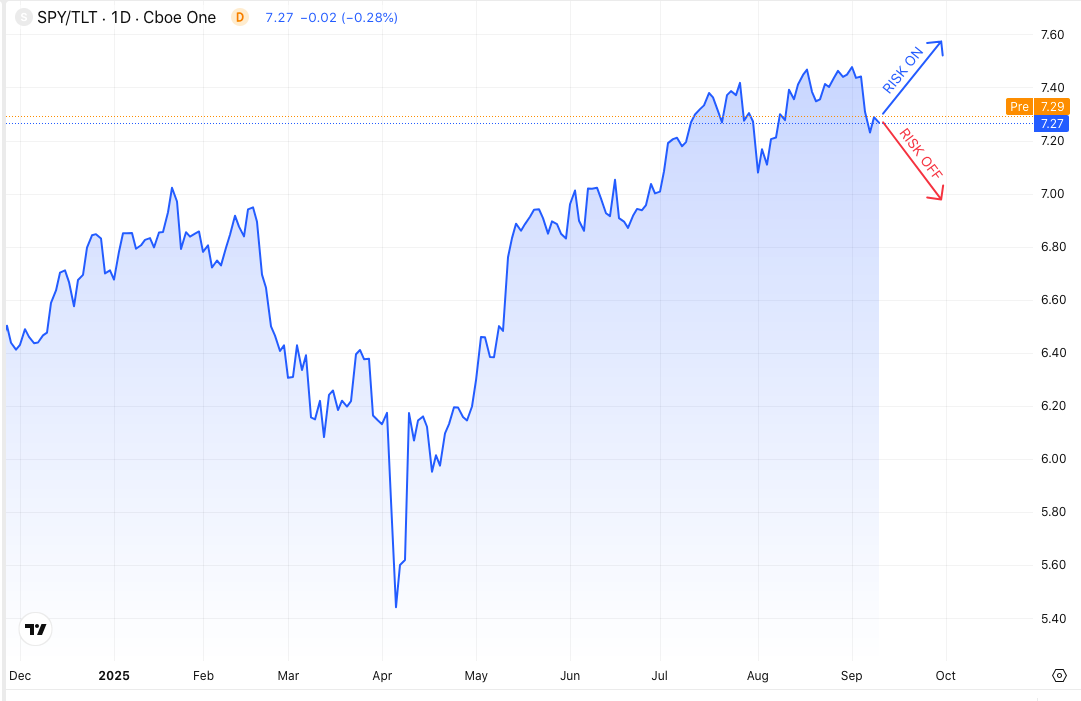

Current Status and Slowing Velocity:
The SPY/TLT chart hasn't created a higher high since it hit a 7.42 ratio in mid-to-late July. Since then, it's been bouncing about. This tells us the risk appetite is shifting towards wanting to take risks in the SPY, but also wanting to be in safe havens, such as US government bonds.
The attention is split. This means the move up in the S&P 500 is more muted, and the velocity of the moves is slowing down because the market is moving towards putting their money into other assets where they protect their money. Money is flowing into bonds, including TIP (Treasury Index Protected Security), which protects gains against inflation down the line.
The Liquidity Spillover: Crypto Rallies and Risks
The key point is that liquidity is there and pushing markets around. These liquidity pockets leak into other assets.
This was clearly demonstrated in Ethereum (ETH). In mid-July, Ethereum leaped about 90% to 91% in a very short time span. This move was driven by liquidity. To some degree, altcoins have also picked up because the market has loads of liquidity and needs to find a place to generate income, which leaves investors to venture further out the risk curve.
The Risk Scenario:
The music stops if the economy starts rolling over dramatically. We have seen the first movements in the jobs market, which is slowing down and not very encouraging. A rotation out of risk assets and into the bond markets will occur as soon as it's crystal clear the economy isn't great and liquidity is going to become an issue. So far, liquidity is not an issue.
The Dollar Dilemma and Forex Stagnation
We have discussed the secular shift towards lower real yields in the United States, which will hurt the US dollar long term. Looking at the Dixie (DXY), the pressure is to go lower, longer term.
However, in the short term, there's no incentive to do anything. The dollar hasn't gone anywhere since April. This leads to less discussion about the dollar in the near term, which is frustrating for Forex traders, but the long-term dynamic remains clear: we are heading higher in EURUSD and lower in the dollar.
EURUSD Target: The inclination remains that we will clip the higher levels at 1.18. Currently trading around 1.17, this implies another 100-150 pip move is on the cards.
Market Speed: The "juice isn't there"; it's a very slow move. It takes self-awareness and respect for the portfolio not to keep pushing luck into assets that are not going anywhere. The focus remains on whatever moves the most and pushes the portfolio furthest (e.g., Gold, indices), not what's more popular.
The Data Quality Problem and Yield Behavior
The Fed claims to be data-dependent, but a significant issue has emerged: the data is really low quality. This realization is impacting market behavior.
When the job revision came out showing they were nearly off by 1 million, yields jumped. This occurred because the market is realizing the data is low quality, there's not really a lot to take away from it, and they need to start making up their own minds.
Yield Expectations:
10-Year Yield: It is currently bouncing off the 4.04% level. The expectation is that it might meet the 4% level and just be stuck here for a while. A massive cascade lower is not expected, nor is a breakdown of the 4% level in the short term, as the market needs a new narrative to price in. This stagnation might give the dollar a bit of a relief rally, though it is not the base case.
Inflation Expectation: Once the Fed cut comes on the day of the cut, it is believed that yields will actually rally again in anticipation of higher inflation, as rate cuts do bring higher inflation.
The Federal Reserve Outlook: Projections, Cuts, and QE
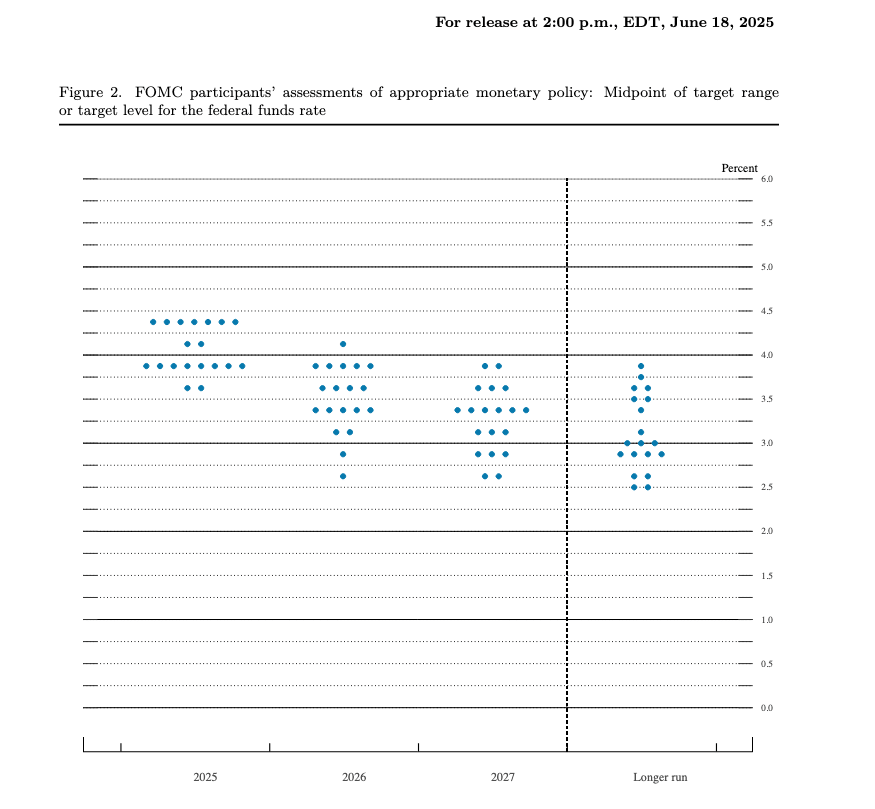
Next week marks the start of the new Fed cycle, and the meeting will be very important because they will release a new Summary of Economic outcomes or Projections (short for SEPP).
The Path of Rate Cuts: Six Cuts to 3%
Currently, the market is expecting a specific path of six 25 basis point cuts:
DateExpected Cut (Basis Points)September 202525October 202525December 202525March 202625June 202625October 202625
This set of six cuts is expected to take the target range to about 2.75% to 3.00%.
Impact on Yields and the Dollar:
The US two-year yield is expected to climb down to that 3% level. It is currently trading at 3.55%. As the DXY chart more or less mimics the movements of the two-year yield, the expectation is for the dollar to come down as well.
The Summary of Economic Projections (SEP) and the Dot Plot
The SEPP covers three very important things but is only published quarterly (June, September, December).
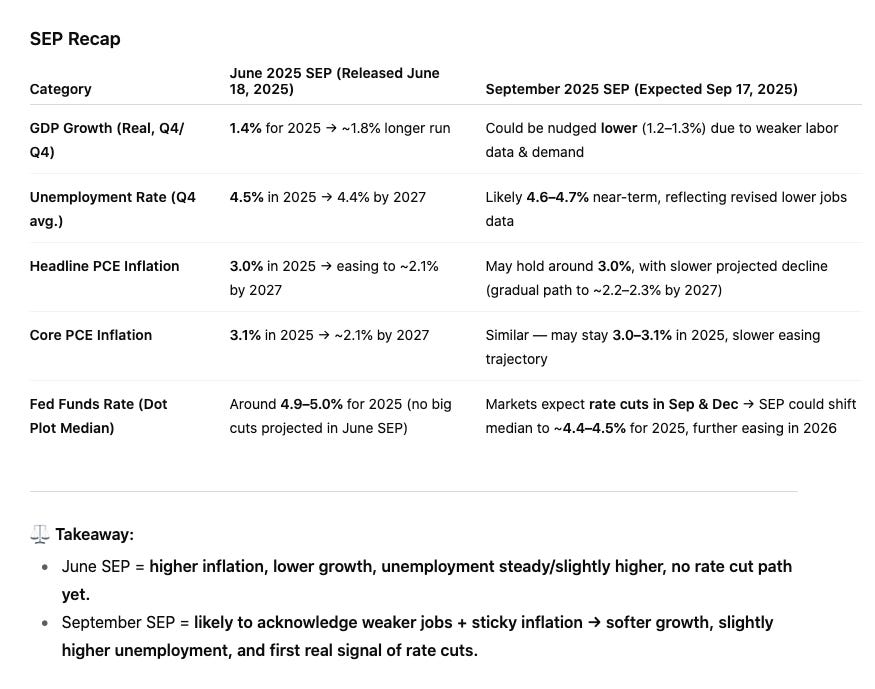
The Last SEP (June):
The June projections indicated:
Inflation: Going higher (forecasted at about 3%).
Growth (GDP): Slower; revised down from 2% to 1.4%.
Unemployment: Somewhat steady but moving up (projected average around 4.5%).
The Next SEP (September):
Given the recent NFP readings pushing towards the upper unemployment level, the next projections are likely to be similar: Inflation around 3% and unemployment pushing towards the 4.5% level.
The Key Focus: The Dot Plot
What the market really wants to look at is the dot plot, which shows the median expectation from all active and voting Fed board members regarding rate cuts for the rest of the year and 2026. This is when you're going to see a repricing of everything, although the impact may be limited to that day if the dots converge at around 3%.
Balance Sheet Dynamics and the Inevitable QE
Looking at the Federal Reserve's balance sheet, it has been moving down (shrinking). This shrinking is viewed as being in anticipation of when they will expand it again.
The Mechanism of the Next Crisis:
Eventually, the bond market is going to have massive moves. The MOVE index (volatility index for the bond market) will at some point explode.
An asset somewhere in the market will underperform.
Participants will have to sell bonds to cover the margins for those assets.
This selling will cause the bond market to temporarily explode.
The Fed will step in, and when they do, they step in big (as seen in March 2020 and September 2019).
When the Fed is forced to buy bonds back again, Quantitative Easing (QE) will kick in. This will lead to a weaker dollar, yields going back down, and significantly more liquidity in the market than we currently had, benefiting all other markets.
Expert Q&A and Current Market Positioning
In the Q&A session, we addressed key concerns regarding the US Dollar's trajectory, the impact of rate cuts on the altcoin market, potential Fed scenarios, and our current trading stance.
The US Dollar and Yield Reactions
Q: What's happened to the US dollar?
The easiest answer is not much in the short term. Longer term, it's moving down. While a relief rally is possible, the quality of the setups aren't that great. The lean is strongly that EURUSD is more likely to attack the upper levels of 1.18 rather than start crashing down immediately.
Q: Is the reason behind why the yields rallied?
Yields are exhausted at these levels, and the market is seeing the data as being low quality, trusting it less and less. Importantly, the data revisions we saw (nearly 1 million offside) weren't really new information; this was already gathered in August and merely solidified that, so it wasn't news as such.
Are Rate Cuts Bullish for Altcoins?
Q: Are rate cuts bullish for alts or are they sell the news?
Because liquidity is fairly good, alts can still perform okay even when the rate cuts come next week. The critical factor is the narrative the market adopts.
Current Narrative (Bullish):
The narrative is still bullish: liquidity is good, rate cuts will help the economy survive the slump, and we are potentially near or just about peak pessimism for the U.S. economy. The S&P 500 and the VIX are not telling us we need to be scared. We continue trading this narrative and will not force a recession trade if it's not there yet.
Potential Narrative Shift (Bearish):
If a rotation comes and the narrative quickly changes, or if the Fed signals the economy is headed for a downturn, liquidity will shift towards bonds and come out of all these other assets. Read this to better understand rate moves and Alt Season.
Scenario Analysis: A 50 Basis Point Cut
Q: What if it's a 50 basis point cut and long end will go up? How will that impact the USD?
If it's a 50 basis point cut, similar to last September, the reaction depends entirely on the Summary of Projections (SEP) and the communication.
Scenario 1: Front-Loading Cuts (Dollar Bullish)
If the SEP indicates they are front-loading the cuts:
Yields will go up quite a lot.
The Dollar will be driven up quite a lot. The dollar is a basket of other currencies, and if the yield goes higher in the US against the Euro, the US dollar will go higher.
We might see a bit of a dip, but the dollar will end up moving higher in the short term.
Stocks will still do okay because that means the liquidity is there.
Scenario 2: Signaling Deterioration (Dollar Bearish)
The dollar would only move lower if the communication states they are ready to cut even more as the economy is deteriorating. But none of that is currently there; they maintain a cautious tone yet.
Current Trading Stance: Calculated and Patient
The current approach emphasizes selectivity and patience. We avoid building narratives that aren't supported by the market yet (e.g., EURUSD 1.20, Bitcoin 125K). The trades taken are very calculated and backed by a ton of stats.
Current Positions:
Long Gold: Still long gold. Skimmed some off, but very patient with the trade.
Long DAX: Currently long the German DAX.
The reason for this calculated approach is that the overall narrative in the market isn't piling into one particular trade. When it's not there, we are very selective. We prioritize being in the right positions to defend them, rather than expending brainpower managing speculative positions.
Key Takeaways and Outlook
This session provided a comprehensive framework for navigating the markets using mechanical strategies and understanding the underlying macro currents. The London Fix (70-200 pips post-CPI) and the Six-Week Fed Cycle (80-90% stop loss safety) offer robust methods for trading, as evidenced by recent successes in Gold (entries 3345/3400), Bitcoin (holding 76,500), and Ethereum (rallying from 2300/2600 to 5000).
The macro environment is defined by abundant liquidity supporting risk assets. However, the SPY/TLT ratio (7.29) indicates slowing velocity as capital also flows into bonds. The long-term outlook remains bearish for the US Dollar (EURUSD targeting 1.18), but the short term is characterized by stagnation and skepticism over low-quality economic data (1 million job revision error), keeping the 10-year yield near 4%.
Looking Ahead:
Volatility is expected this week with the CPI on Thursday and the ECB meeting. Next week, the Federal Reserve meeting and the new SEPP will be crucial, driving market narratives all the way to October. The market awaits the dot plot to confirm the expected six rate cuts down to 2.75%-3.00%.
Disclaimer: This isn't financial advice – just market musings from the charts. Always do your own research.
If you enjoyed this deep dive, please share it with fellow traders!