U.S. Indices: Liquidity Dynamics, and the Coming AI Super-Cycle
Executive Summary
The NASDAQ and S&P 500 maintain a bullish trajectory, propelled by AI-driven growth, technical breakouts, and favorable seasonal trends.
Microsoft and Nvidia lead the NASDAQ, while JPMorgan drives the S&P 500 toward a 6200 target.
Tesla presents long-term AI investment potential. Despite monetary tightening, the AI revolution and potential liquidity injections sustain market resilience.
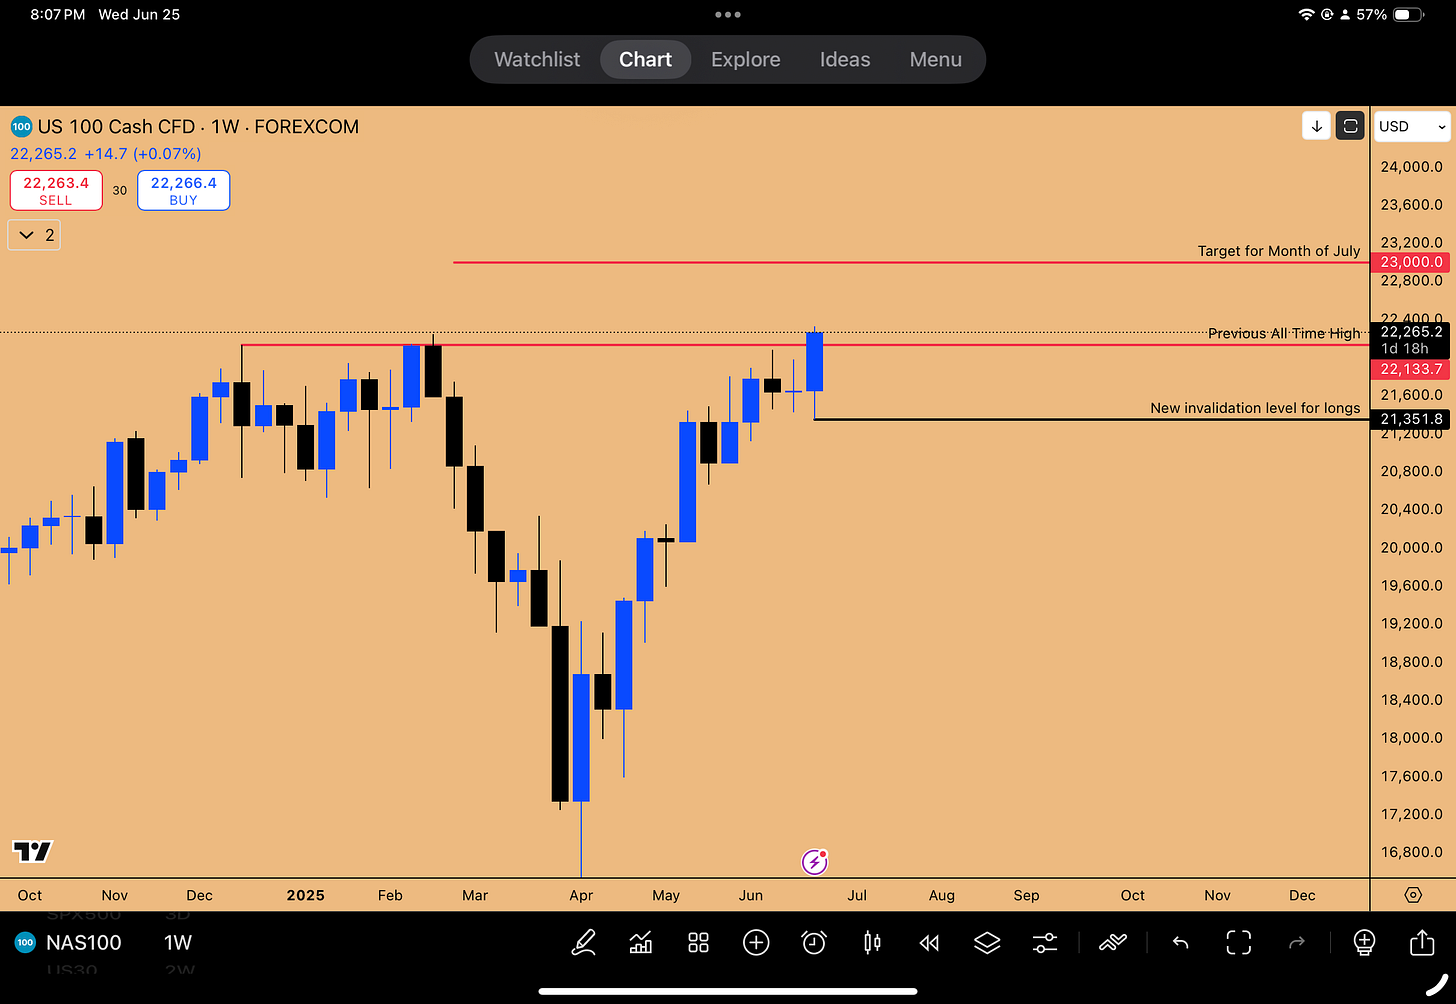
Historical patterns support a NASDAQ target of 23,000 in July.
Hedge fund managers should adopt a long bias, prioritize capital preservation, and await quarterly candle closes for strategic entries.
Disciplined technical analysis and cross-market correlations will maximize returns in this dynamic, AI-fueled market environment.
Market Direction and Technical Framework
This theme encapsulates the overarching bullish trend in U.S. indices, the technical methodologies underpinning trade setups, and strategies for capital preservation.
Market Overview and Directional Bias
The U.S. indices, particularly NASDAQ and S&P 500, exhibit a sustained bullish trend, supported by technical patterns and historical seasonality. The analysis advocates for a long bias, with three-week candle lows serving as critical invalidation levels for directional trades.
Key Insight: Three-week candle lows provide a more robust framework for assessing market direction, filtering out noise from weekly or two-week stop runs.
Rationale for Three-Week Candle Lows
Using three-week candle lows as invalidation points mitigates the risk of premature stop-outs due to stop runs prevalent in shorter timeframes, such as two-week charts. These stop runs often occur when markets briefly breach previous lows before resuming upward momentum, misleading traders relying on tighter invalidation levels.
Capital Preservation Strategy
With month-end and quarter-end approaching, the focus shifts to capital preservation. New positions are avoided to protect gains, reflecting a cautious approach amid potential volatility surrounding key calendar events.
Implication: Hedge fund managers should prioritize risk management over aggressive positioning until the quarterly candle close provides clarity on market direction.
Technical Analysis of NASDAQ
The NASDAQ index has reached all-time highs, driven by a combination of technical patterns and strong performances from key constituents, notably Microsoft and Nvidia.
Inside Five-Day Candle Failure
A notable technical pattern, the inside five-day candle failure, signaled an imminent expansion in NASDAQ’s cash index. This pattern involved the market running the lows of a five-day candle before breaking out to new highs, a setup that provided advance warning of the rally.
Technical Detail: The inside five-day candle failure reflects a consolidation phase followed by a decisive breakout, often triggered by liquidity-seeking price action.
Short-Term Outlook
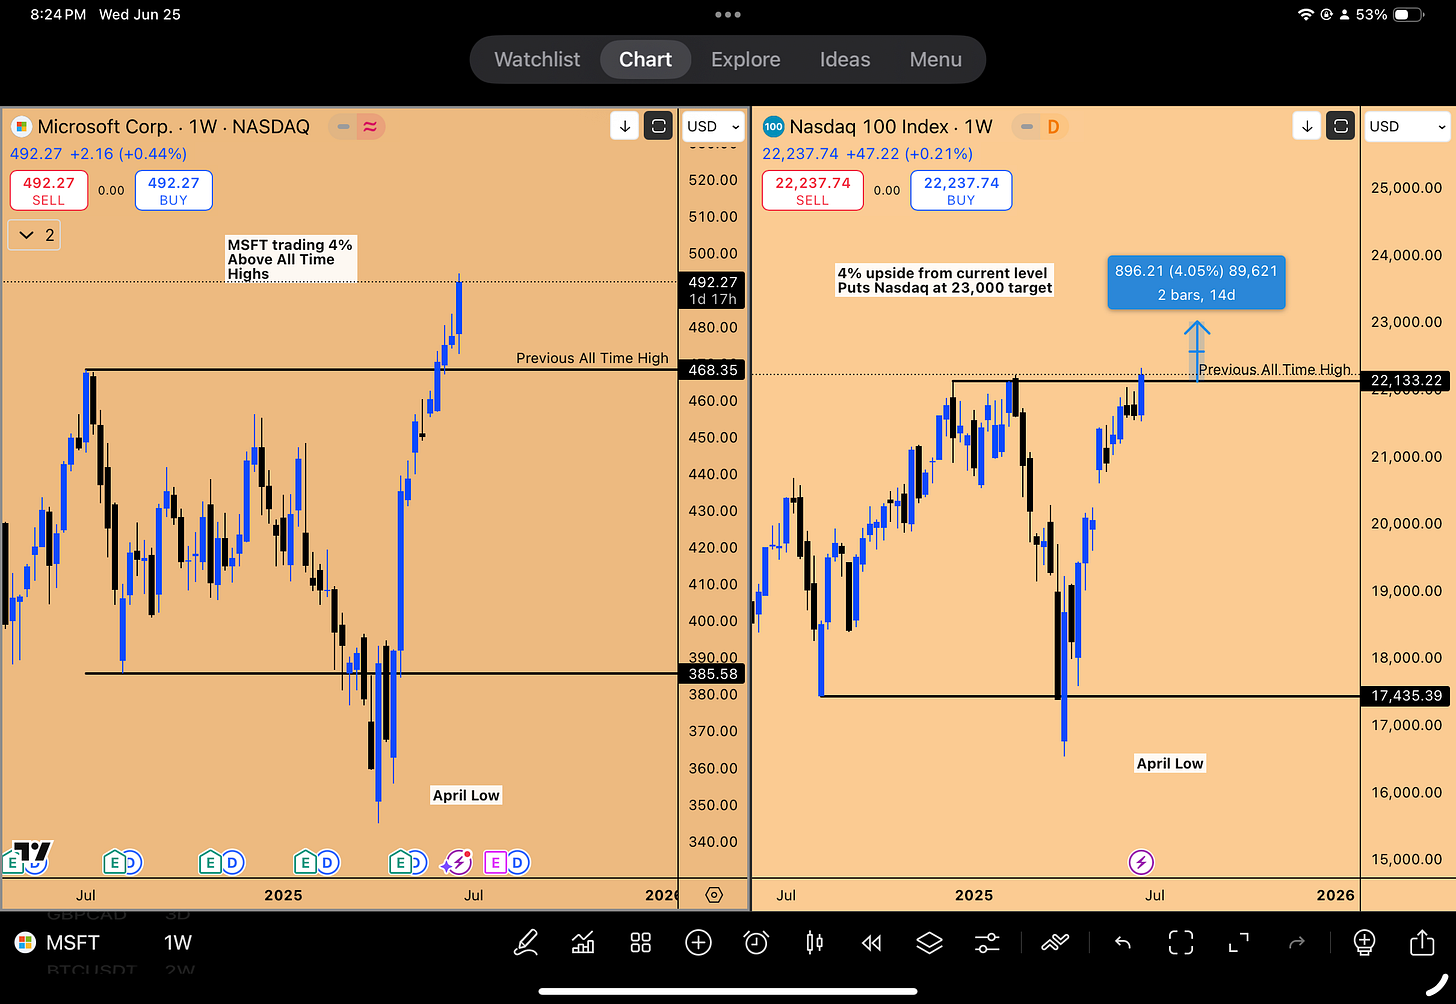
The NASDAQ is expected to consolidate sideways until the monthly and quarterly candles close, with a projected target of 23,000 in July, driven by a new quarterly candle and seasonal strength.
Target: A rally to 23,000 in July represents a critical level, after which a reassessment of market dynamics is advised.
S&P 500 Trade Setup and Liquidity Dynamics
The S&P 500 presents a compelling trade opportunity, underpinned by technical support levels and an open gap signaling further upside potential.
Weekly Support/Resistance (SR) and Inside Weekly Candle Breakout
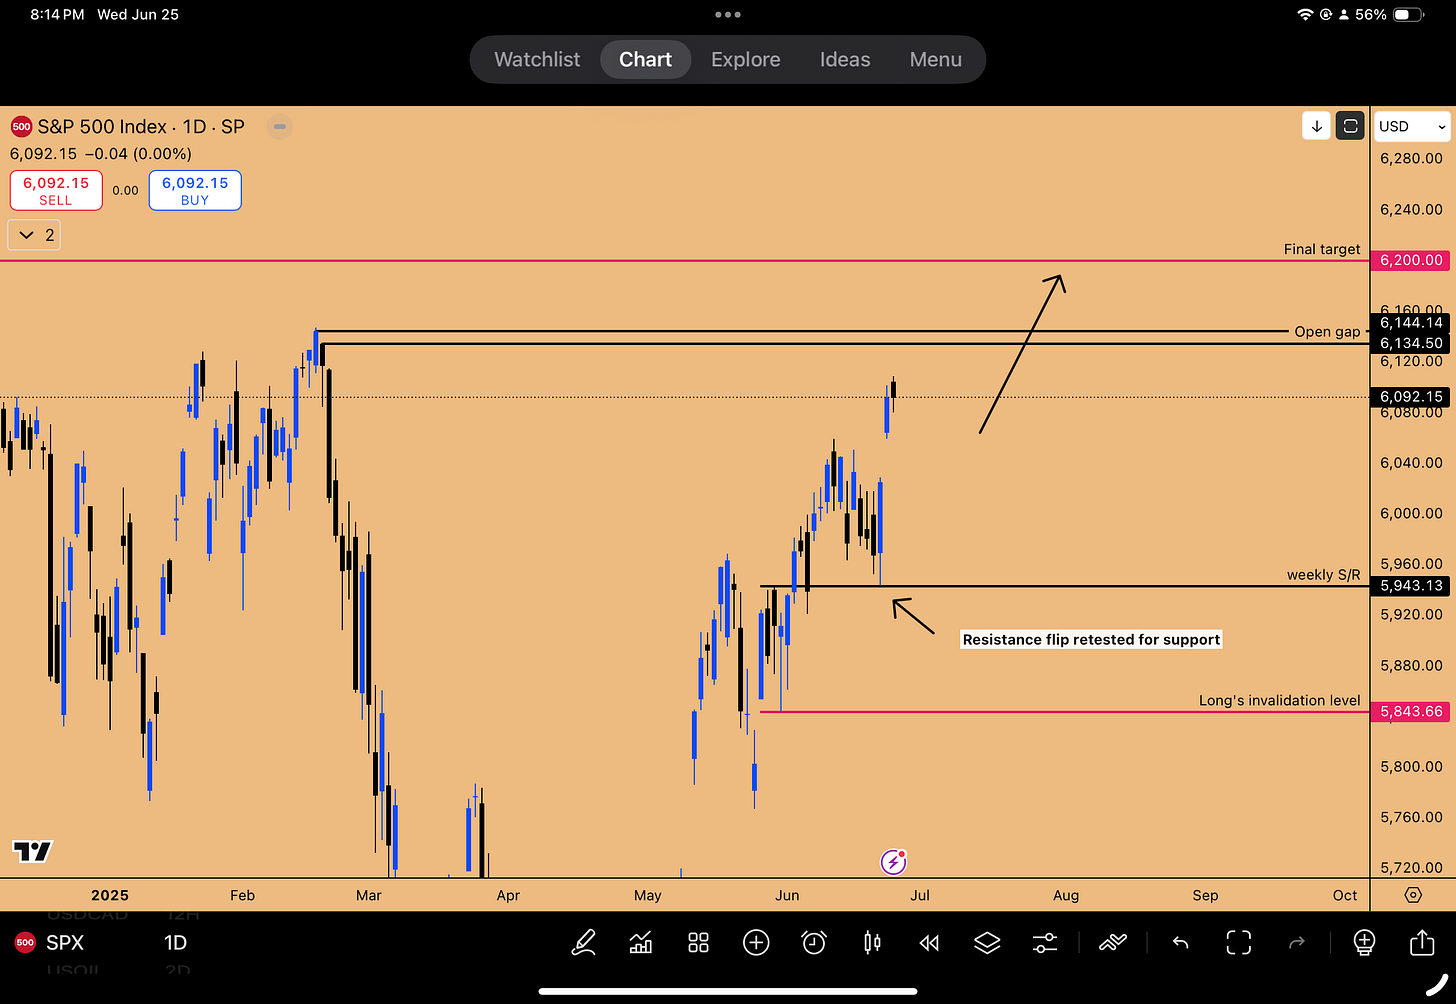
A trade setup in the S&P 500 cash index centers on a weekly SR level, identified by an inside weekly candle breakout. The market retested this SR level post-breakout, confirming its validity as a support zone.
Setup Detail: The inside weekly candle breakout, followed by a retest of the SR level, aligns with bullish market structure, reinforcing the case for upside momentum.
Liquidity and Open Gaps
An open gap in the S&P 500 cash index between 6134 and 6144 acts as a liquidity magnet, drawing price action toward this range. This gap, stemming from the previous all-time high on February 19, suggests a near-term target for the index.
Projection: The S&P 500 is poised to fill the 6134–6144 gap, with a broader target of 6200 based on cross-market correlations with JPMorgan.
News Event Synchronization
Technical levels often coincide with news events, as illustrated by a reported Iranian bombing threat that failed to disrupt the bullish structure. Such events typically trigger tests of SR levels, which hold as support in bullish markets, propelling prices higher.
Observation: Bullish technical setups tend to override negative news catalysts, with markets using such events to test support before resuming upward trends.
Short-Term Price Action and Quarterly Outlook
The near-term outlook anticipates consolidation, with a significant rally expected post-quarterly close, supported by cross-asset analysis.
Weekly and Monthly Candle Analysis
The current weekly candle is poised to close as a bullish order block, with the bottom of this block serving as a new invalidation level. Sideways action is expected until the monthly and quarterly candles close, setting the stage for a July rally.
Technical Note: The bullish order block at the weekly level reinforces short-term stability, with expansion likely in the new quarter.
Quarterly Outlook Preview
An upcoming analysis will evaluate quarterly candle closes across asset classes, including Bitcoin, altcoins, and USD/JPY, to provide a holistic market perspective.
Actionable: Investors should await the quarterly outlook for strategic allocation decisions across equities and alternative assets.
Historical and Seasonal Market Patterns
This theme focuses on historical precedents and seasonal trends that reinforce the bullish outlook for U.S. indices, particularly NASDAQ and S&P 500.
Historical Context and Seasonal Trends
Historical data underscores the bullish outlook, with strong monthly candles in May and June often preceding positive returns for the remainder of the year. This pattern was observed in 2020 and 2019, where vertical rallies followed robust spring performances. The current setup mirrors these periods, suggesting potential for further gains.
Historical Precedent: In 2020, a bottom in April followed by positive May and June candles led to a significant rally into year-end, a trajectory the current market may emulate.
Market Sentiment and Euphoria
Current market sentiment is recovering from bearish extremes but has not yet reached euphoria, suggesting room for further gains.
Seasonal Strength
July historically ranks among the strongest months for U.S. indices, driven by earnings season and Independence Day optimism. This seasonal tailwind supports a bullish outlook for the coming month.
Seasonal Advantage: July’s historical performance enhances the probability of a sustained rally, particularly for NASDAQ.
Euphoria Dynamics
The absence of widespread euphoria indicates that the market has not yet topped. Euphoria is expected to intensify as NASDAQ sustains all-time highs, potentially driving further participation.
Indicator: Monitor sentiment indicators for signs of euphoria, which could signal a nearing peak.
Cross-Market Correlations and Key Equities
This theme highlights the interplay between individual equities and their respective indices, emphasizing the leadership of Microsoft, JPMorgan, and other key players.
Cross-Market Correlations and Key Equities
The performance of individual equities, particularly Microsoft and JPMorgan, serves as a leading indicator for their respective indices, highlighting the importance of cross-market analysis.
Microsoft and NASDAQ
Microsoft’s outperformance, trading 5% above its all-time highs, signals further upside for NASDAQ. As the “alpha” for the index, Microsoft’s strength suggests NASDAQ will continue rallying beyond its recent highs.
Correlation: Microsoft’s 5% premium over all-time highs implies NASDAQ has room to grow, potentially by a similar magnitude, before encountering resistance.
JPMorgan and S&P 500
JPMorgan, the leading equity for the S&P 500, has also printed all-time highs, indicating a 1–2% upside for the index to approximately 6200. The current sideways action in the S&P 500 is viewed as consolidation before an explosive move.
Target: JPMorgan’s performance supports a 6200 target for the S&P 500, representing a 1–2% gain from current levels.
Portfolio Management
The strategy involves closing long positions at all-time highs to lock in profits, reflecting a disciplined approach to capturing gains while minimizing exposure to potential reversals.
Actionable Strategy: Hedge fund managers should consider trimming positions at all-time highs to secure returns, reallocating capital post-consolidation.
Global Indices and DAX Comparison
The German DAX index, while at all-time highs, is unlikely to outperform NASDAQ due to the latter’s exposure to the AI revolution and stronger earnings growth prospects.
NASDAQ and S&P 500 Correlation
NASDAQ and S&P 500 exhibit near-identical price action, with NASDAQ’s higher beta driven by its tech-heavy composition. Any upside in S&P 500 is expected to be matched or exceeded by NASDAQ.
Correlation: A 1% move in S&P 500 typically corresponds to a 1% or greater move in NASDAQ, reflecting their synchronized dynamics.
DAX Performance
DAX’s performance is neutralized against NASDAQ, with both indices at all-time highs. However, NASDAQ’s exposure to AI-driven tech companies positions it for superior returns over the next six months.
Assessment: While DAX offers a viable long position with 4% upside potential, NASDAQ remains the preferred vehicle for growth-oriented portfolios.
Dow Jones Laggard
The Dow Jones, lagging 5% behind its all-time highs, is less attractive for a catch-up trade compared to NASDAQ or S&P 500, given its lower exposure to high-growth sectors.
Implication: Avoid Dow Jones for tactical trades, focusing instead on NASDAQ and S&P 500 for alpha generation.
AI Revolution and Growth Drivers
This theme underscores the transformative impact of the AI revolution on market performance, focusing on leading companies and emerging opportunities.
AI Revolution and Market Growth
The AI revolution, led by companies like Nvidia, Microsoft, and emerging players, is a primary driver of NASDAQ’s resilience and growth potential, largely insulated from monetary policy constraints.
Nvidia’s Influence
Nvidia’s synchronized all-time highs with NASDAQ underscore its role as a key momentum driver, though Microsoft remains the primary pilot of the index’s trajectory.
Dynamic: Nvidia’s performance amplifies NASDAQ’s upside, with its AI-driven growth reinforcing the index’s bullish trend.
IPO Performance and Liquidity
The surge in Circle’s IPO, reportedly up 367% in 18 days, highlights robust market liquidity and enthusiasm for new technologies. Such performance contradicts assumptions of tight monetary policy, suggesting ample capital is fueling growth.
Indicator: Strong IPO performance signals significant liquidity, supporting further index gains.
Other AI Companies
Google, Apple, and Tesla, currently lagging behind Nvidia and Microsoft, offer upside potential. Google, 17% below its all-time highs, is poised for a catch-up trade, while Apple and Tesla are expected to follow suit within months.
Opportunity: Laggard AI companies present tactical investment opportunities for portfolios seeking exposure to the AI sector.
Tesla: A Long-Term AI Investment
Tesla emerges as a compelling long-term investment, driven by its AI integration and technical setup, despite short-term consolidation.
Technical Setup
A double inside weekly candle failure signals short-term downside to a support zone between $261 and $273, presenting a buying opportunity. This zone is expected to hold as a higher low, maintaining Tesla’s bullish market structure.
Entry Point: A limit order at 270 offers an optimal entry for a physical stock position, capitalizing on the anticipated support test.
Long-Term Outlook
Tesla’s potential integration with xAI and advancements in autonomous driving and robotics position it as a leader in AI-driven innovation. The stock is projected to reach all-time highs of 488 by next year, driven by investor optimism and technological breakthroughs.
Projection: Tesla’s AI initiatives could drive a 100% stock price increase, contingent on successful xAI integration and product rollouts.
Investment Strategy
A physical stock position is preferred over leveraged instruments due to high implied volatility in Tesla’s options chain. A balanced approach—allocating 70% to stock and 30% to long-dated call options—optimizes risk-reward for long-term investors.
Recommendation: Prioritize physical stock ownership for Tesla, supplementing with limited options exposure to capture upside while managing volatility.
Microsoft’s Financial Strength
Microsoft’s financial performance, particularly in its AI-driven intelligent cloud segment, underpins its market leadership and investment appeal.
Revenue Growth
Microsoft’s intelligent cloud segment grew from $75 billion in 2022 to $105 billion, adding $30 billion in revenue. This 40% increase outpaces other segments, such as gaming and business processes, highlighting AI as the primary growth driver.
Metric: The $30 billion revenue increase in intelligent cloud underscores Microsoft’s dominance in AI services, fueling its stock performance.
Investment Opportunity
Dips in Microsoft’s stock, driven by external factors like monetary policy, are viewed as buying opportunities, given its robust fundamentals and revenue trajectory.
Strategy: Accumulate Microsoft shares during technical pullbacks, leveraging its consistent revenue growth for long-term gains.
Macro Environment and Strategic Considerations
This theme addresses macroeconomic factors, recession risks, and strategic investment recommendations to navigate the current market landscape.
Monetary Policy and Market Resilience
The analysis challenges the notion that tight monetary policy will suppress indices, emphasizing the AI revolution’s ability to drive growth despite macroeconomic headwinds.
Misconceptions About Monetary Policy
The tech revolution, particularly in AI, renders indices less sensitive to monetary tightening. Historical tech booms, such as the social media surge in 2015–2016 and the internet bubble of 1998, demonstrate that innovation can outpace policy constraints.
Insight: The AI revolution mirrors past tech booms, sustaining market growth even in a tightening environment.
Liquidity Injections
A proposed $2.8 trillion spending bill (requires US Senate approval), if enacted, could inject significant liquidity, further propelling indices like NASDAQ to new highs.
Potential Catalyst: Legislative approval of the spending bill could amplify market upside, particularly for tech-heavy indices.
Recession Risks and Timing
While a recession remains a future possibility, premature bearish bets are cautioned against, with timing critical to avoiding losses.
Historical Context
The 2022 recession followed a 150% market rally, illustrating that recessions often occur after significant run-ups. A similar dynamic may unfold, with NASDAQ potentially reaching 30,000 before a meaningful correction.
Risk Assessment: A recession may occur after a 70% rally, necessitating vigilance but not immediate defensive positioning.
Timing Considerations
Accurate timing is essential for recessionary trades, as mistimed short positions can lead to significant losses in a bullish market.
Strategy: Maintain a bullish stance until technical or fundamental signals indicate a shift, avoiding premature short exposure.
Investment Recommendations
S&P 500 Positioning
For investors considering a long position at the 6000 level with option calls, waiting for the weekly candle close is advised to confirm bullish momentum.
Recommendation: Defer new S&P 500 option trades until next week. Current weekly candle close provides directional clarity going into next week.
Conclusion
The NASDAQ and S&P 500 are poised for continued upside, driven by technical breakouts, AI-driven growth, and favorable seasonal trends. Key equities like Microsoft, Nvidia, and JPMorgan lead their respective indices, while Tesla and laggard AI companies offer tactical opportunities. The AI revolution insulates markets from monetary policy constraints, with potential liquidity injections amplifying upside. Hedge fund managers should maintain a long bias, prioritize capital preservation at key levels, and monitor quarterly candle closes for strategic entries. A disciplined approach, leveraging technical analysis and cross-market correlations, will maximize returns in this dynamic environment.


