

The Liquidity Supercycle

📋 Executive Summary
This week’s analysis reveals an unprecedented convergence of catalysts pointing toward a significant expansion in risk-on assets a “liquidity cocktail” unseen in the past seven to eight years. The central thesis revolves around the VIX (Volatility Index), which has definitively signaled that the low of the quarter is firmly in place on our models. The VIX recently printed a significant inside three-week failure, characterized by a “Darth Vader” candle that swept upside liquidity. This pattern strongly suggests the VIX will deflate over the next three weeks. Mechanically, as the VIX goes down, risk-on assets invariably go up, fueled by a surge in liquidity as Vol-Control funds are forced to close their put protections and increase risk allocation in S&P500 and NAS100.
The most potent catalyst, however, is the impending reopening of the stock buyback window. Currently closed due to earnings season, this window reopens in the first week of November. The impact cannot be overstated: the top 10 companies in the NASDAQ constitute 60% of the index weight. When giants like Apple with approximately $394 billion in annual revenue (FY2024) execute authorized buybacks (often exceeding $100-$120 billion), they artificially inflate their stock prices and pull the entire index higher. This mechanism, combined with powerful Q4 seasonality (November and December historically post record-breaking returns+Santa Rally), sets the stage for a major year-end rally.
Furthermore, the macroeconomic landscape is shifting dramatically. The US Federal Reserve is signaling the end of Quantitative Tightening (QT), the program running since May 2022 that has been draining liquidity ($40 billion monthly). Ending QT opens the floodgates for future Quantitative Easing (QE), reminiscent of the post-COVID environment where Bitcoin rallied 1600% while NASDAQ rallied 150% from 2020 bottom to 2022 high. This massive liquidity influx is already visible globally; the Nikkei index is up 27% this quarter, indicating a contagious global srock rally and that US equities are far from overextended and poised to keep melting up.
How should you position your portfolio for this melt-up? In equities, we are focusing on the laggards. Microsoft (MSFT) is coiled in an inside three-week failure pattern with a near 90% historical strike rate, targeting $555. Meta (META) and Amazon (AMZN) are identified as significantly undervalued. Meta is lagging NASDAQ by 14% relative to February highs but historically outperforms significantly (740% return since the 2022 bottom vs 150% Return for NAS100). We detail a high-conviction options play on META targeting 300% returns. Amazon, poised to revolutionize fulfillment with AI robotics, is targeting $300.
In commodities, Gold remains in a parabolic blow-off phase. The Quarterly RSI is at 88, but historical bubbles peak around 95-96, suggesting the top is not in. We analyze the invalidation logic and provide a setup to long the current pullback targeting New All Time highs. For Bitcoin, while currently consolidating in a double inside weekly pattern, the long-term outlook is hyper-bullish, targeting $1 million within the decade. A significant institutional rebalancing is underway, with capital rotating from MSTR to the IBIT ETF. Furthermore, political developments, including CZ’s potential advisory role following his pardon, are extremely favorable. Short-term, we anticipate a catch-up trade targeting the $120k gap fill.

Key Takeaways from this Analysis:
Bitcoin’s Institutional Maturation: Short-term target of $120k, with long-term bullishness driven by institutional rebalancing (MSTR to IBIT) and favorable policy frameworks.
VIX Deflation Trigger: The inside three-week failure on the VIX is the primary signal for a massive risk-on rally over the next three weeks.
Liquidity Floodgates Opening: The reopening of the stock buyback window in November and the end of QT provide an unprecedented liquidity cocktail.
The Catch-Up Trade: MSFT, META, and AMZN are poised for significant outperformance as they catch up to the broader NASDAQ and the leading Nikkei index.
Gold’s Run Continues: Gold’s parabolic move is likely not over; use pullbacks as buying opportunities until the quarterly structure breaks.
If you’re finding value in our research, we’d like to extend a personal invitation to explore the next level of market analysis within our Speculators Trading community. Our Discord server is a collaborative space dedicated to helping traders optimize capital allocation. Inside, you’ll gain access to our real-time Trading-floor commentary, high-conviction technical setups, proprietary educational resources, and strategic bi-weekly livestreams. We invite you to experience these premium resources firsthand and see how they can enhance your portfolio management. Join us for our weekly livestreams and wednesday macro webinars using Webinar Pass for 39.99 USD/month. If you would like to receive full access to our discord community and timely market updates in the world of finance where information flows at warp speed, Monthly Pass access (99 USD/Month) is the best bang for the buck.
₿ Bitcoin Outlook: NASDAQ Correlation, Institutional Rebalancing, and Policy Shifts
Bitcoin is currently exhibiting complex price action, characterized by consolidation and neutrality on the immediate timeframes, but underpinned by powerful long-term catalysts involving institutional flows, macroeconomic liquidity, and significant shifts in the policy landscape.
The NASDAQ Connection and the QE Sensitivity
Bitcoin and NASDAQ move hand in hand, sharing the same flow of liquidity. While Bitcoin often lags, it eventually catches up and typically provides a better return, acting as a levered bet on NASDAQ (e.g., if NASDAQ goes up 10%, Bitcoin is supposed to go up 30%). The flow of liquidity from current catalysts (stock buybacks) will hit equities first. Profits made in equities will then flow into Bitcoin later.
Bitcoin is extremely sensitive to global macro liquidity, particularly Quantitative Easing (QE).
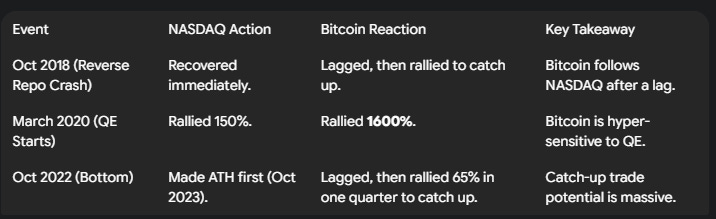
With Quantitative Tightening (QT) coming to an end, the door is open for future QE. When the Fed initiates QE, Bitcoin is the go-to asset and is expected to go “berserk.” Currently, both assets have similar returns from the 2022 bear market high (BTC: 64%, NASDAQ: 50%), but Bitcoin is expected to continue running in a phase of vertical accumulation.
The Great Rebalancing: MSTR to IBIT ETF
A critical development is the institutional rebalancing and the decoupling from MicroStrategy (MSTR). Historically, MSTR served as the primary proxy for institutional exposure. However, with the maturation of the policy framework and the introduction of the IBIT ETF (BlackRock’s Spot Bitcoin ETF), institutions now have a direct pathway.
We are witnessing a rebalancing effect: capital is being pulled out of MSTR and flowing into IBIT. This is evident in the recent price action: MSTR is “getting obliterated” (triggering an inside two-month candle failure), while Bitcoin is resisting MSTR’s decline and moving sideways. This divergence is bullish for Bitcoin. Once this rebalancing is finished, Bitcoin is expected to resume its role as the high-beta play on NASDAQ, potentially posting 50-100% returns in one month.
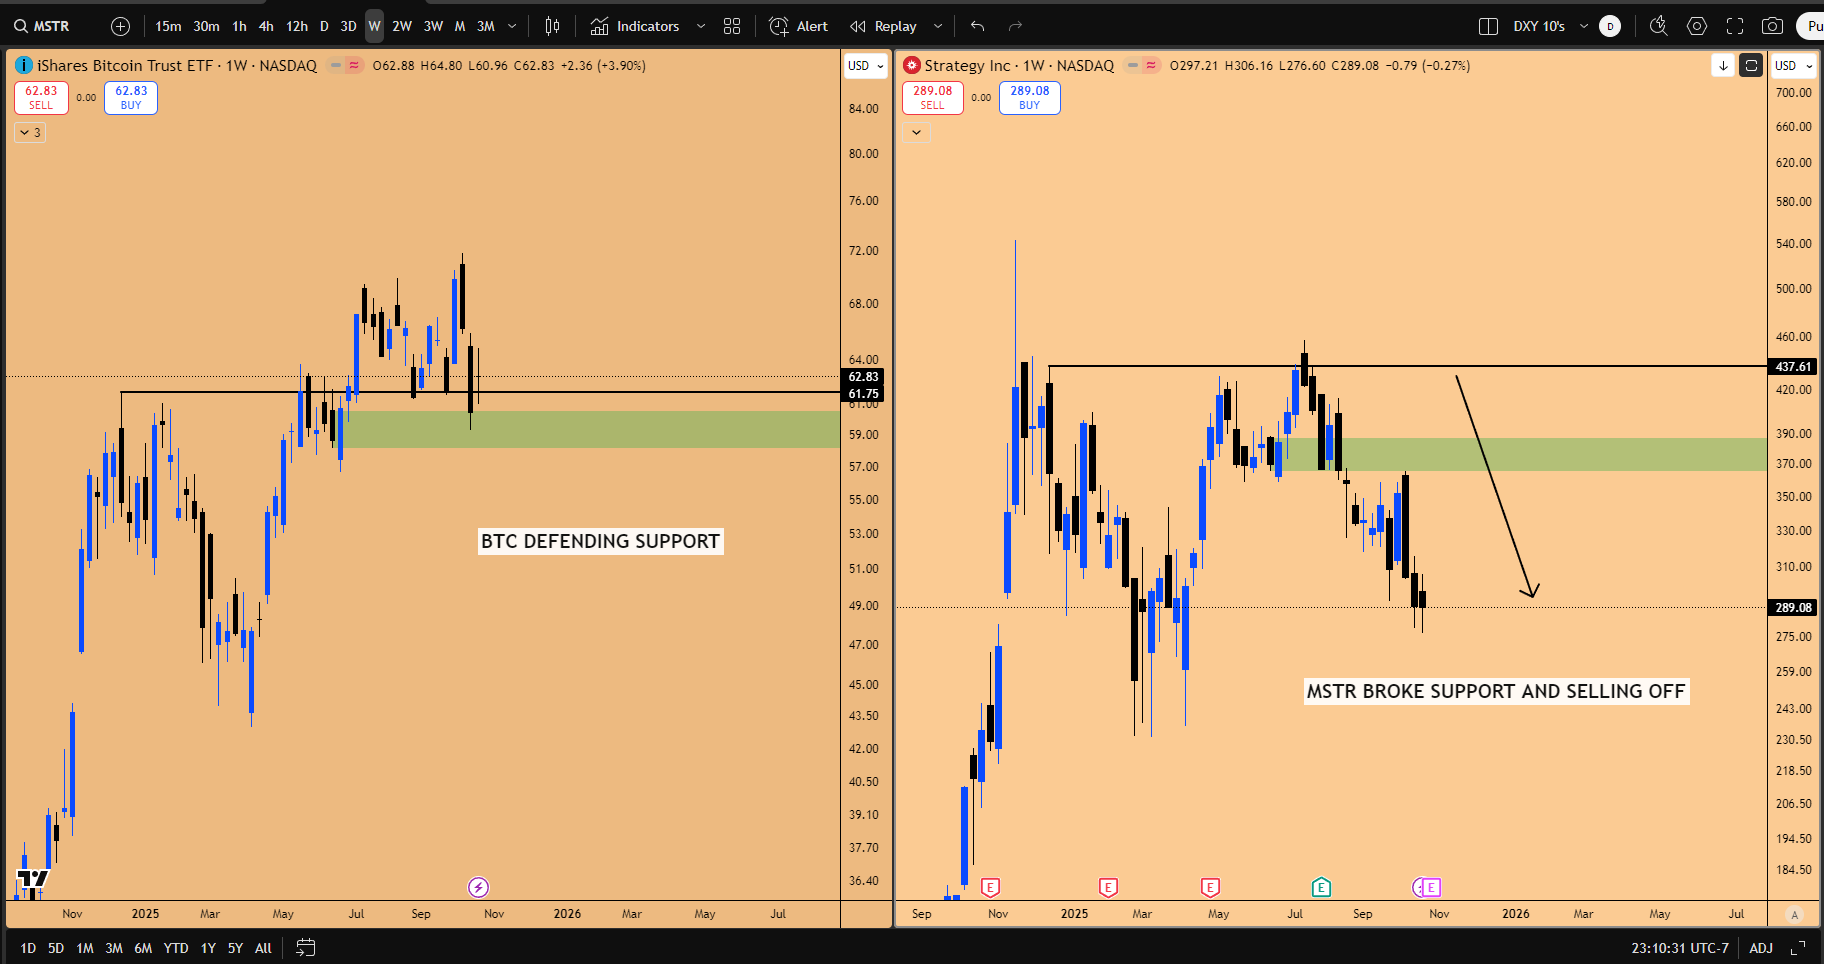
Figure 1: IBIT (Bitcoin ETF) vs MSTR
Policy Tailwinds and the Million-Dollar Trajectory
The long-term outlook for Bitcoin is hyper-bullish, with a target of $1 million per Bitcoin anticipated within the next decade (5-10 years). This is supported by significant developments in the policy framework.
A major, underdiscussed bullish event this week was CZ (former Binance CEO) being pardoned by Trump and appearing in his inner circle at UFC fights. If CZ, who knows the ins and outs of the global crypto industry since 2017, assists the US administration in crafting the policy framework for the next 20-30 years, it will be monumental.
CZ is viewed as the “wild card” who can orchestrate how global institutional players (Japan, Europe, Asia, China) position their capital in crypto markets using ETF’s listed on NYSE in US. If he joins the administration’s crypto team, the pathway to $1 million in the next 5 years becomes significantly clearer. For long-term allocation (5-8 years), Bitcoin is projected to offer a far better bang for the buck than NASDAQ (e.g., 300%-500% vs 100%).
Short-Term Target: $120K and Structural Concerns
In the shorter term, Bitcoin is printing a rare double inside weekly candle, indicating consolidation. The three-week and monthly candles are closing neutrally, failing to confirm a bearish order block. On the quarterly chart, Bitcoin took out the previous quarter’s low, suggesting a possibility of sideways movement for the remainder of the quarter before a new expansion begins in January.
However, with the bullish seasonality effect in play for NASDAQ, a move up in Bitcoin is still anticipated:
Target: The large gap sitting overhead is expected to be filled, targeting the resistance zone at $120K.
Structural Caution: While the macro higher timeframe remains bullish, the intermediate structure is tricky. Bitcoin recently breached a higher low, technically printing a lower low. Traders need to be careful once the $120K rally happens, as it could potentially print a lower high, leading to a prolonged correction to establish another macro higher low relative to the April 2025 low. The only way to invalidate this cautious scenario is for Bitcoin to decisively make a new all-time high.
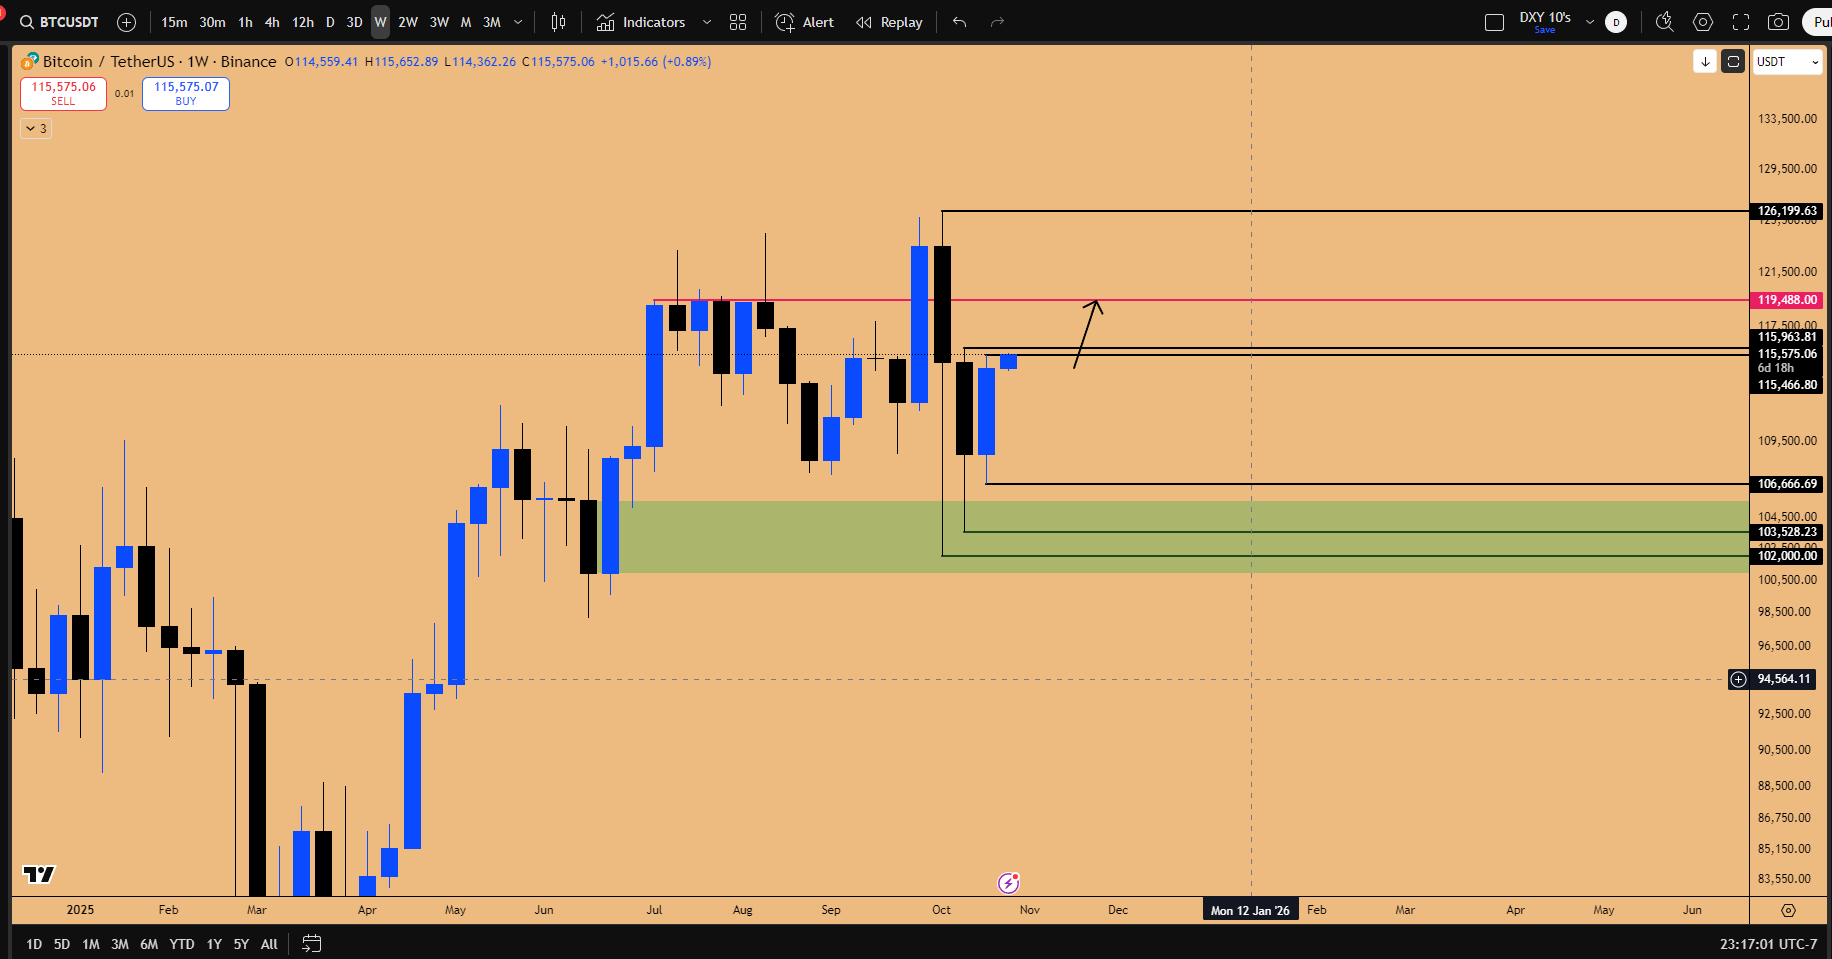
Figure 2: Double Inside weekly candle suggesting breakout to happen in BTC, targeting 120k
⚡ Macro Catalysts: VIX Dynamics and the Liquidity Floodgates
The outlook for the remainder of the quarter hinges on the behavior of the VIX (Volatility Index) and an impending surge of liquidity driven by corporate actions and Federal Reserve policy shifts. These factors are converging to create the most favorable environment for risk-on assets seen in years, suggesting we are entering a phase where blowoff tops will occur across every risk-on asset class.
The VIX Signal: Deflation and Seasonal Tendencies
The VIX was the primary indicator solidifying the fact that the low of the quarter is already established. The expectation moving forward is for a proper deflation in the VIX. This is crucial because of the mechanical inverse relationship: if the VIX goes down, risk-on asset classes—NASDAQ, S&P 500, Bitcoin, DAX, and Nikkei—will invariably go up.
This deflation is driven by strong seasonal tendencies. Typically, the start of a new quarter sees an initial spike in the VIX as market participants fear a collapse. However, once earnings season and FOMC events are concluded, the market enters the holiday months (October end, November, December), which historically post very record-breaking returns. This is the phase where the VIX “goes to the gutter.”
As the VIX trends downward, Wall Street hedge funds that bought put protection (which drives VIX higher) are forced to close those positions. This closing action creates a surge in liquidity, propelling risk-on assets higher. This dynamic was evident last week: as the VIX deflated, the NASDAQ executed a brief stop hunt to the downside, testing the quarterly open for support—a key buying opportunity—before bouncing nicely to make new all-time highs.
The Inside Three-Week Failure: The “Darth Vader” Signal
The VIX has printed a highly significant pattern: a proper inside three-week failure. The recently closed three-week candle took out substantial upside liquidity, sweeping the highs of the preceding three candles. This formation, described as a “Darth Vader kind of a candle,” strongly indicates that the next three-week candle will deflate significantly.
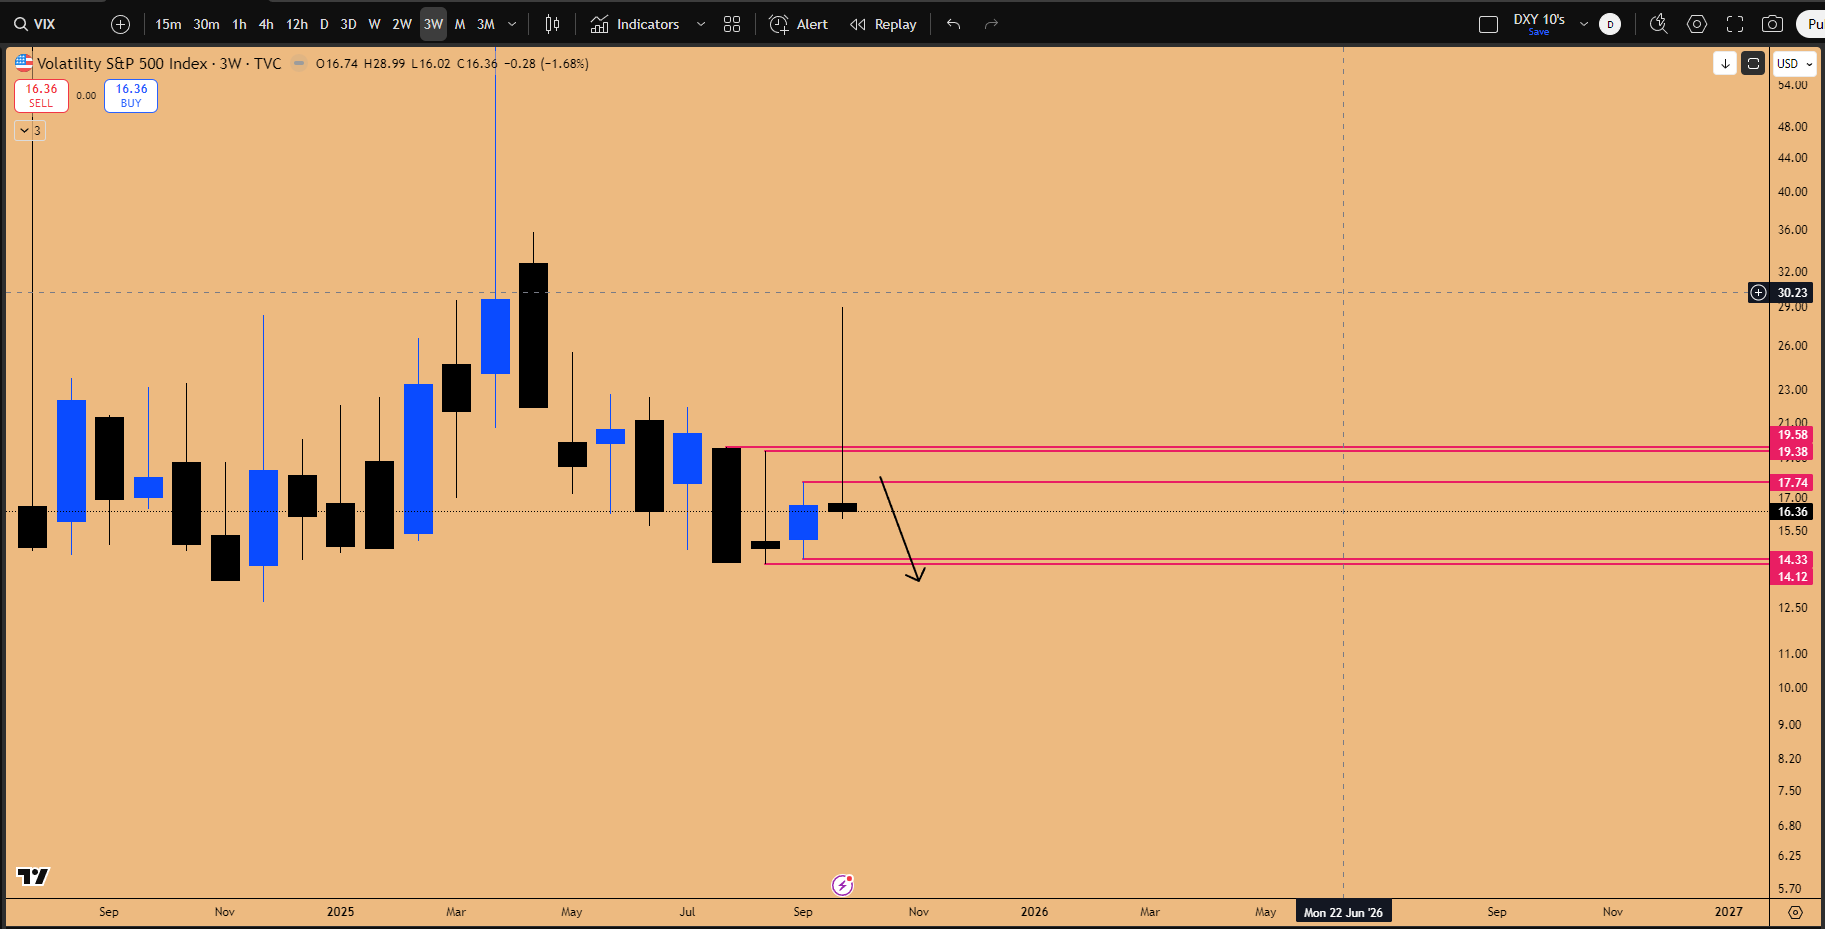
Figure 3: Inside 3-week Candle failure pattern in play for VIX, Major downside incoming
The expectation is for the VIX to move down to 14 and potentially lower. This deflation signals a massive inflow of risk-on appetite for the next three weeks.
Crucially, this VIX signal takes precedence over standalone patterns in other indices. For instance, the S&P 500 recently broke out of an inside weekly candle to the upside. Some traders might question why they shouldn’t wait for the lows to be taken out first. The answer is that the VIX had already topped out and executed its own stop run by taking out highs, forming a weekly swing failure pattern candidate. “VIX coming down is a far higher precedence factor to consider than just a standalone pattern in S&P 500.”
The Power of Stock Buybacks and NASDAQ Weighting
A massive, yet often overlooked, liquidity catalyst is the mechanism of stock buybacks. This occurs when mega-cap companies with excess capital—specifically those with revenues exceeding $40-$50 billion annually, like Microsoft, Apple, Nvidia, Google, Amazon, and Meta—repurchase their own stock.
Apple (AAPL) serves as a prime example. With approximately $394 billion in annual revenue (FY2024), Apple can easily authorize buybacks of $100 billion to $120 billion, which they did in May, 2025, causing the stock to go “berserk.” When this liquidity is pumped by the company itself, the stock price rises regardless of product demand or innovation narratives.
The importance of this mechanism lies in the concentrated weighting of the NASDAQ 100 index. The top 10 companies constitute approximately 60% of the weight of the entire index.
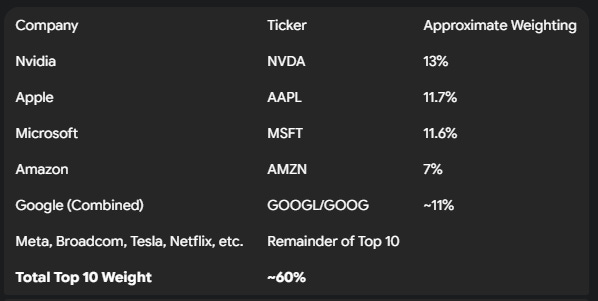
If these top 10 companies execute stock buybacks and their stocks rise by just 10%, the NASDAQ index mathematically must rise by approximately 6% solely due to this activity.
The Blackout Window and the November Surge
Crucially, the stock buyback window is currently closed. Companies undergo a “blackout window” during earnings season, prohibiting buybacks until two days after they report earnings. Currently, 40% of the NASDAQ index including all the major giants are reporting earnings this coming week.
The window is set to reopen in the first week of November. This explains the historical “jolt in performance” in the NASDAQ as November begins. Historical examples show the market bottoming around October 27th and experiencing a sharp U-turn into the year-end, driven by this artificial surge of corporate liquidity.
The End of QT and the Return of QE
Beyond corporate actions, central bank policy is shifting toward accommodation. A significant development is the anticipated end of the US Fed’s Quantitative Tightening (QT) program.
Since May 2022, the Fed has been depleting its balance sheet by allowing the runoff of mortgage-backed securities (currently $40 billion a month), actively pulling liquidity out of the system. This mechanism is expected to end. The cessation of QT opens the doors for future Quantitative Easing (QE) programs the process of injecting liquidity, similar to the floodgates opened during the March 2020 COVID-19 pandemic.
“If Powell announces that the quantitative tightening is going to come to an end, markets are going to go really berserk. You have not seen speculation yet until he announces that.”
Even a gradual reduction of the runoff arrests the decline of the balance sheet and removes sell pressure. When combined with the stock buyback window opening and anticipated rate cuts (another 25 basis point cut is expected), the environment becomes overwhelmingly liquidity-positive. This “cocktail” of liquidity factors hasn’t been seen in the past seven to eight years, and the only way to ride it is to be long on risk assets.
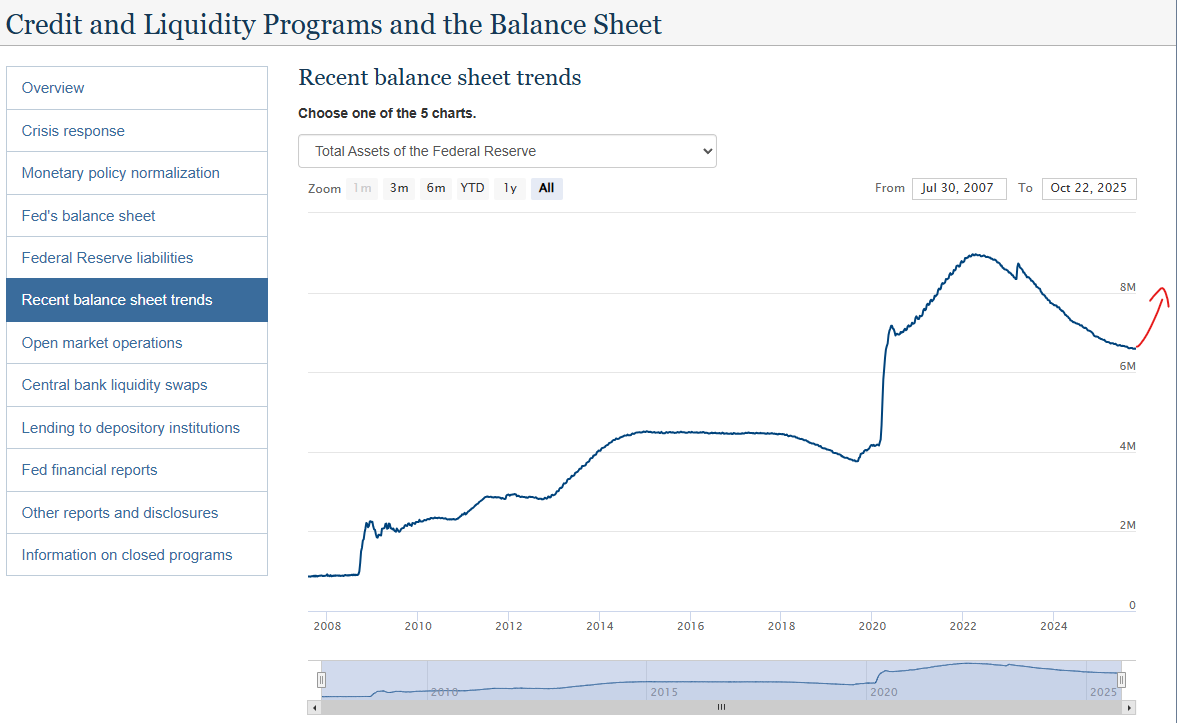
Figure 4: US FED BALANCE SHEET TREND SET TO REVERSE
Cross-Market Correlations: The Nikkei’s Lead and US Equity Catch-Up
Cross-market correlation provides crucial insights into the potential trajectory of lagging asset classes by observing those that have already advanced excessively. The relationship between the Japanese Nikkei index and US equities is particularly telling, suggesting US markets have significant room to run.
The Nikkei Acceleration: A Preview for US Markets
The impact of the massive liquidity influx is already visible in assets like the Nikkei. The Nikkei is exhibiting an accelerating rate of return, where each monthly candle is larger than the previous one. This is the hallmark of a blowoff top phase.
The divergence in performance this quarter between the Nikkei and US equities is stark and highlights the opportunity:
From the current quarterly low, the Nikkei is up 27%.
From the current quarterly low, NAS100 is up only 4.5%.
This comparison strongly refutes the idea that US equities are overextended. The Nikkei is overextended; US equities are merely consolidating and preparing for an extension that will start to resemble the Nikkei’s current trajectory. There is more money to be made on the US equity side.
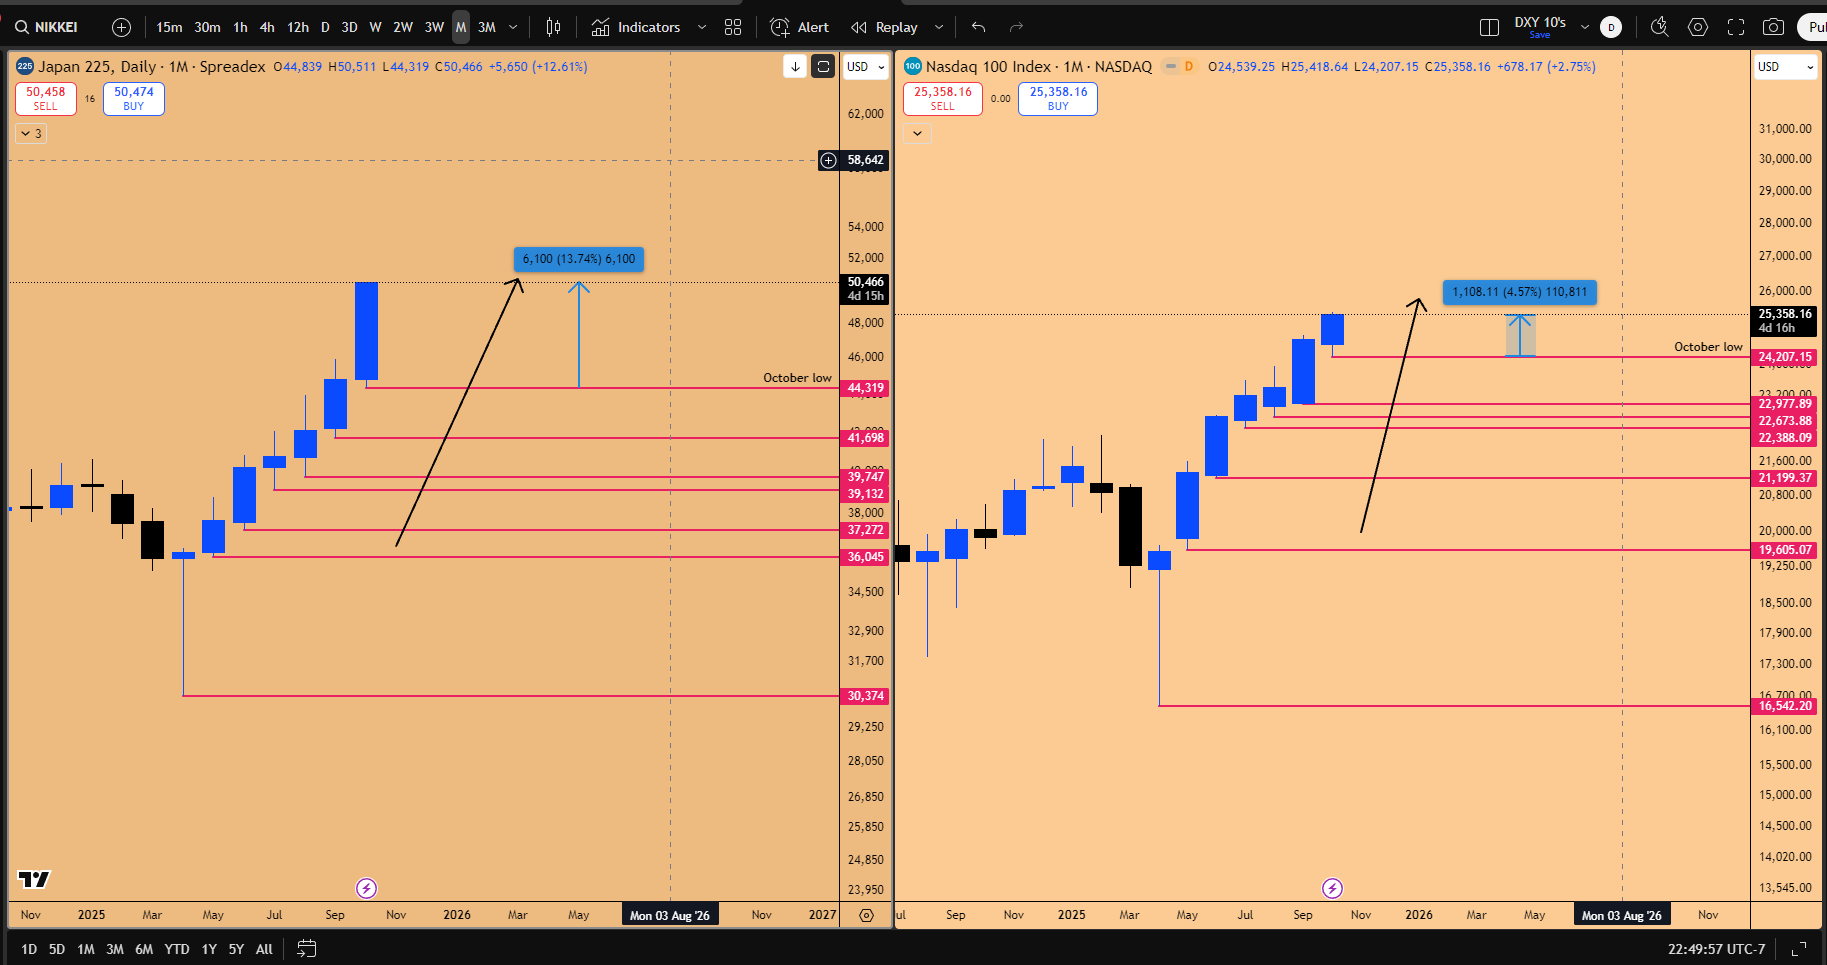
Figure 5: Nikkei 225 VS NAS100, massive catch up trade opportunity in NAS100

⭐ The Mag 7 Earnings Catalyst: Setups in Focus
With the understanding that NASDAQ is poised for expansion due to seasonality and buybacks, the strategy shifts to identifying the heavily weighted constituents presenting the most lucrative setups heading into earnings week. The NASDAQ itself remains structurally bullish, with none of the three-week candle lows being violated; until this occurs, there is no reason to exit long positions.
💻 Microsoft (MSFT): The Coiled Spring and Inside Three-Week Failure
Microsoft, a top-three component of the NASDAQ, is the primary long position we have in our portfolio since September 5th, 2025 due to a high-probability pattern: the inside three-week failure.
This pattern has been unfolding slowly, causing anxiety due to the lack of velocity. However, the structure remains perfectly intact, targeting the upside liquidity grab at the $555 mark.
The price action is extremely coiled up and awaiting a catalyst for an explosive move. Earnings event will be a strong trigger for Microsoft to start rallying going into November-December year end rally
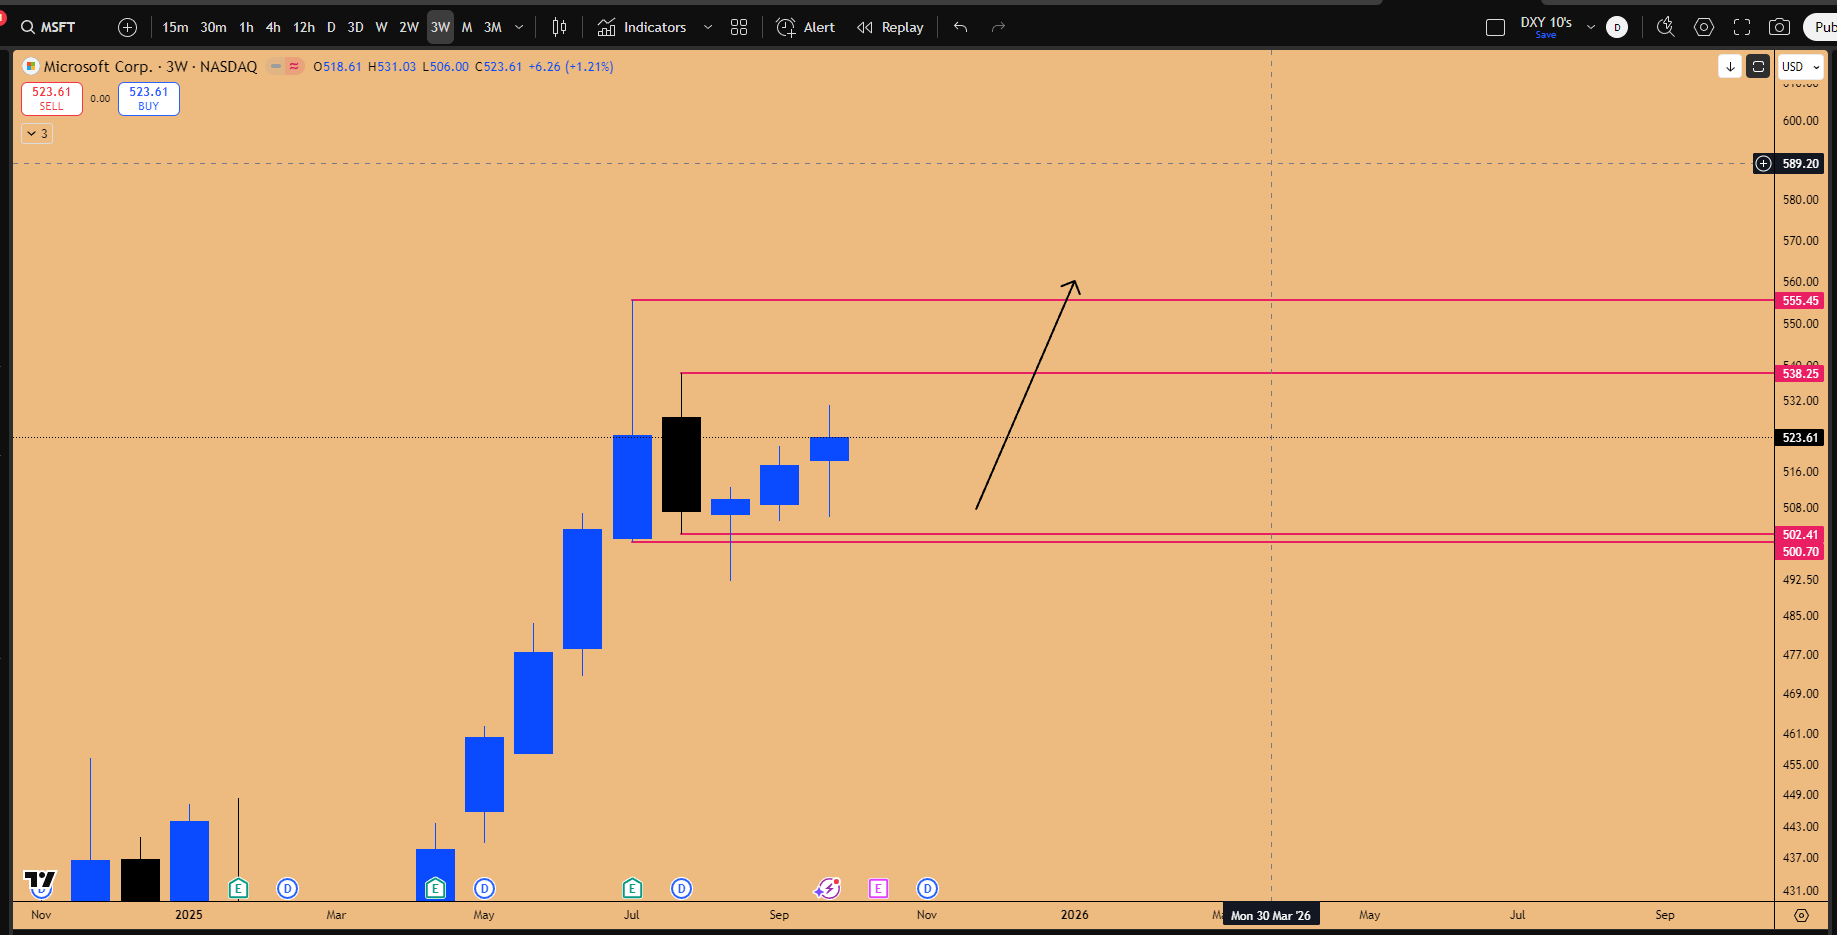
Figure 6: Inside 3-week Candle Failure pattern in play for MSFT, targeting $555
🌐 Meta (META): The Undervalued Catch-Up Play
Meta (META) and Amazon (AMZN) are identified as the most undervalued companies in the Mag 7, presenting significant catch-up opportunities.
Meta has been moving sideways while NASDAQ rallied. A comparison to the February 2025 highs reveals the extent of the lag:
QQQ (NASDAQ ETF): Trading 14% above the February 2025 high.
META: Sitting right at the February 2025 high.
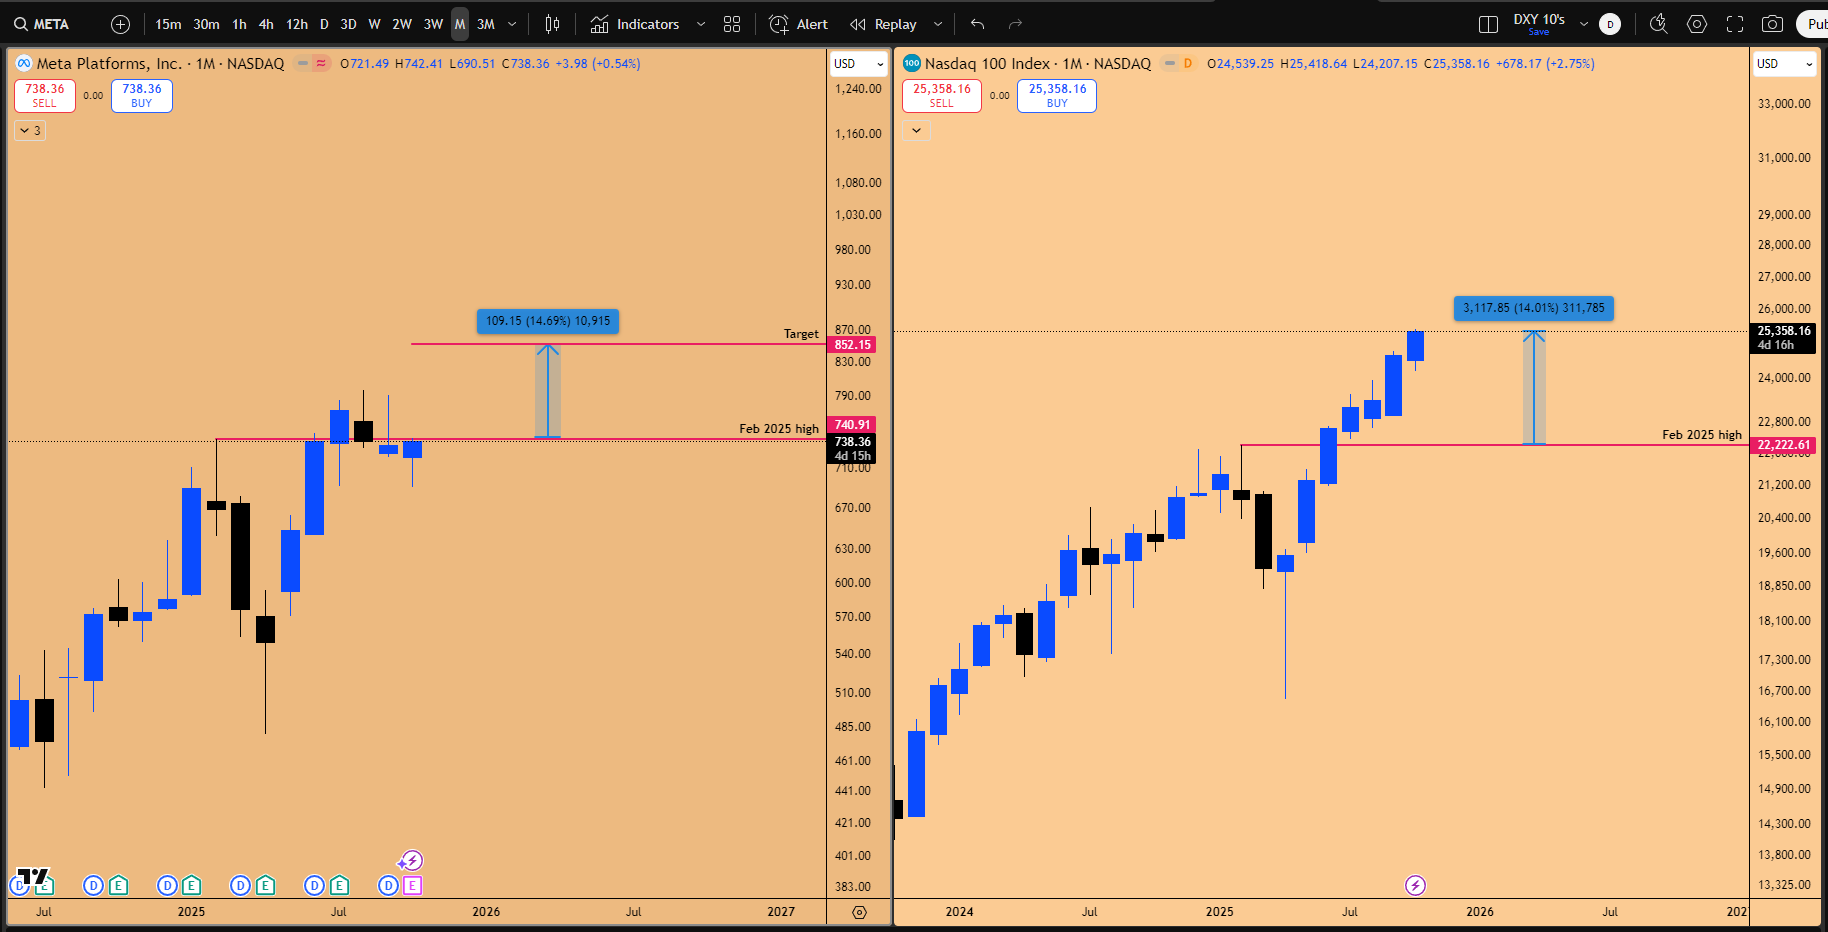
Figure 7: META catch up trade
This divergence is temporary. Meta historically outperforms NASDAQ significantly. Since the 2022 bottom, NASDAQ returned 143%, while META returned a staggering 740%.
The recent pullback in META was highly controlled and technical, perfectly filling the previous earnings gap (inefficiency). Having filled this gap, Meta has no technical reason to move lower and is now breaking out from a bottoming formation. The chart shows a proper reclaim of the range low above 731, suggesting the upside liquidity is vulnerable with no resistance overhead.
High-Conviction Options Play: Targeting 300% on META
For traders looking to capitalize on this catch-up move, an options strategy offers an exceptional risk-reward ratio, focusing on buying time and positioning for the historically strong January expansion phase (January quarters often see major expansions, e.g., Jan 2023, Jan 2024).
The Setup:
Asset: Meta (META)
Strategy: Buy far out-of-the-money call options.
Expiration: April 2026 (positioning for the Jan-April expansion).
Strike: 850 Calls.
Current Price: Trading at 35.5 ($3500 USD per contract).
Thesis: If NASDAQ moves up 10%, META is expected to move up a minimum of 30% due to its historical outperformance and AI investments, potentially reaching $966.
Potential Return: The option contract could move from $35 to roughly $100 per contract, yielding approximately a 300% return over the next five to six months.
📦 Amazon (AMZN): The AI Robot Revolution and $300 Target
Amazon is considered the single most undervalued company in the top 20 NASDAQ constituents, poised to outperform the Mag 7 by a large margin going into 2026.
Fundamentally, Amazon is witnessing accelerating revenue growth and is uniquely positioned as an AI company. Their plans to transition fulfillment centers from human workers to AI robots in the next 3-7 years will significantly increase profit margins and productivity (robots working 24/7), while also boosting Amazon Web Services (AWS) revenue due to heavy data usage requirements.
Technically, Amazon has also lagged NASDAQ, going sideways (down 6%) for the past four months while the index moved higher. This presents a clear catch-up trade targeting $264, $292, and ultimately $300 in the next three to four months.
Amazon just posted a weekly bullish order block at a massive Support/Resistance level corresponding to the yearly open (January 2025). This is an area of high interest that must be defended. The stop loss can be moved to $211 (up from $207), as this structure is expected to hold as the next major higher low.
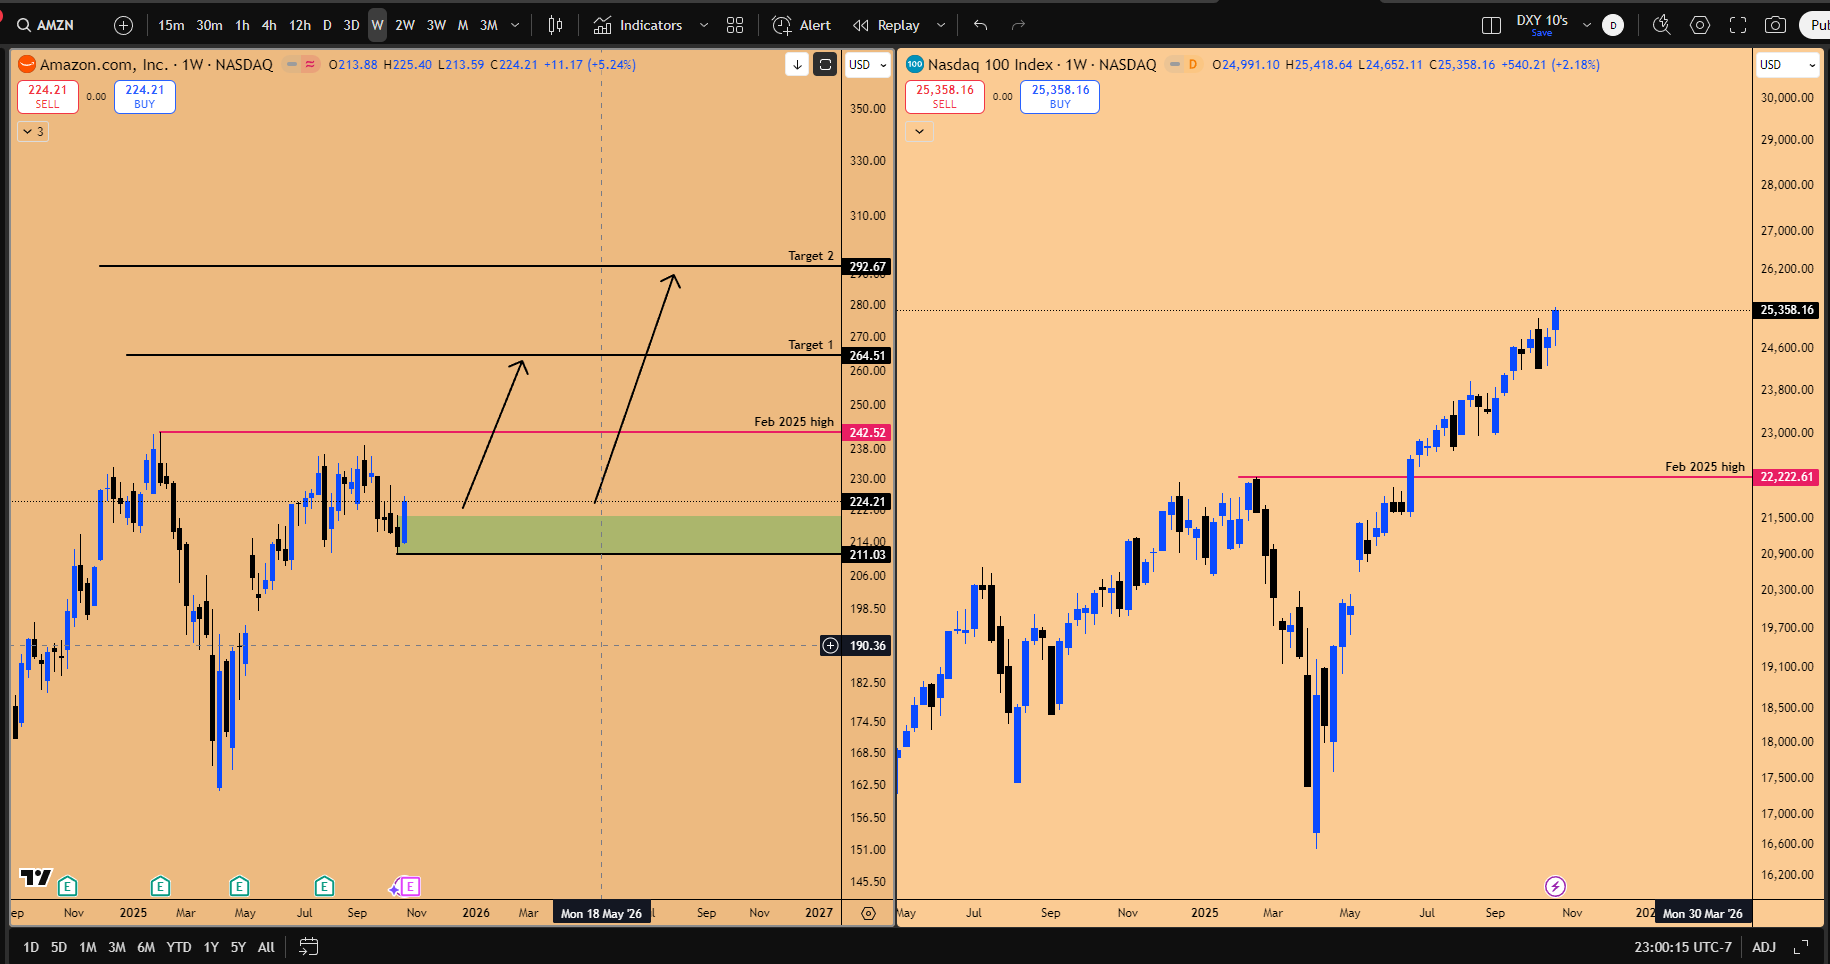
Figure 8: Catch up trade for AMZN
🔍 Google (GOOGL) and Nvidia (NVDA) Outlook
Google (GOOGL) is currently the best performer, exhibiting blowoff top characteristics. It has established strong support and is expected to continue expanding, targeting $280-$300 by Q1 2026 (February or March), driven by future Capex and the anticipation of Gemini 3.0.
Nvidia (NVDA) is currently going sideways, which is not bearish. It appears to be forming an ascending triangle, targeting the upper trend line at $200. If NVDA moves higher, NASDAQ will follow.
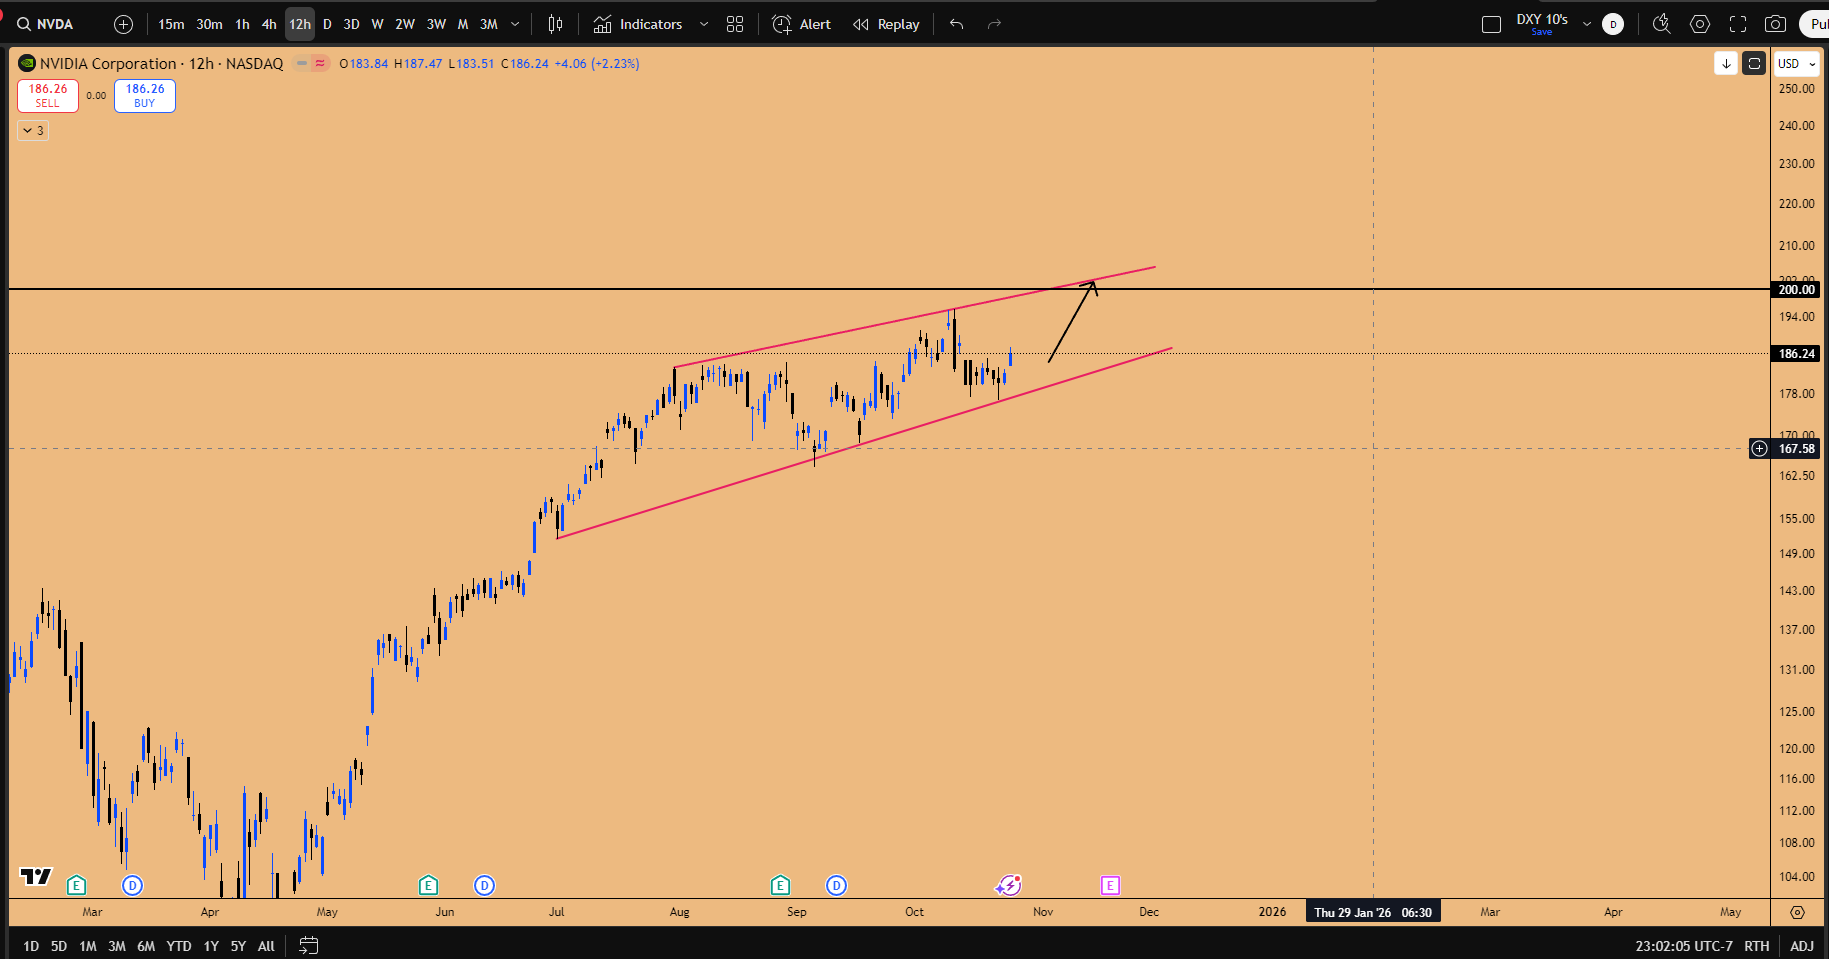
Figure 9: Rising channel formation in NVDA
✨ Gold’s Parabolic Run: RSI Analysis and Invalidation Logic
Gold (XAU) has undergone a significant parabolic breakout, characterized by accelerating weekly candles and a blowoff top dynamic, demonstrating the slush liquidity in the system. The previous breakout outperformed expectations, delivering a 30% return versus the expected 18-20%. The key takeaway when analyzing such parabolic movements is: “Never ever be the first one to call the top.”
Quarterly RSI and Historical Bubble Territory
The expansion in gold has been happening since the October 2023 bottom, with every subsequent quarter maintaining the structure by not breaching the previous quarter’s low. The primary tool for analyzing the extent of this bubble is the Quarterly RSI.
The Quarterly RSI is currently trading at 88.
Historical analysis of past bubbles (dating back to 1932) shows that the Quarterly RSI has a tendency to expand to 94-96 before a top is formed.
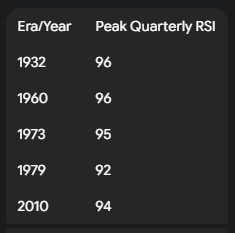
Based on this precedence, the top is likely not in for gold. Bubbles can keep inflating long after reaching overbought levels. In the 2010 example, Gold touched 92 RSI at $1300 and then rallied another 47% before topping out.
The Invalidation Logic: When is the Top Actually In?
To determine when the parabolic move is concluded, we rely on a specific structural invalidation: the top is only confirmed when Gold takes out the PREVIOUS QUARTERS LOW (three-month candle low).
Historically, the topping process takes significant time. Even when this first warning sign occurs, the market often experiences a counter-trend bounce and forms a lower high before a proper deflation happens, where one quarterly candle can obliterate a year’s worth of uptrend.
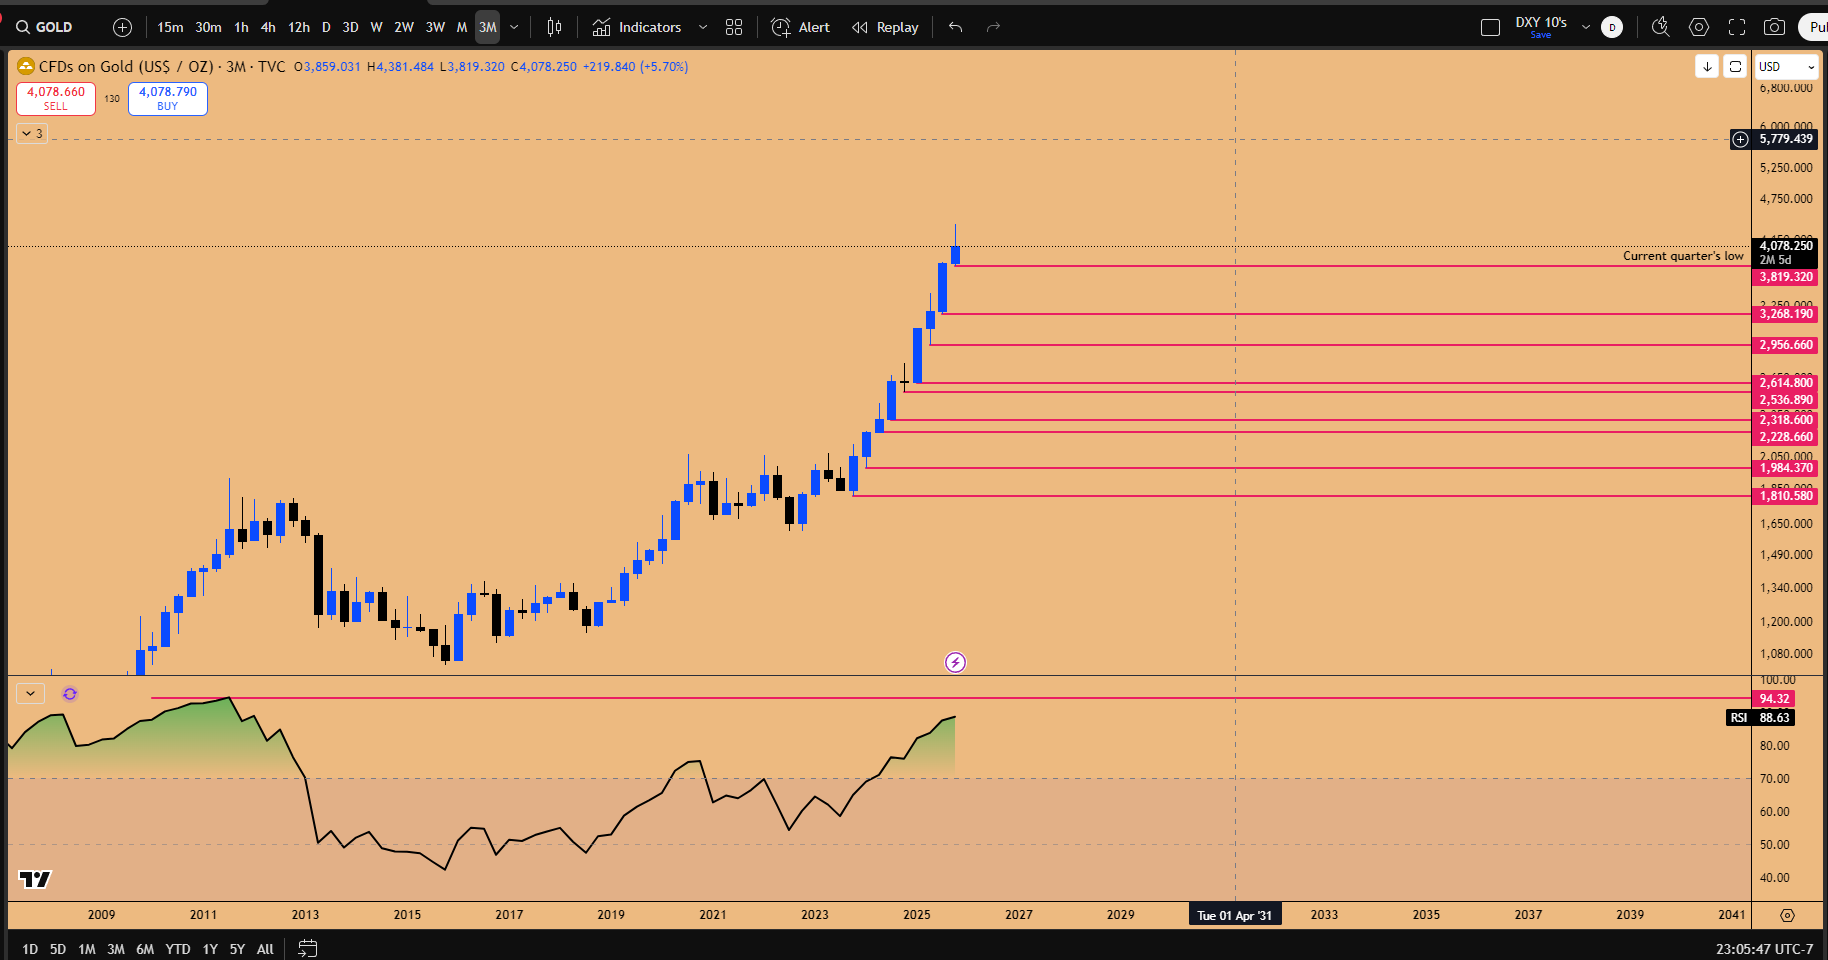
Figure 10: Gold’s Parabola on 3-month time frame
Actionable Setup: Longing the Weekly Pullback
Gold had printed nine consecutive bullish weekly candles. A pullback was expected and should be treated as a gift. The current weekly candle is an inside weekly candle pullback, not a topping pattern. If the current monthly candle closes solidly, the low (referenced as 3819) will be the line in the sand for the bull bias.
The Trade Setup:
Trigger: Look for Gold to take out the equal lows on the weekly chart.
Entry: If it takes out the lows and forms a Daily SFP (Swing Failure Pattern), this is the long trigger.
Target: All-time highs (around 4381).
Timeframe: This is an intraday swing trade, potentially taking one to three weeks to reach the target.
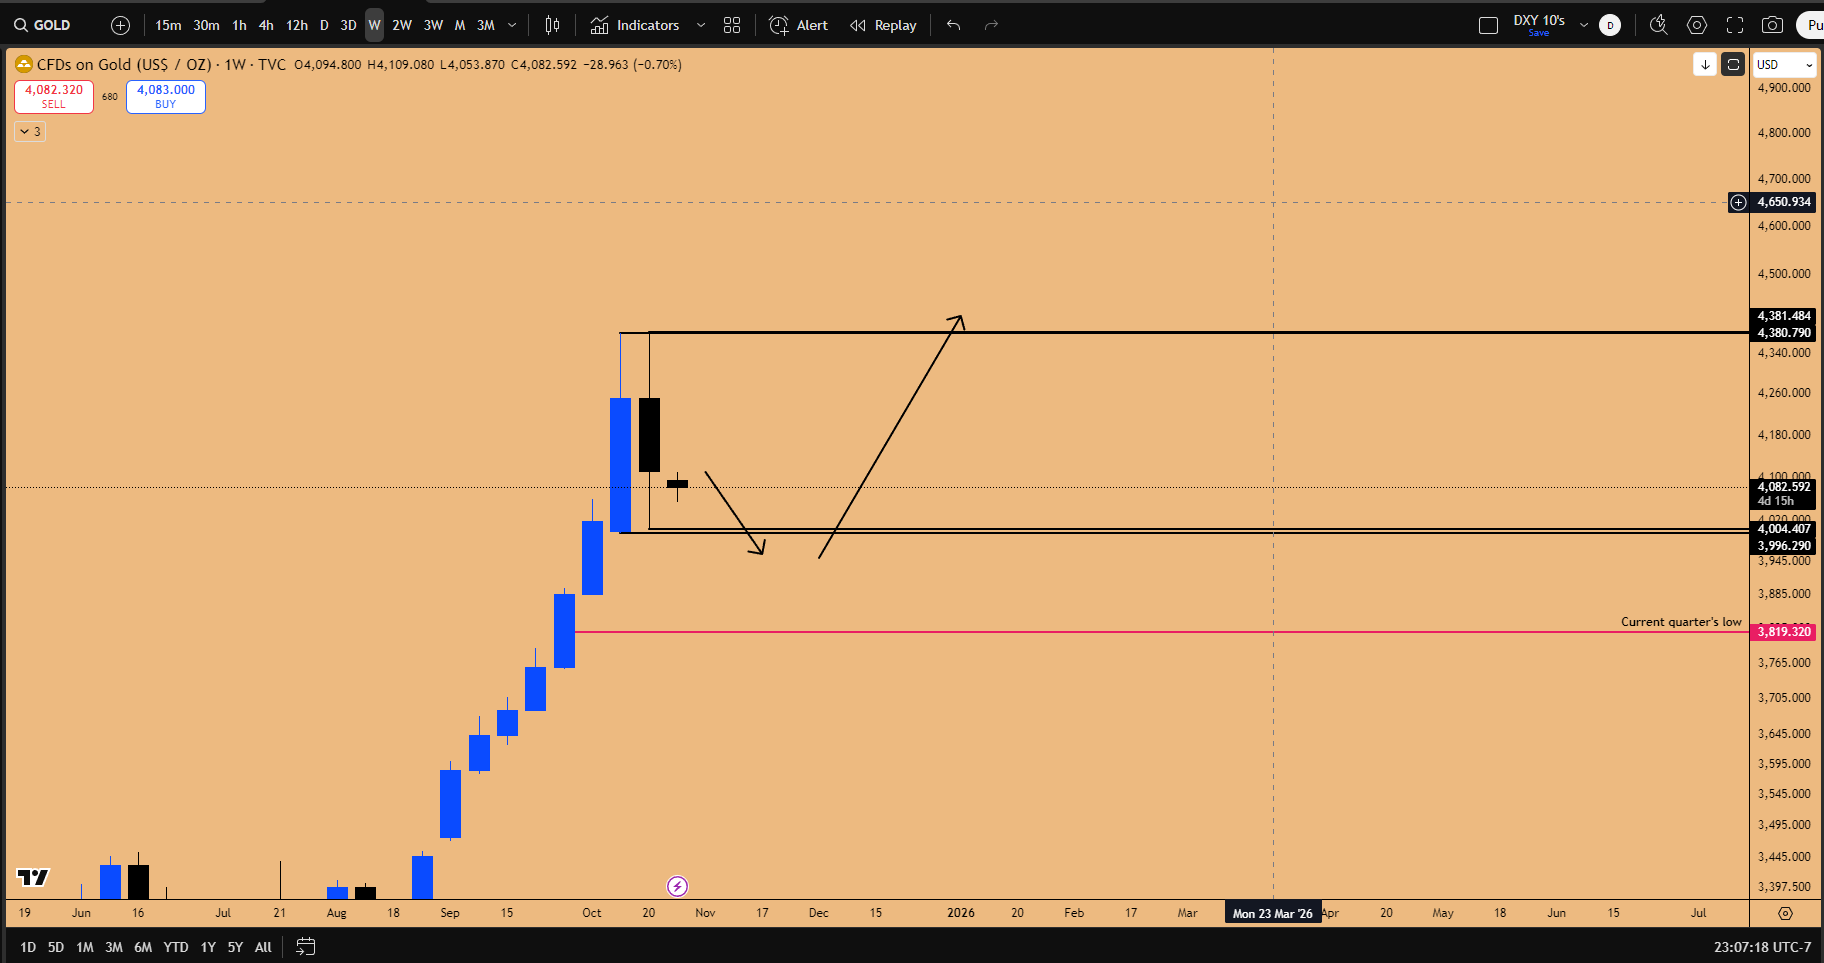
Figure 11: Gold’s trade setup in play, Inside weekly Candle pattern
Comparatively, Silver (XAG) is less attractive. Silver printed a bearish engulfing candle rather than an inside weekly pullback, suggesting it may go sideways while Gold expands. Focus remains on Gold due to the clearer pattern.
💜 Crypto Deep Dive: Ethereum, Altcoins, and Viewer Q&A
While Bitcoin remains the focus for capital preservation and outsized gains, opportunities exist in Ethereum and select altcoins, though caution regarding liquidity and rotation risks is paramount.
Ethereum (ETH): Monthly Patterns and the CME Futures Setup
Ethereum (ETH/USD) is expected to spend the current month moving sideways to confirm the inside monthly candle failure pattern. Confirmation (in the next five days) is needed before adding to existing positions (currently a 5% spot portfolio allocation).
The CME Futures Setup
The Ethereum CME futures chart provides a clearer actionable setup based on an untested support zone (bullish order block) and an inside weekly candle suggesting a potential run on the lows to capture a new long position.
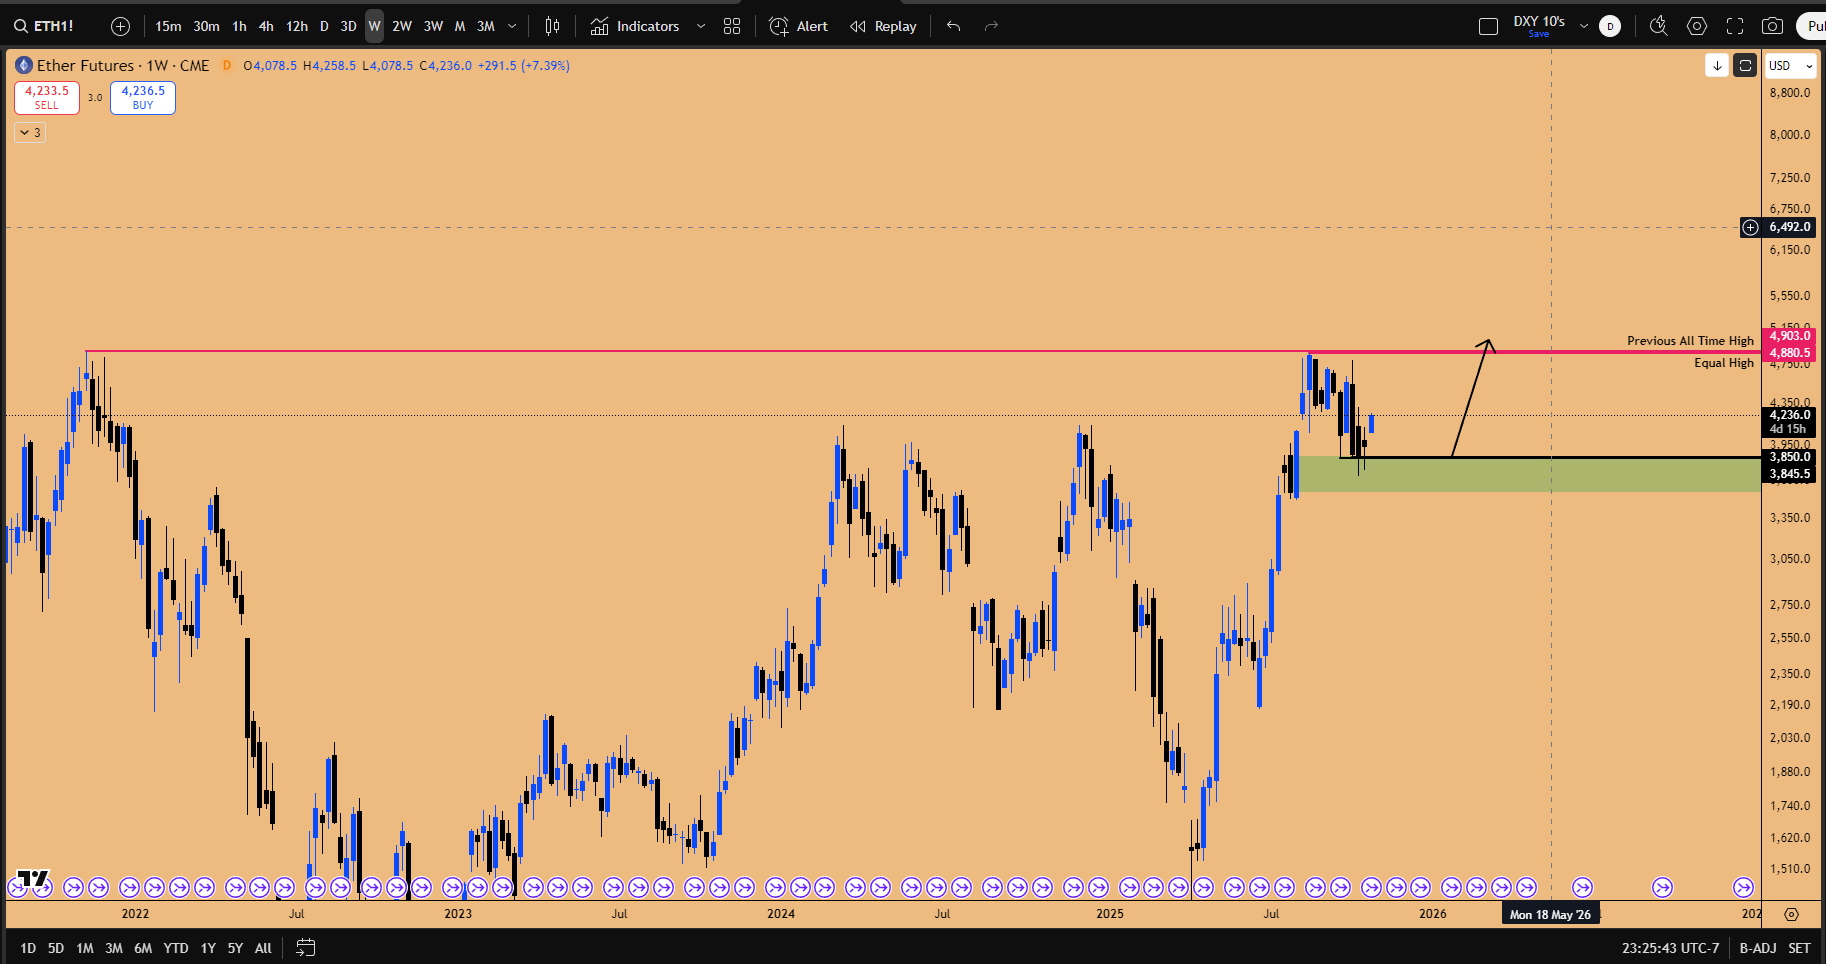
Figure 12: ETHUSD long setup to tag New All Time Highs
The thesis remains that Ethereum will make an all-time high, as the CME futures have not yet run the equal highs near 4900.
For ETH/BTC, the pair is holding the key support zone, waiting for the monthly candle to close as a failure, anticipating upside expansion next month.
Hype/USD and Altcoin Risks
Hype/USD is garnering attention as potentially the “next FTX token.” As retail craves new platforms for speculation, Hype could see increased activity. The chart structure reminisces the early consolidation phase of the FTX token (FTT) before its massive expansion. Proper expansion is likely to happen in the next quarter (January).
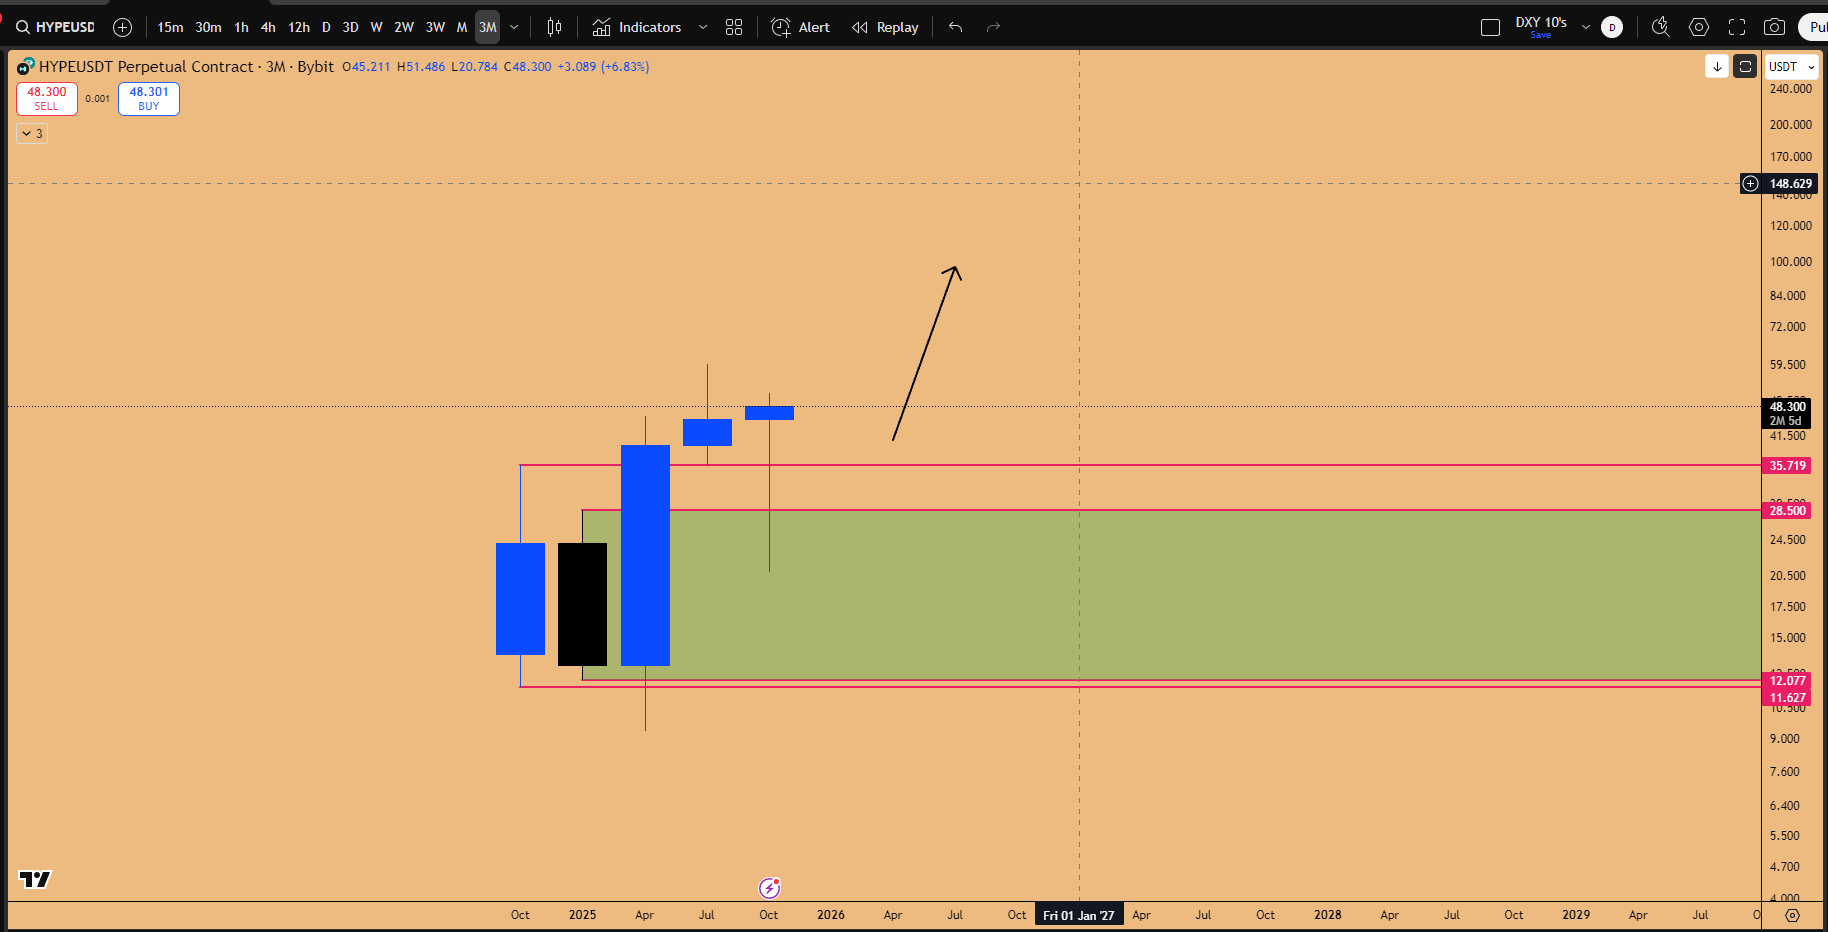
Figure 13: HYPEUSD upcoming expansion
Altcoin Philosophy and Risks:
The preference remains heavily skewed toward majors (Bitcoin, Ethereum, Solana) due to capital preservation concerns. Altcoins, especially meme coins like Fartcoin, carry significant risks, as demonstrated by 90% drawdowns when liquidity is pulled. These assets often undergo massive pumps (e.g., 120x), but capitalizing requires selling the top before the inevitable crash, as seen with WIF. Altcoin phases are brief (one month out of twelve), and timing these rotations is difficult.
Equity Opportunities and Risk Management (Q&A)
Beyond the Mag 7, several individual stocks present unique setups or require careful risk management based on recent price action and upcoming catalysts discussed during the Q&A.
Alibaba (BABA) and the China Trade Deal
Alibaba (BABA) presents a potential long opportunity on a pullback.
Setup: There is an open gap at $156/$157. The strategy is to wait for the market to take out these lows and fill the gap, which would serve as the long trigger. Earnings are on November 13th.
Fundamentals: Alibaba is knee-deep in the AI revolution in China, pioneering models competitive with ChatGPT and Gemini. News over the weekend suggested a potential US-China trade deal might be happening, which would be a significant tailwind.
Technicals: The quarterly chart shows massive support (bullish order block) and suggests a macro higher low is in place. The long-term target remains the all-time high at 317.
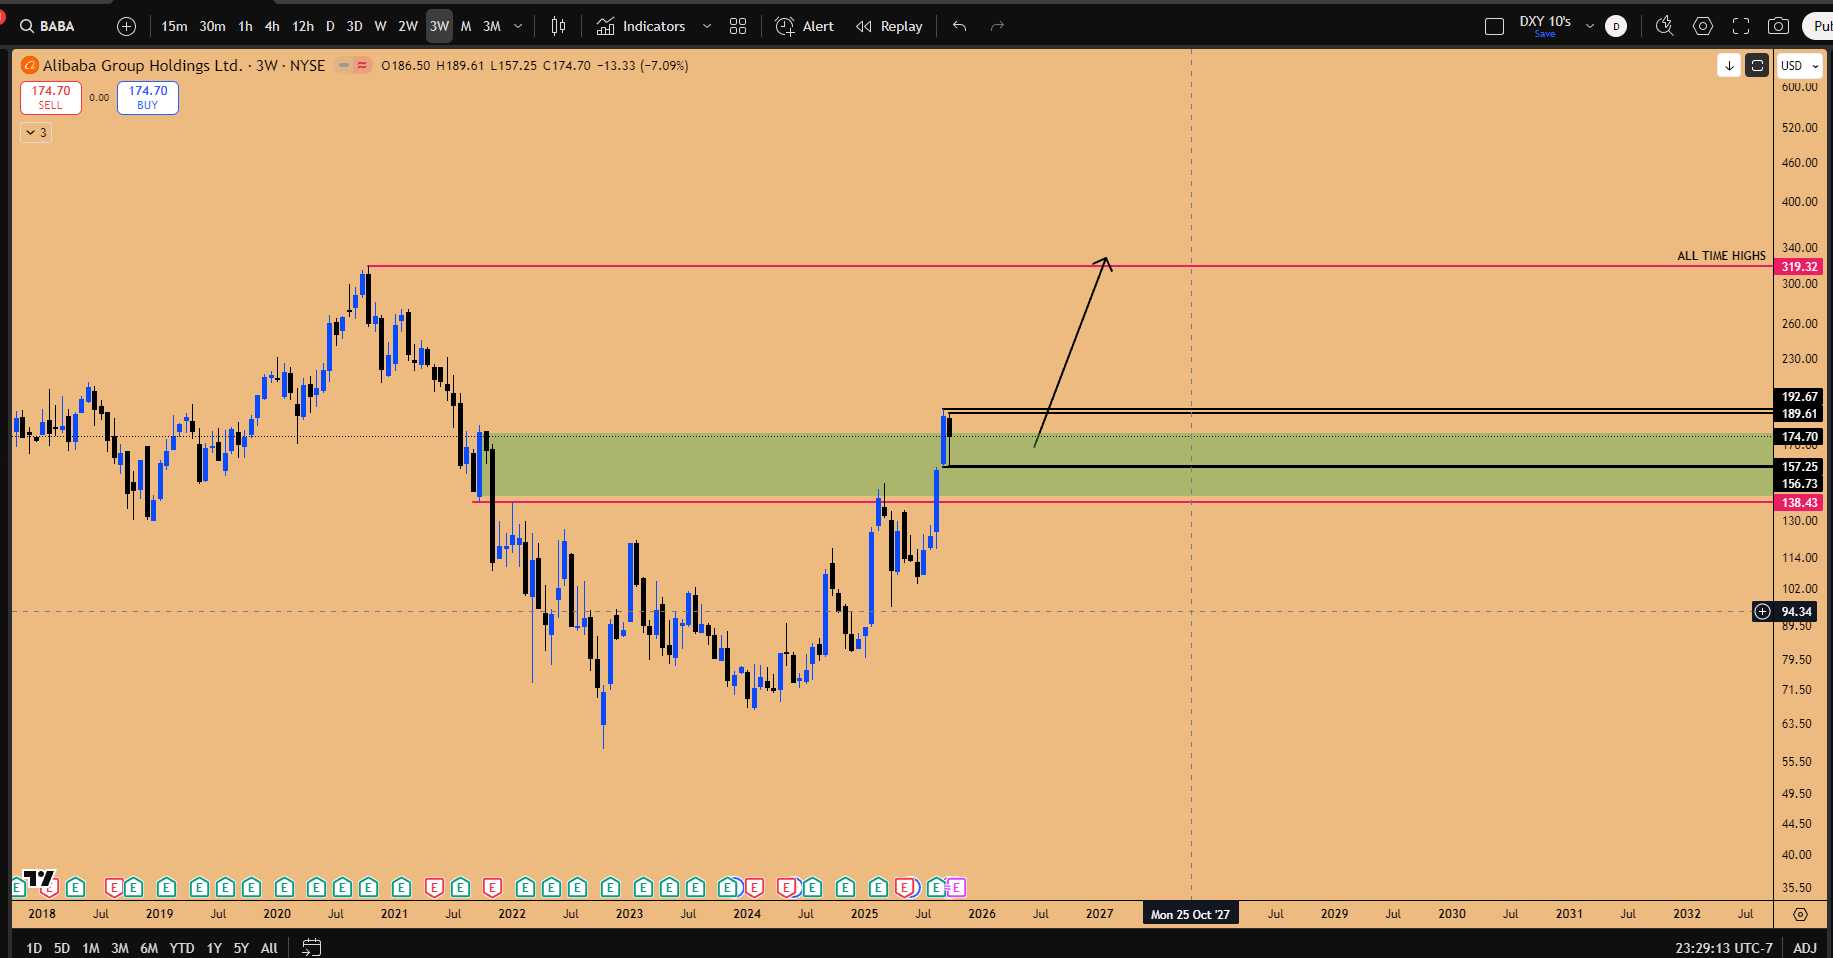
Figure 14: BABA Swing long trade setup
Tesla (TSLA) vs. Russell 2000 (RTY)
Tesla (TSLA) presents an inside three-week candle pattern ahead of a significant catalyst: the November 6th shareholder vote on investing in xAI. The vote is expected to pass, confirming Tesla’s position as a leading AI company (Agent AI).
On a longer-term perspective, Tesla is forming a massive ascending triangle pattern over the past 4-5 years. This consolidation is expected to break out massively going into 2026. Interestingly, Tesla’s chart pattern mirrors the Russell 2000 (RTY) index breakout. However, the recommendation is strongly to long Tesla over Russell, as Tesla has real revenue and innovation, positioning it to become a $10-20 trillion company, whereas Russell comprises many profitless companies. “If you wanted to long Russell, I would recommend that you long Tesla instead.”
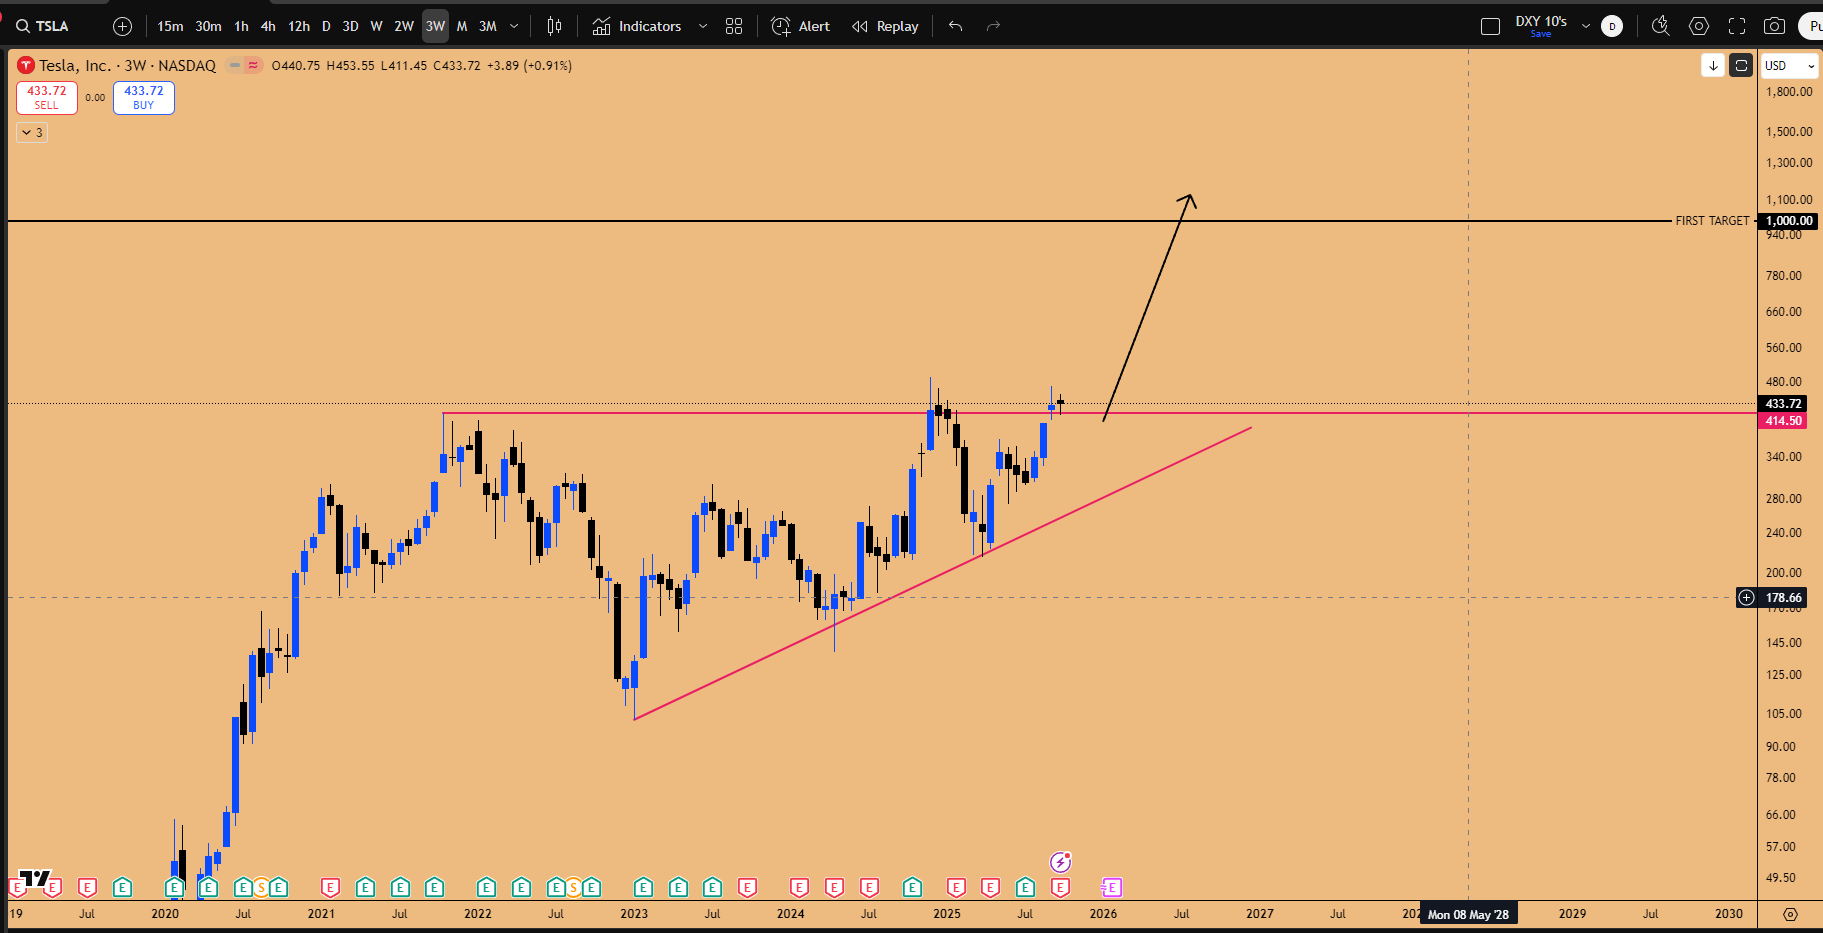
Figure 15: Macro Ascending Triangle in formation for TSLA
Other Notable Mentions
Oracle (ORCL): Showing an inside three-week candle failure. It is currently pulling back to fill a gap and test the open support zone around $250. This is a potential long entry. ORCL and MSFT (both software companies) are expected to move up in unison, providing 10-15% returns into year-end.
Costco (COST): Likely forming an inside six-month candle. Wait until the January candle opens; do not touch for the next two months.
JPMorgan (JPM): Took out the previous month’s low. Likely undergoing an inside three-month candle formation. Wait for a run on the lows before entertaining long positions in the next quarter.
📌 Key Takeaways and Outlook
The current market environment presents a rare and potent confluence of bullish catalysts, signaling a high probability of market meltups and blowoff tops heading into the year-end. The analysis across VIX, macroeconomic liquidity, cross-market correlations, and individual asset structures points overwhelmingly toward expansion.
Key Insights Reiterated:
The VIX Signal: The inside three-week failure on the VIX is the primary green light, indicating significant deflation and a massive surge in risk-on appetite over the coming weeks.
The Liquidity Cocktail: We are facing an unprecedented level of liquidity injection driven by the reopening of the stock buyback window in November, the end of Quantitative Tightening (QT), and impending rate cuts.
The Catch-Up Trade: US equities are significantly lagging the Nikkei (up 27% this quarter). Microsoft, Meta, and Amazon are the prime candidates to play catch-up, offering exceptional risk-reward setups, including options plays on META targeting 300% returns.
Gold’s Parabola: Despite being overbought (88 Quarterly RSI), historical precedents (94-96 RSI peaks) suggest Gold’s run is not over.
Bitcoin’s Trajectory: While consolidating, Bitcoin remains the levered bet on NASDAQ. Institutional rebalancing and favorable policy shifts underpin a hyper-bullish long-term outlook, with an immediate target of $120K.
Outlook:
We maintain a hyper-bullish bias going into the year-end. November is historically a bullish month 100% of the time, and there is no technical basis for calling a top in the market. The focus must be on positioning in the names poised to run, leveraging the insights from the quarterly outlook which is playing out exactly as anticipated. As we head into earnings week and the November liquidity surge, ensure your portfolio is aligned to capture the expected expansion.
If you’re finding value in our research, we’d like to extend a personal invitation to explore the next level of market analysis within our Speculators Trading community. Our Discord server is a collaborative space dedicated to helping traders optimize capital allocation. Inside, you’ll gain access to our real-time Trading-floor commentary, high-conviction technical setups, proprietary educational resources, and strategic bi-weekly livestreams. We invite you to experience these premium resources firsthand and see how they can enhance your portfolio management. Join us for our weekly livestreams and wednesday macro webinars using Webinar Pass for 39.99 USD/month. If you would like to receive full access to our discord community and timely market updates in the world of finance where information flows at warp speed, Monthly Pass access (99 USD/Month) is the best bang for the buck.
What’s your take on these setups? Are you positioned for the November buyback surge? Share in the comments—let’s discuss strategies. Subscribe for more market breakdowns!
Disclaimer: This isn’t financial advice – just market musings from the charts. Always do your own research.
If you enjoyed this deep dive, please share it with fellow traders!
Brilliant. Makes sense like a best plot twist.