

What's in store for US Dollar in H2?


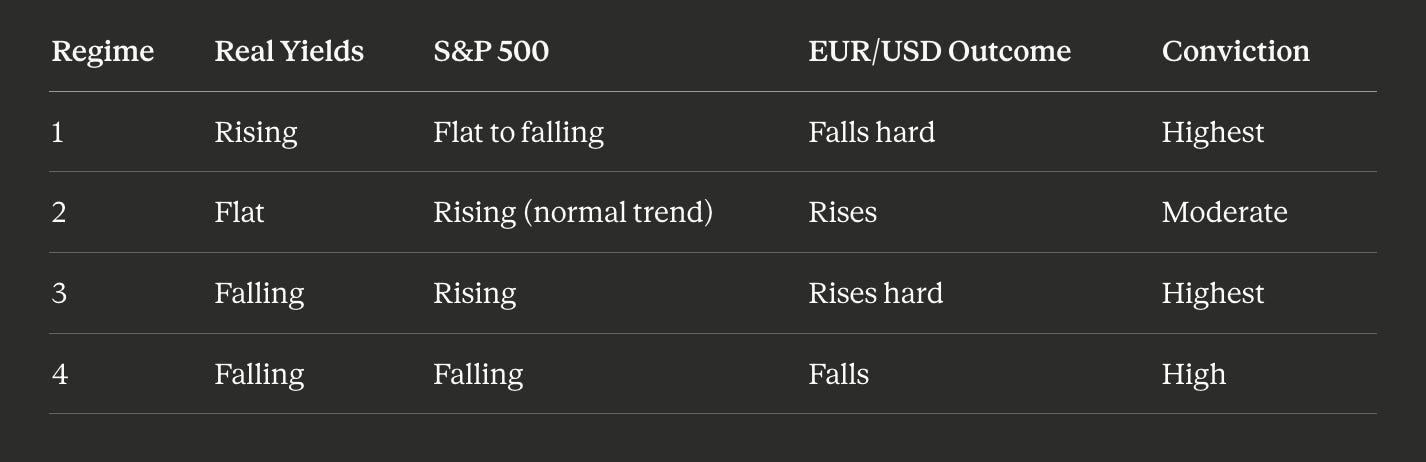
The Four Market Regimes
US dollar has been under heavy selling by China and Japan, even FED has pumped over $250bn into short term bills. Yet EURUSD which makes up 57% of the dollar basket has gone nowhere since June 2025!

This lul has made market complacent and has always led to multi month expansions in the past. Prior to these expansions an orchastrated dual between Real Yields (bond yields - inflation expecations) and S&P 500 has created 4 distinctive regimes.
Regime | Real Yields | S&P 500 Direction | EUR/USD Bias
--------------------------------------------------------
1      | Climbing ↗  | Stalling/Falling ↘| Bearish 📉
2      | Climbing ↗  | Pushing Higher ↗  | Choppy ↔
3      | Falling ↘   | Pushing Higher ↗  | Bullish 📈
4      | Falling ↘   | Rolling Over ↘    | Safe Assets
The logic here is that the dollar’s path is not decided by stocks alone, or yields alone. It is decided by how they react to one another. When real yields rise and stocks fall, capital leaves global markets and rushes into the greenback.
Right now, we are stuck in Regime 2. US real yields are climbing, but the S&P 500 has managed to claw its way back toward highs. This creates conflicting vectors. The yields want the Euro lower; the stock market momentum keeps risk afloat.
To break out of this sideways grind, we need a clean shift into Regime 1 or Regime 4. Either real yields keep climbing while equities roll over, or both yields and stocks drop together. Both paths lead to a lower Euro. We are waiting for one of the two sequences to kick off what can only be described as one of the biggest fundamental miss matches between price and EURUSD’s fair value (which you will see shotly is much lower).
The Three-Layer Grid
To understand the dollar, you have to look at what drives it. We track global capital flows by stacking three specific charts on top of each other:
[ Layer 1: US 10-Year Real Yields ]
                │ (Where the smart money goes for return)
                ▼
[ Layer 2: S&P 500 Index ]
                │ (The baseline for global risk appetite)
                ▼
[ Layer 3: EUR/USD Spot Pricing ]
What looks like stubborn resilience in the euro today is the compression phase of a spring being wound ever tighter. The longer the fundamentals diverge from the price, the more violent the eventual release. But we are not there yet.
Next we examine the US-Germany yield spread and the synthetic rate differential model that has genuine predictive power. But before we look at that here are the regimes as a snapshot bookmark this, you will need this in the future again:
The Four Regimes
The genius of the framework is that it collapses into four repeatable regimes. Each one tells you, with historical consistency, where EUR/USD is headed.
The regimes have long lasting mid to long term effects. The following drivers have strong feedback loops into the currency complex lasting from weeks to months.
Yield Spreads: The Dollar’s Fundamental Engine
The spread between US and German yields has been climbing steadily in favor of the United States, and when you overlay it against the dollar, the major swings line up almost surgically. The logic is this: as the yield advantage tilts toward the dollar, capital follows, and the dollar climbs with it (often times used as a fair value model)
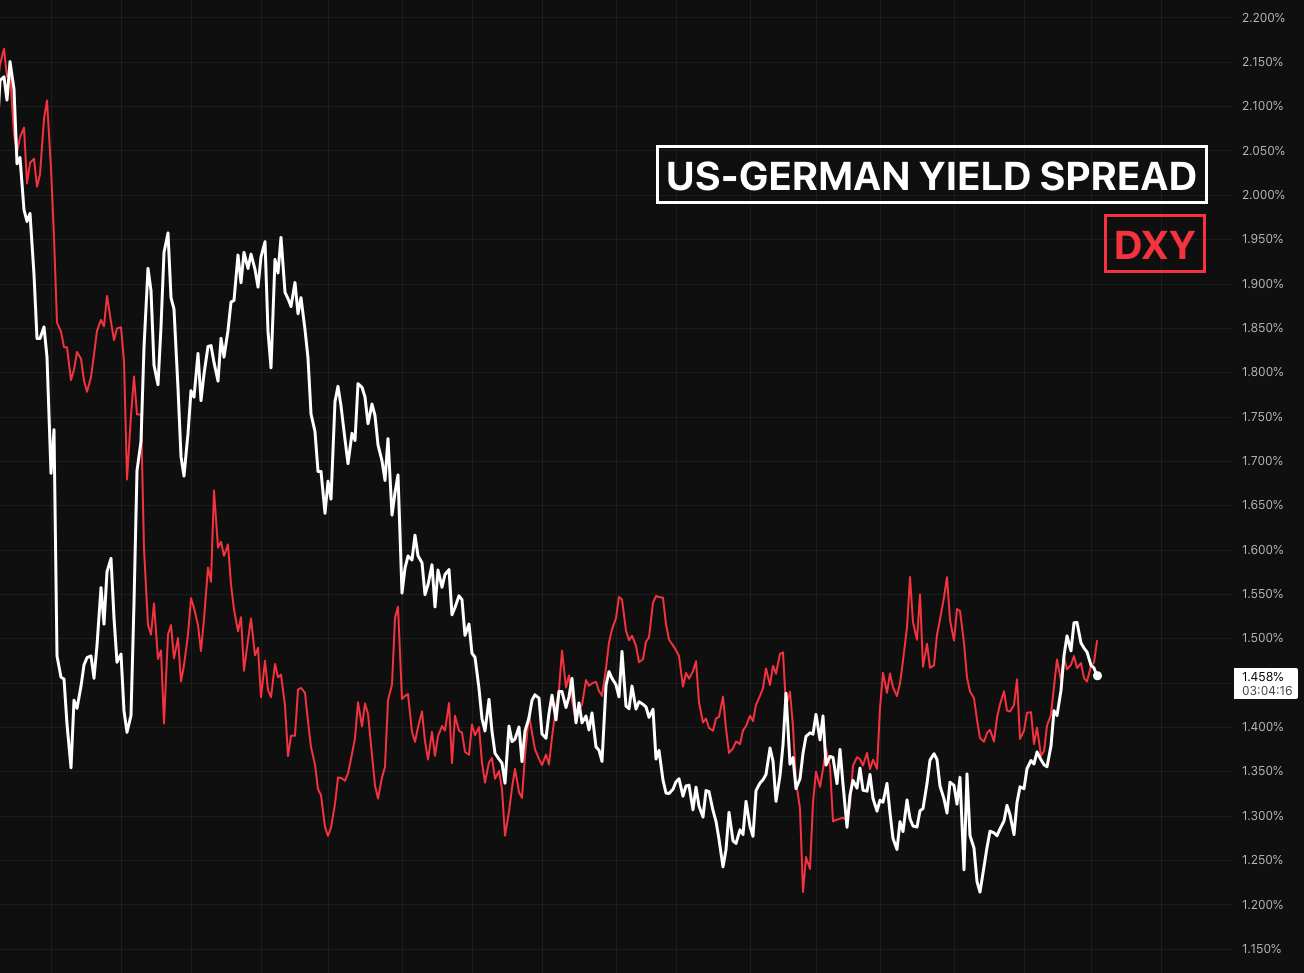
The big question is how far this has to run. To answer it, we turn to a synthetic model built specifically to calculate what the market is discounting for the rate differential by the end of December.
What the Market Is Pricing Into December
This is where it gets interesting. The model strips out the noise and arrives at a single figure: the market expects the ECB-FED rate differential to sit at roughly 100 basis points in favor of the dollar by year-end. That is a meaningful gap, and it sits firmly in dollar-positive territory.
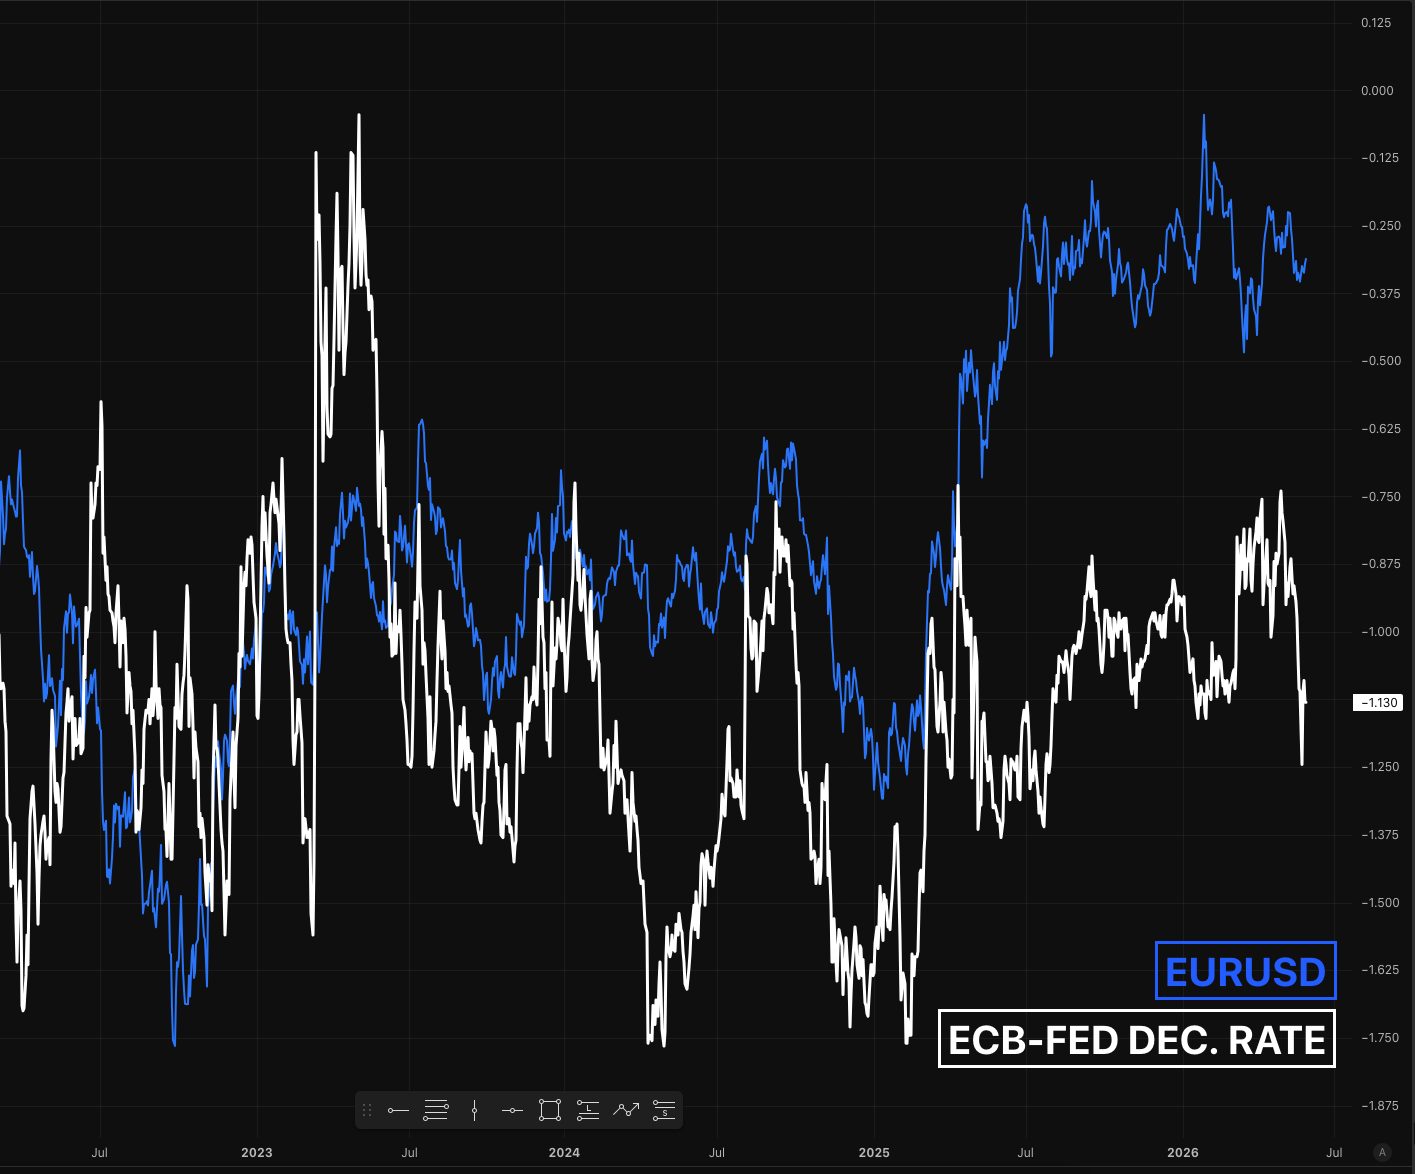
Overlay this synthetic differential against EUR/USD and the correlation is unmistakable. Nearly every move moves in tandem, which tells us the model carries genuine predictive power. But the differential has recently dropped sharply, and EUR/USD has not followed it down.
When a reliable leading indicator moves and price refuses to follow, that gap is a clue.Real yields and the equity dynamic are holding EUR/USD back from cascading lower, for now.
The fundamental and macro picture is greatly in favour of a lower EURUSD re-pricing. But there are an avalanche of Dollars hitting the market, from notorious, deep pocket, players.
Central Bank Warfare: Who Is Standing in the Way
Most of the macro and fundamental picture favours EUR/USD dropping, yet it has not dropped. It is obviously fighting something, and that something is not mysterious once you know where to look. A massive wall of state sponsored dollar liquidity.
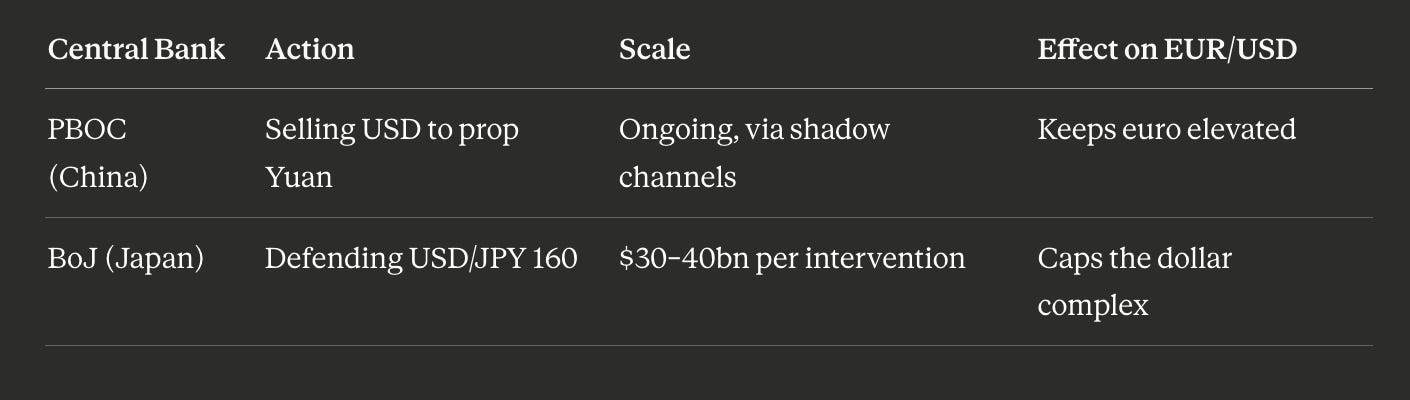
China’s Shadow Defense of the Yuan
The first combatant is China. Look at USD/CNH and the behaviour is clear: dollars are being sold to prop up the Yuan, and that selling has not stopped. The likely mechanism is either offloading dollars through shadow banks or some form of internal financial maneuvering, but the effect is the same. The Yuan keeps strengthening, and every dollar sold to achieve that is a dollar of resistance against the euro falling.
Once that selling stops, the fundamentals kick in and EUR/USD can decline sharply. The cap is artificial, and artificial caps do not hold forever.
Japan’s Relentless Defense of 160
The second combatant is the Bank of Japan, and its behavior is almost ritualistic. Every single time USD/JPY meets the 160 level, the BoJ steps in and sells dollars aggressively, to the tune of $30 to $40 billion at a time. Pull up a line chart of USD/JPY and the pattern is impossible to miss: price reaches 160, the BoJ intervenes, the dollar drops, the market grinds back up, and the cycle repeats.
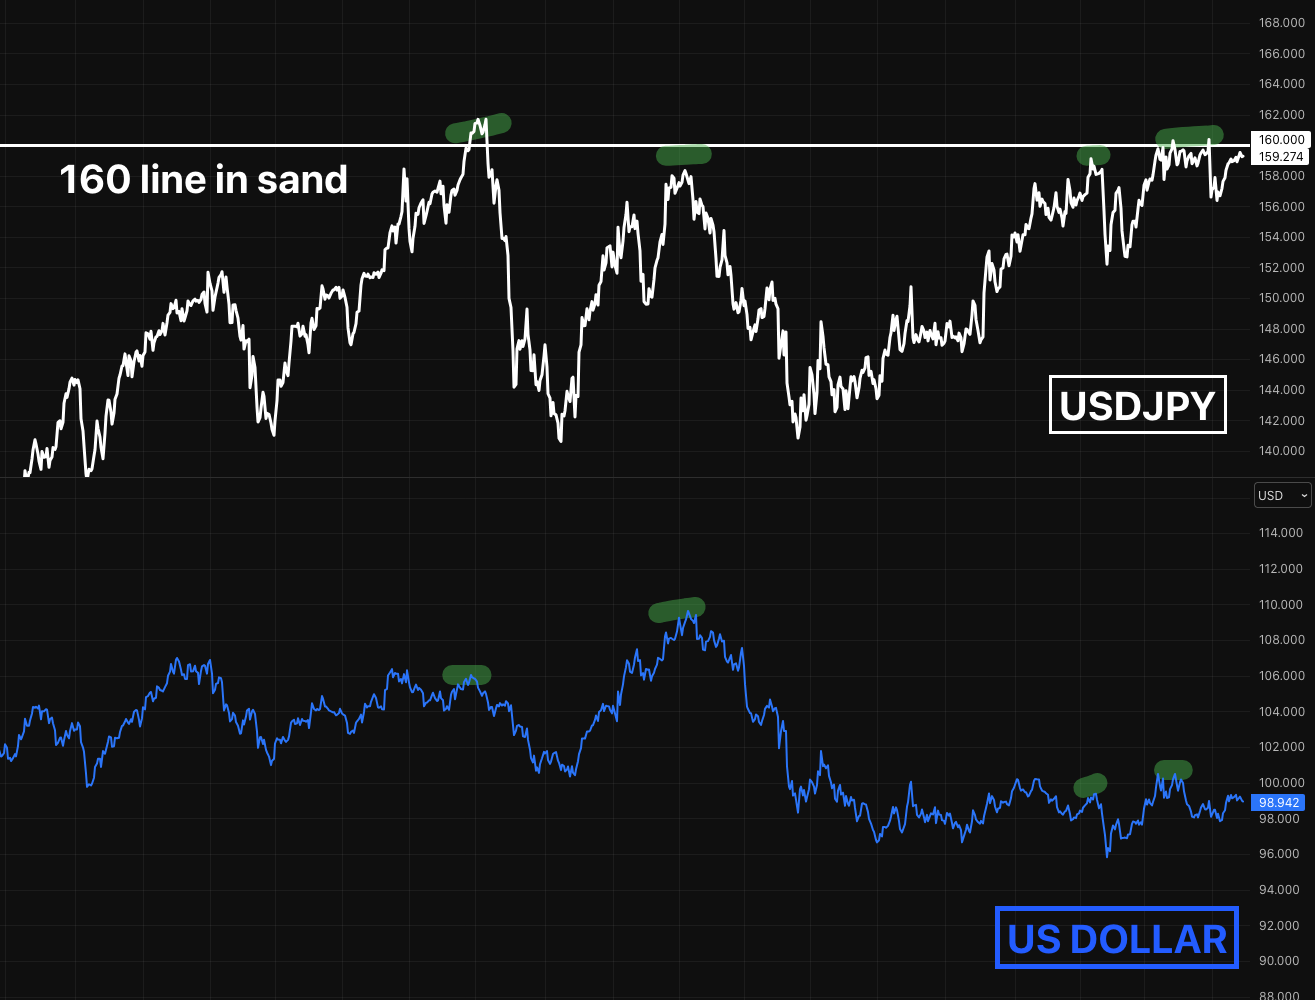
What is striking is how unsuccessful this is. Every intervention is followed by the market climbing right back. It is not an effective strategy in any durable sense, yet they keep executing it, and in doing so they keep the entire dollar complex capped.
These massive interventions do not change the long term trend because they do not change the interest rate reality. Investors buy right back into the dollar for the higher yield. But while these central banks are actively burning through their dollar reserves, they act as a temporary ceiling on the greenback.
Without Tokyo and Beijing manipulating this flow, macro modeling suggests EUR/USD would be trading well below 1.10 today.
The Federal Reserve’s Liquidity Tap is shutting
The Fed had been expanding its balance sheet by buying short-term bills, flooding the system with roughly $250 billion since late last year. That injection loosened financial conditions and gave risk assets a powerful tailwind.
Now the Fed is slowing it down, hard. The pace is dropping from $40 billion a month to $20 billion, and in June it falls to around $10 billion.
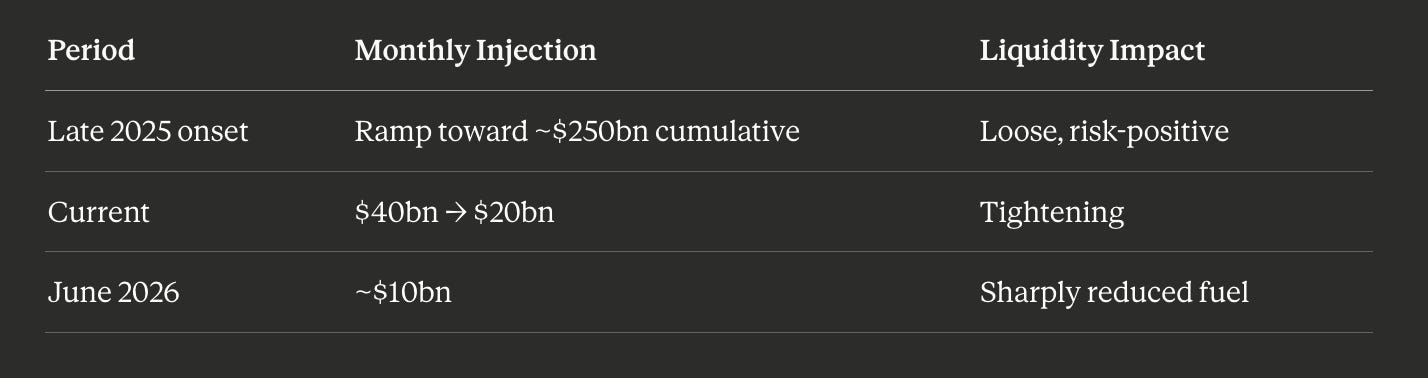
Fewer dollars entering the system means less fuel for the S&P 500 to push higher, and fewer dollars circulating usually means EUR/USD can finally begin moving down with the tide. The liquidity drain and the fundamental case are starting to point the same way. The question, again, is timing.
The EUR/USD Short Waiting to Detonate
Now we arrive at the trade that everything has been building toward. We took great pain to understand all the actors incentives to open and shut the wave of USD selling.
Imagine the BOJ as a determined lifeguard trying to hold back a tidal wave, while Chinese banks secretly build sandcastles on their side and the Fed as a swimmer who’s been doing laps injecting liquidity. Now, they’re just floating on a pool noodle
The Six-Week Cycle Setup
The six-week cycle indicator exists for exactly this kind of trade: large, conviction-driven positions held without being shaken out by local volatility. The 50 level currently sits around 1.1746. A short initiated here anticipates a gap close, followed by a move toward the lower bounds of 1.14.
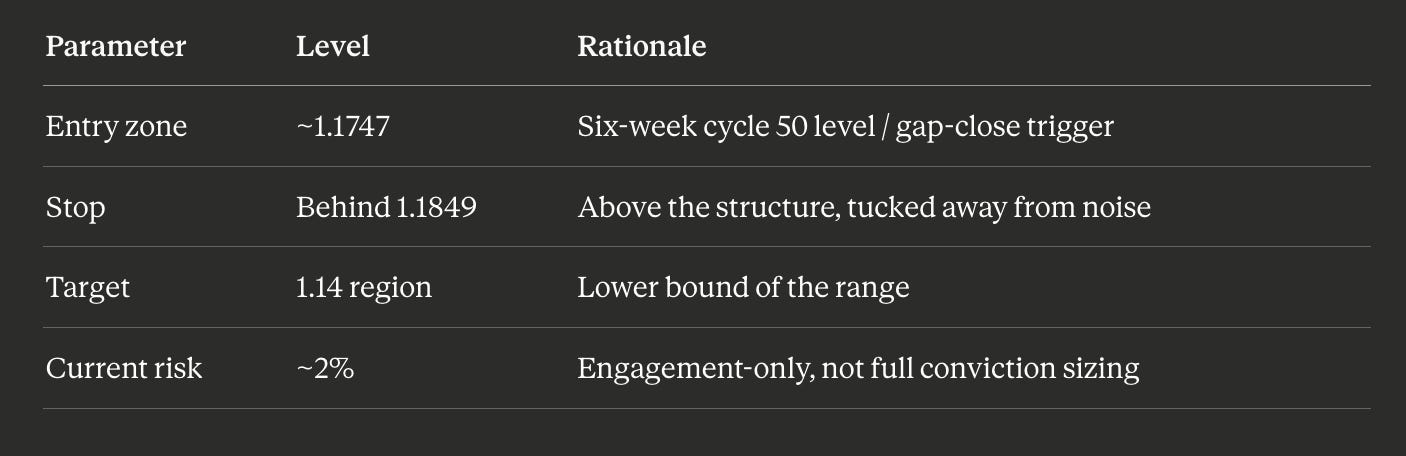
The mechanics are clean. If price reaches 1.1747, the short becomes interesting, with stops tucked safely behind 1.1849. Normally a setup like this gets layered in aggressively, north of a 10-15% capital allocation, and once it snowballs it becomes a very large position. Right now, though, the allocation is a deliberate 2% risk, to stay engaged and vary of central bank activity.
Why so conservative on a trade with such a clean structure? Because of everything we just covered.
The direction to me is crystal clear. The timing isn’t there yet.
The active central bank selling is the wall of worry. Until China stops propping the Yuan and Japan stops defending USDJPY 160, this chart can stay elevated, and the obvious short stays a 2% probe rather than a 15% conviction position. The spring is wound. The release waits on the intervention ending. When it does, this is the trade to scale.
Key Takeaways
Core Trade Setup: EUR/USD Short
Parameters: Short entry near 1.1747 | Stop-loss above 1.1849 | Target down to 1.14.
Position Sizing: Kept at a 2% probe (vs. a 15% high-conviction position) due to structural timing uncertainty.
Fundamental Drivers (USD-Positive)
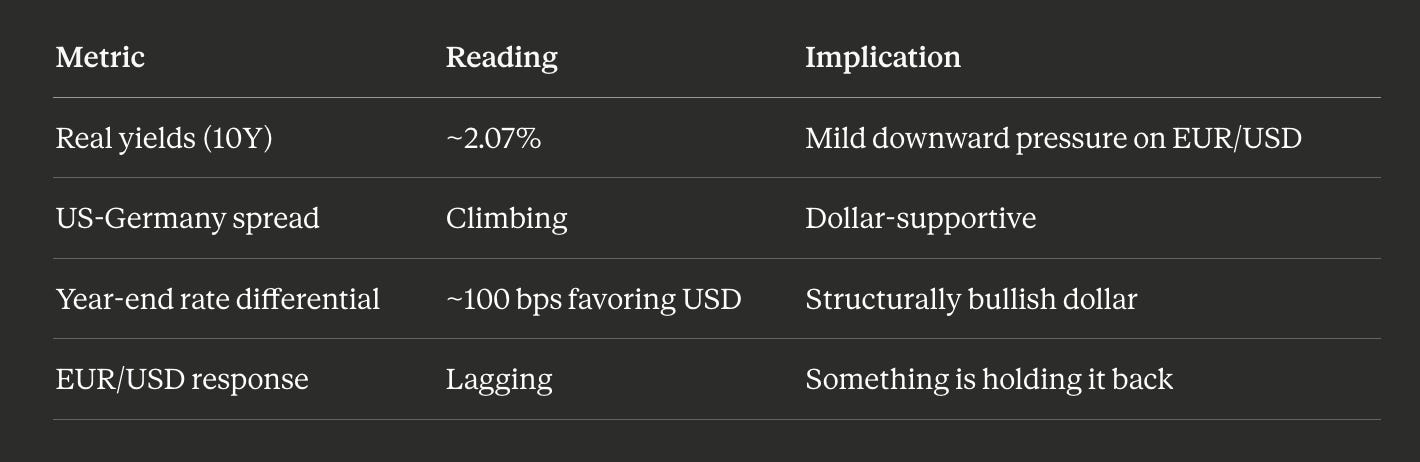
Yield Pressure: High US real yields (~2.07%) and a widening US-Germany yield spread favor the dollar.
Rate Pricing: Synthetic models price a 100 bps rate differential in favor of the US toward year-end.
Liquidity Taper: Fed liquidity injections are tapering from $40B to $10B/month by June, reducing global risk asset fuel.
Market Headwinds & Interventions
Central Bank Resistance: Massive currency interventions are capping the dollar’s natural upside. China is selling dollars via shadow channels to support the Yuan, while Japan is aggressively defending the 160 level on USD/JPY.
Outlook & Strategy
The Principle: Separate direction from timing. While the fundamental direction is clear, timing is constrained by official state interventions.
Scaling Plan: Maintain the 2% probe for now. Once Asian central bank interventions exhaust their reserves, the position will be scaled and layered heavily to capture the anticipated downside extension.
Disclaimer: Market analysis for educational purposes only; not financial advice. Always conduct your own research. YOU MAY LOSE ALL YOUR MONEY.
Trade Strong
Miad
I like seeing you author these Miad and decent thoughts, appreciate it! You should just drop these Brent Donnelly style from raw notes and not have the machines clean it up. Rough authenticity is cool in today's world!