

When Bad Earnings Are Good for Stocks
The Most Underappreciated Signal in Global Equities Just Lit Up

Earnings are rolling over.
Revisions are falling.
And yet equities may be setting up for a rally.
That’s not a contradiction. It’s a cycle.
And it’s one of the most reliable and misunderstood signals in global macro.
The chart below explains everything:
[Chart: BofA ERR + ACWI Forward Return Chart]
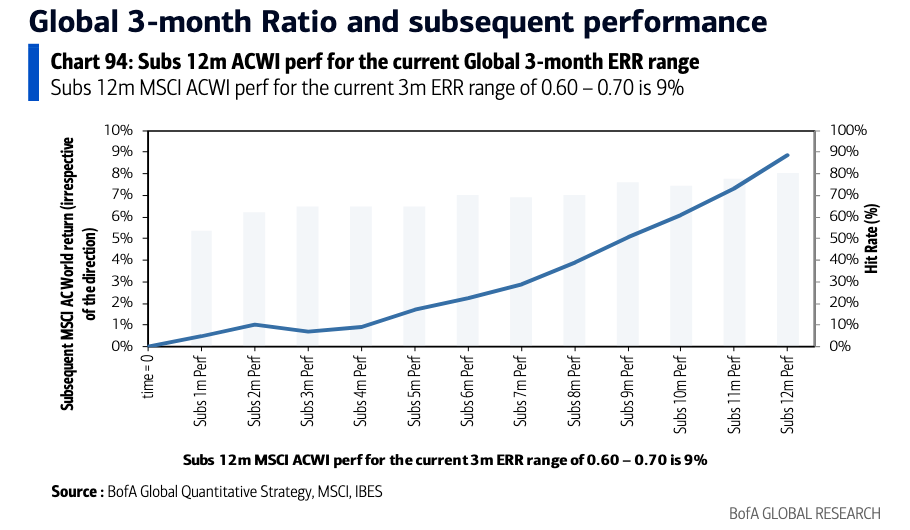
Subsequent 12-Month ACWI Performance When Earnings Revision Ratios Fall from 0.70 to 0.60
Here’s What It’s Telling You
When global 3-month earnings revision ratios (ERRs) fall into the 0.60 to 0.70 range—and keep falling markets don’t collapse.
They rise.
The blue line in the chart tracks how the MSCI ACWI (the benchmark for global equities) performs after that specific condition is met.
Here’s what it shows:
The 12-month forward return averages close to 9%
The trend starts slow, but inflects higher at the 6-month mark
The hit rate how often returns were positive climbs toward 90% by month 12
That’s a strong signal.
Why This Works
This setup lives in the “disbelief zone.”
When ERRs are falling, the market narrative tends to be bearish:
Growth is slowing
Guidance is weak
Analysts are cutting forecasts
And that’s exactly when positioning gets too defensive, too fast.
What happens next?
Liquidity improves. Positioning resets. And equities start grinding higher off a low base of expectations.
It’s not that earnings are good.
It’s that they’ve stopped mattering for now.
What the Crowd Gets Wrong
Most investors anchor to the level of earnings.
Pros watch the rate of change in revisions and more importantly, what the market tends to do next when revision ratios cross key zones.
This one 0.60 to 0.70 and falling is the sweet spot.
It’s weak enough to reset sentiment.
But not yet weak enough to spark a full earnings recession.
In other words:
It’s bad enough to buy.
Chart Insight: The Inflection Begins at Month 6

Note how the slope of returns accelerates after Month 6.
That’s the pivot when the market transitions from chop to trend.
Knowing that changes how you size risk:
Smaller exposure early
More aggressive sizing after confirmation
Tactical vs. structural allocation over 12 months
What This Means for You
We’re in that zone right now.
The current 3-month global ERR sits between 0.60 and 0.70 and it's falling.
That tells us:
The signal is active
The expected return path is positive
The setup improves with time, not instant gratification
If you’ve been waiting for the "all-clear" signal this is as close as markets give you.
The Big Idea
This isn't a call for blind risk-on.
It's a call for informed exposure.
The data says:
Global equities have historically delivered +9% forward returns from this setup
The probability of success rises to ~90% by Month 12
The move begins quietly, builds slowly, then becomes obvious too late for most
Final Word
This is where the edge lives.
Not in headlines or sentiment.
But in what the market tends to do after patterns like this emerge.
We are there now.
Miad