

Winter Is Coming: How Fed Cuts and QRA Set the Stage for a Santa Rally


Executive Summary
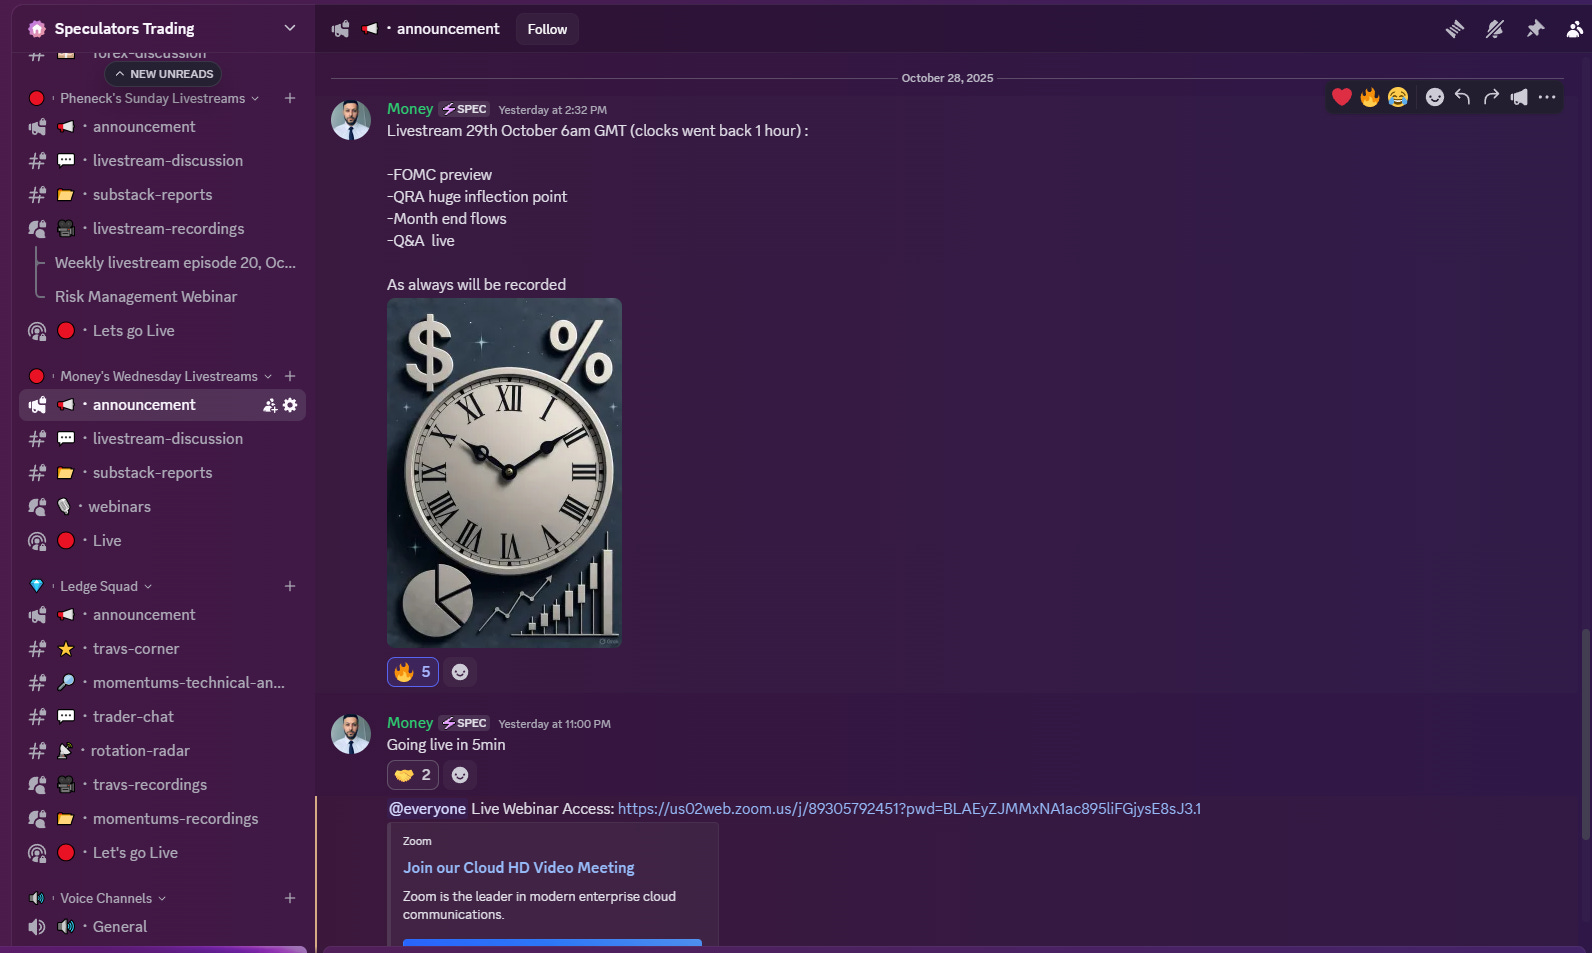
Welcome to this week’s comprehensive market breakdown, recorded on Wednesday, October 29th, 2025. As we enter the final two-month stretch of the year, the focus is sharply on the macro movers and underlying liquidity dynamics that will drive the markets toward a potential Santa rally. This analysis dissects the critical events ahead, primarily the Federal Reserve meeting today and the highly anticipated Quarterly Refunding Announcement (QRA) from the Treasury on November 3rd. These events are pivotal in determining the composition of government borrowing and, consequently, market liquidity.
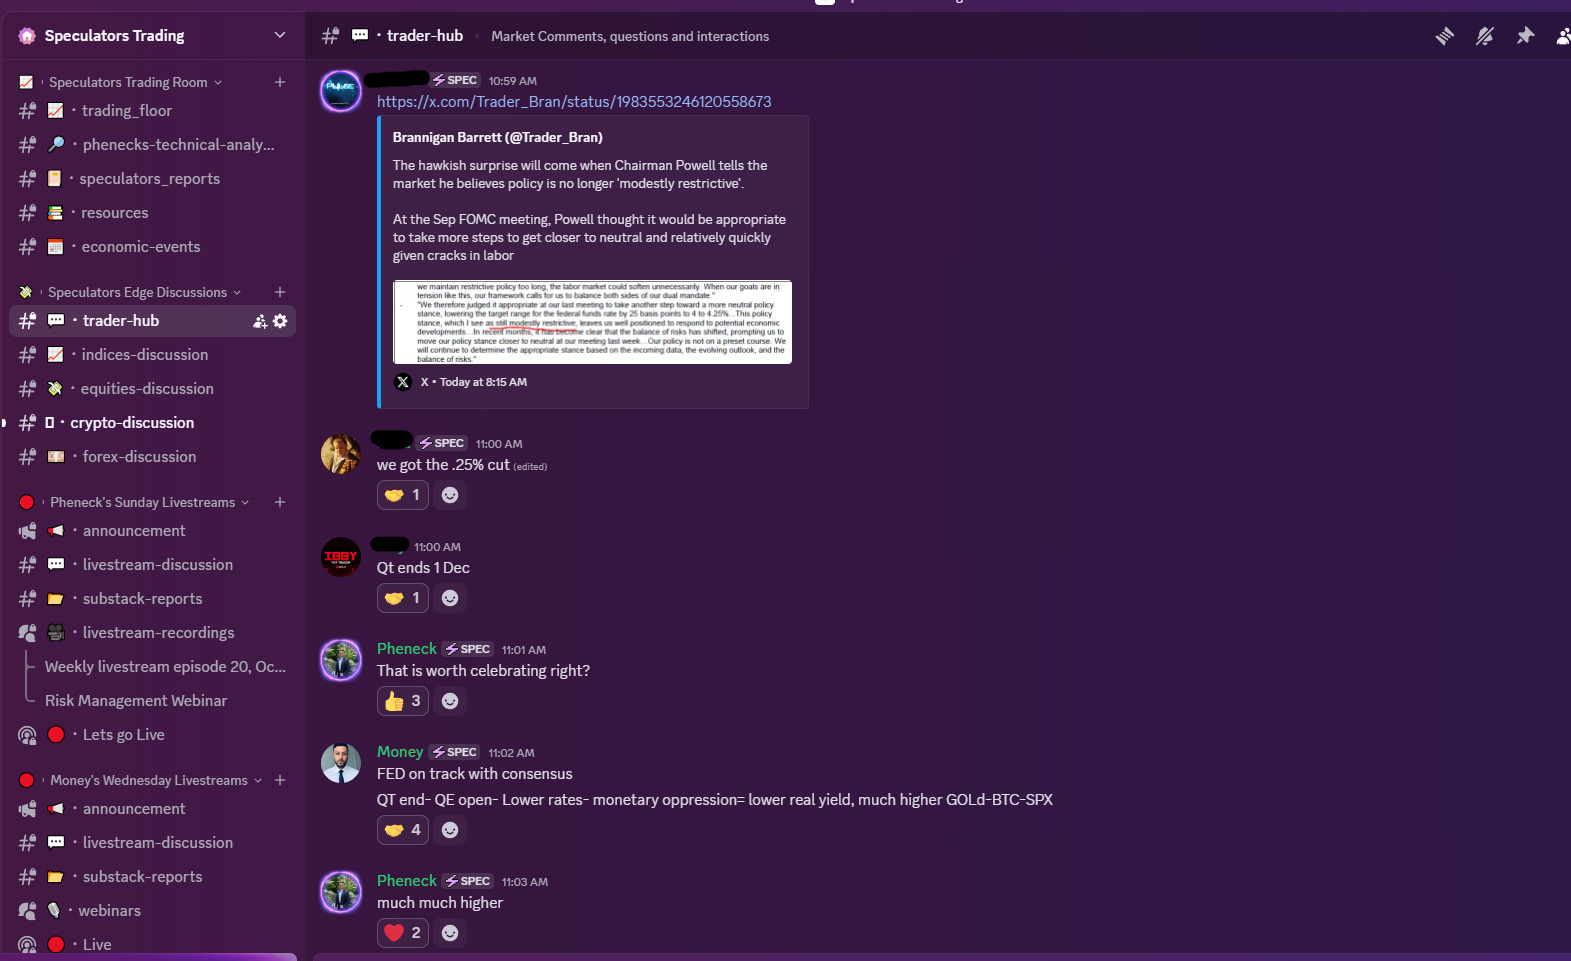
The current environment is defined by the Federal Reserve’s easing cycle. The market is discounting a 25-basis-point cut today and 70% in December, followed by further cuts in 2026. This path is supported by stable inflation expectations, with the 10-year break-even inflation rate holding steady at 2.28%, well below the Fed’s 3% ceiling that triggered the March 2022 pivot. Commodities, particularly oil, remain weak, further assuring the Fed that cutting rates will not immediately stoke inflationary pressures. However, we are “flying blind” on the jobs market due to the ongoing U.S. government shutdown preventing data publication.
Liquidity remains the dominant theme. While the QRA is expected to favor short-term borrowing (positive for liquidity), a concerning trend is emerging in Bank Reserves. These reserves are draining, tightening commercial liquidity and offering an explanation for the U.S. dollar’s recent, baffling strength. This drain could lead to a market “jolt” or squeeze point, similar to 2018-2019, before the Fed inevitably steps in. Despite this underlying tightness, overall risk sentiment is strong. The SPY/TLT ratio is holding at all-time highs, indicating money continues to flow heavily into equities over bonds.
“A lot of people are saying it’s building up into a bubble... Realistically, once that move comes, it’s much easier to trade it rather than trying to front-run an obvious steam train here.”
A significant portion of this analysis introduces the Six-Week Cycle, a proprietary methodology for mechanical trade execution. This system uses the price range between Fed meetings to establish entry, stop, and target levels using modified Fibonacci tools. It relies on an empirical rule: 90% of the time, once an asset breaks out of its previous cycle’s range, it will not trade back to the opposite extreme during the current cycle. This allows traders to layer positions and manage risk systematically.
In the crypto markets, health is gauged by dominance charts. Stablecoin Dominance is currently spiking, suggesting we are in a “discount zone” for altcoins, but the near-term outlook for Ethereum has shifted. Conviction that the $3,500 level marked the bottom has dropped from 90% to “less than 50%.” Expectations are now leaning toward another dip or bearish reaction as liquidity fails to materialize as expected, potentially pushing the altcoin bottom toward the previously forecasted November/December timeframe.
Key FX setups are emerging. AUD/NZD is approaching a critical 1.15 level, viewed as an “unspoken peg” maintained by central banks for trade stability. A short opportunity is anticipated following a potential stab above this level. Meanwhile, USD/JPY presents a high-probability setup focused on closing a massive gap between 147.33 and 149. This closure will likely occur via either a significant dollar devaluation (e.g., Fed liquidity injection) or a massive risk-off event causing a parabolic Yen surge.
Key Takeaways:
Fed Path: Continued easing expected, with two 25bp cuts priced in by year-end, supported by stable inflation (2.28% break-even).
Liquidity Tensions: QRA (Nov 3rd) expected to be positive, but draining Bank Reserves are tightening conditions and strengthening the dollar, risking a near-term “jolt.”
Six-Week Cycle: A mechanical system for trade execution based on inter-Fed meeting ranges and a 90% breakout probability rule.
Crypto Caution: Ethereum’s $3,500 bottom is now questionable (conviction <50%); expecting another leg lower for altcoins.
FX Opportunities: High-probability shorts developing on AUD/NZD at the 1.15 “peg” and USD/JPY targeting the gap closure at 147.33.
Indices Outlook: S&P 500, NASDAQ, and DAX are bullish but overextended at all-time highs; better position entries expected on dips post-QRA.
If you’re finding value in our research, we’d like to extend a personal invitation to explore the next level of market analysis within our Speculators Trading community. Our Discord server is a collaborative space dedicated to helping traders optimize capital allocation. Inside, you’ll gain access to our real-time Trading-floor commentary, high-conviction technical setups, proprietary educational resources, and strategic bi-weekly livestreams. We invite you to experience these premium resources firsthand and see how they can enhance your portfolio management. Join us for our weekly livestreams and wednesday macro webinars using Webinar Pass for 39.99 USD/month. If you would like to receive full access to our discord community and timely market updates in the world of finance where information flows at warp speed, Monthly Pass access (99 USD/Month) is the best bang for the buck.
Macro Drivers: The Fed, QRA, and Liquidity Plumbing

The trajectory of the markets through year-end hinges on several critical macro factors, primarily centered around Federal Reserve policy, Treasury borrowing mechanisms, and the underlying financial plumbing that dictates liquidity. These factors are going to drive us toward year-end but could also potentially give us a Santa rally.
Federal Reserve Outlook and the FedWatch Tool
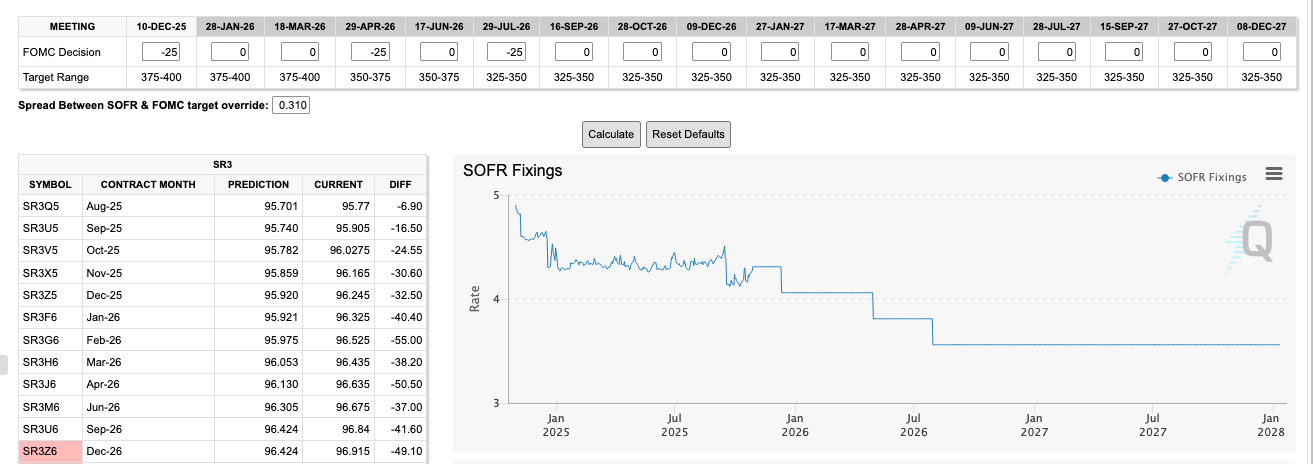
The Federal Reserve meeting today (October 29th, 2025) is a key event. We utilize the FedWatch chart to understand what the market is discounting regarding future rate cuts. The current breakdown is highly specific:
October 29 (Today): A 25-basis-point cut is discounted.
December: Another 25-basis-point cut is expected.
January 2026: A pause.
March 2026: A pause.
April 2026: A cut.
June 2026: A cut
The Fed’s guidance typically informs bond traders about the intended policy path over the next 12 months. “Anything between now and, let’s say, October or December of next year, is fairly important.” Shifts within this timeframe for example, if 2027 cut moves into late 2026 can significantly move the market. Projections beyond two years are generally ignored; “nobody can predict that far out anyway.”
We monitor this chart because the Fed monitors it closely. If the Fed does not push back against market pricing in their communications, it implies they are comfortable with the market’s expectations and are on a similar path.
Inflation Expectations and Commodity Stability
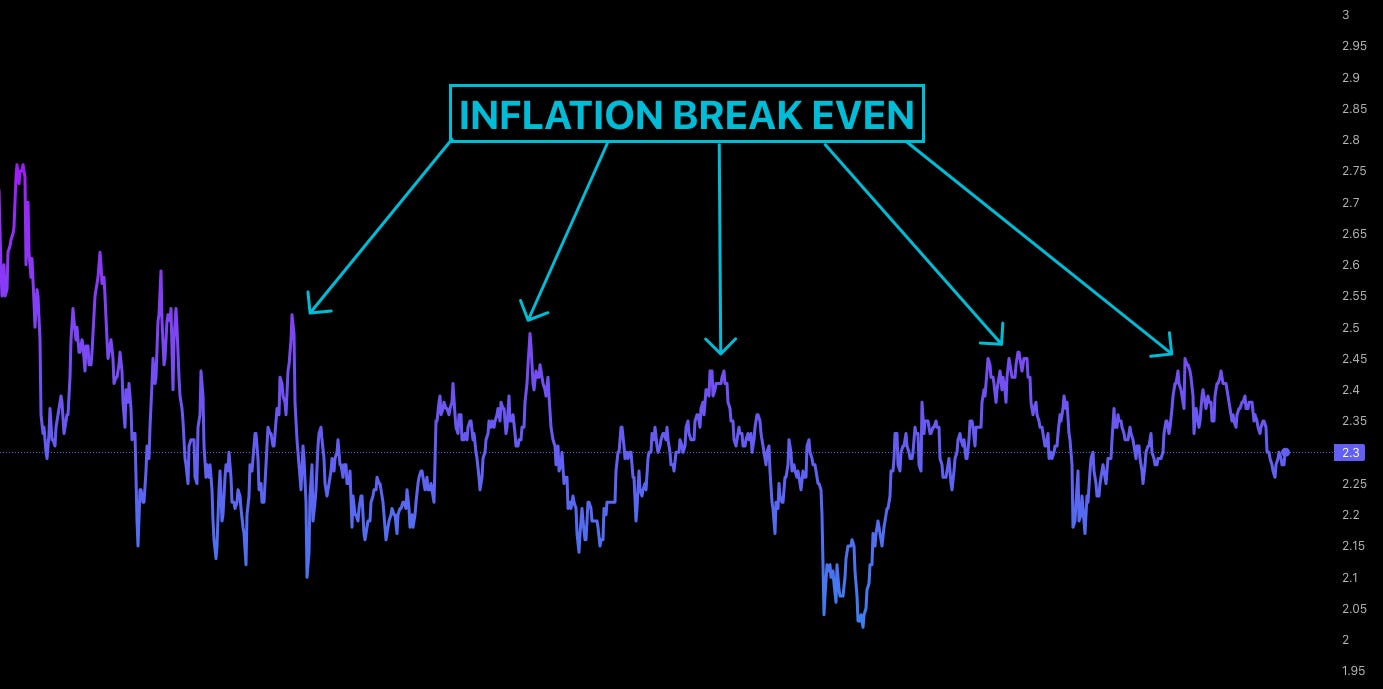
A crucial metric the Fed analyzes when making policy decisions is the break-even inflation rate. This is the rate remaining when inflation components are stripped away from the 10-year U.S. government bond yield. It currently sits at 2.28%.
This number is vital to the Fed’s mandate of maintaining “price stability.” If this rate starts un-anchoring or pushing dramatically higher, the Fed will intervene, as it means they won’t be meeting their mandate. They found their ceiling back in March 2022, when the market started moving toward a 3% inflation break-even. “They slammed the brakes, right? The big pivot that everybody talks about from the Federal Reserve and Jay Powell was started during that era.”
Currently, the Fed has started to loosen financial conditions again by cutting rates.3 The fact that the break-even chart has not moved dramatically is positive, suggesting the Fed can continue cutting without immediate inflationary consequences. As long as this is meandering where it is, “they will just cut left, right, and center.”
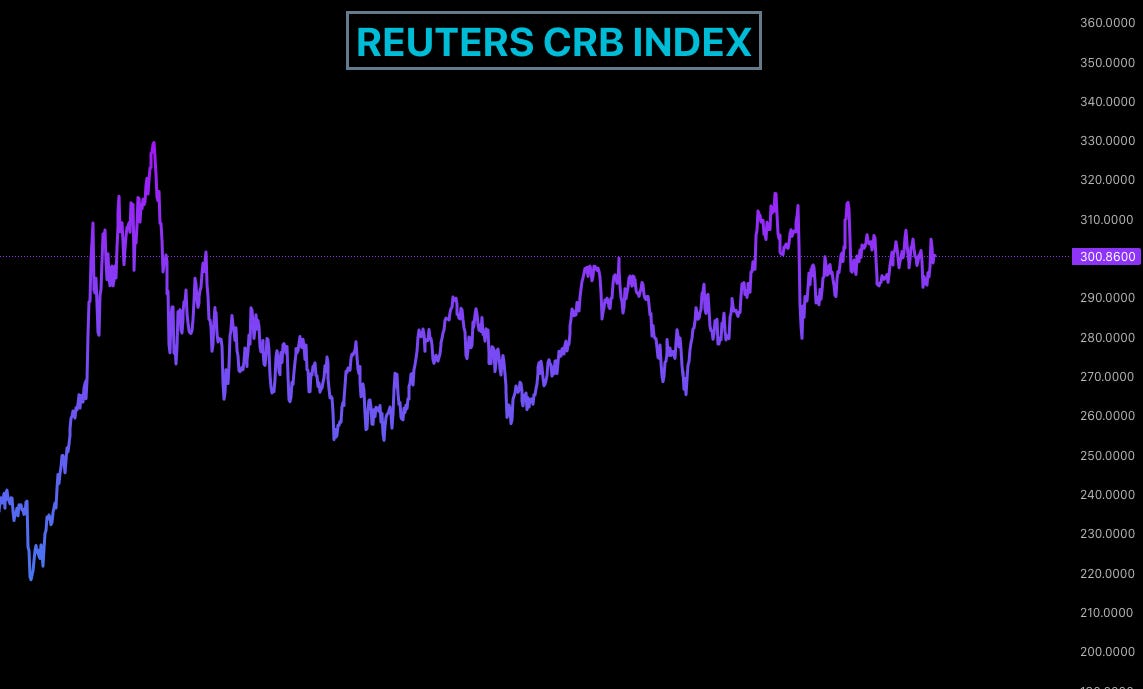
Commodities also support this view. The Reuters commodity index is fairly high but has not climbed significantly since earlier in the year. This stability is largely driven by oil, which has been mostly weak despite spurts of aggressive moves. Oil currently doesn’t seem to have a lot of buyers, potentially due to increased supply from OPEC and the market’s lack of concern over Russian oil coming offline. This means the path for the Fed continues to be lowering rates.
The one unknown remains the jobs market. Due to the U.S. government shutdown, data points are not being published. “We are flying blind on the jobs market, and so is the Fed. We have no idea.” While everybody is saying it has deteriorated, the hard trend remains elusive.
The November 3rd QRA: A Liquidity Inflection Point
The Quarterly Refunding Announcement (QRA) from the Treasury, scheduled for November 3rd, details the composition of government borrowing. This event tends to create massive inflection points, usually a week before, the week of, or a week after the announcement. Massive moves are expected around the beginning to mid-November, requiring traders to have a good idea of the direction to pre-position.
The composition is key:
Short-Term Borrowing (Bill Market): If the Treasury borrows short-term, the money is recycled back into the economy quickly. This is positive for liquidity and risk assets.
Long-Term Borrowing (e.g., 10-year Notes): This tends to lock money away for longer, and the market generally views this negatively.
The consensus is that the Treasury will borrow more heavily in the short term, which is good for liquidity. The November 3rd release will confirm if this is still the case and provide projections for the January quarter, informing future flows.
The Bank Reserve Drain and Dollar Strength
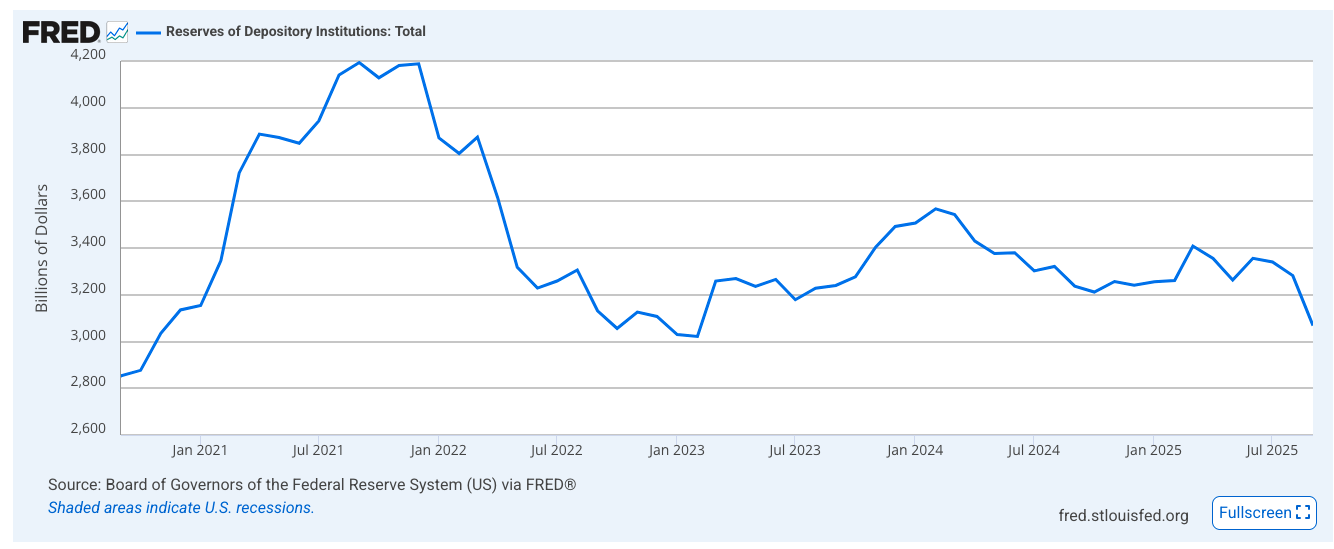
Bank Reserves are a chart rarely looked at until it becomes an issue. Currently, those reserves have been draining. This drain tightens liquidity on the commercial side and explains why the dollar has been stronger recently.
This draining will continue until a point where it becomes too painful, forcing the Fed to step in, similar to the interventions in 2018 and 2019 when the Fed started buying bills. When that point comes, there will be a squeeze point and a potential “jolt in the market, for lack of a better word.”
In response to a viewer question asking for clarification on the Bank Reserve issue: Essentially, when Bank Reserves get drained, the Fed eventually steps in to help with the plumbing of the financial markets. Reserves were “very, very juiced up in 2021 and 2022.” As they move back down, they are getting drained. The current drain is not too alarming yet, but it can cause short-term market stress until the Fed intervenes, which is usually a good thing when it happens. It often becomes the explanation when other economic indicators fail to clarify market behavior: “Oh, banks are pulling liquidity. That’s probably the issue.”
Gauging Risk: Financial Conditions and Real Yields
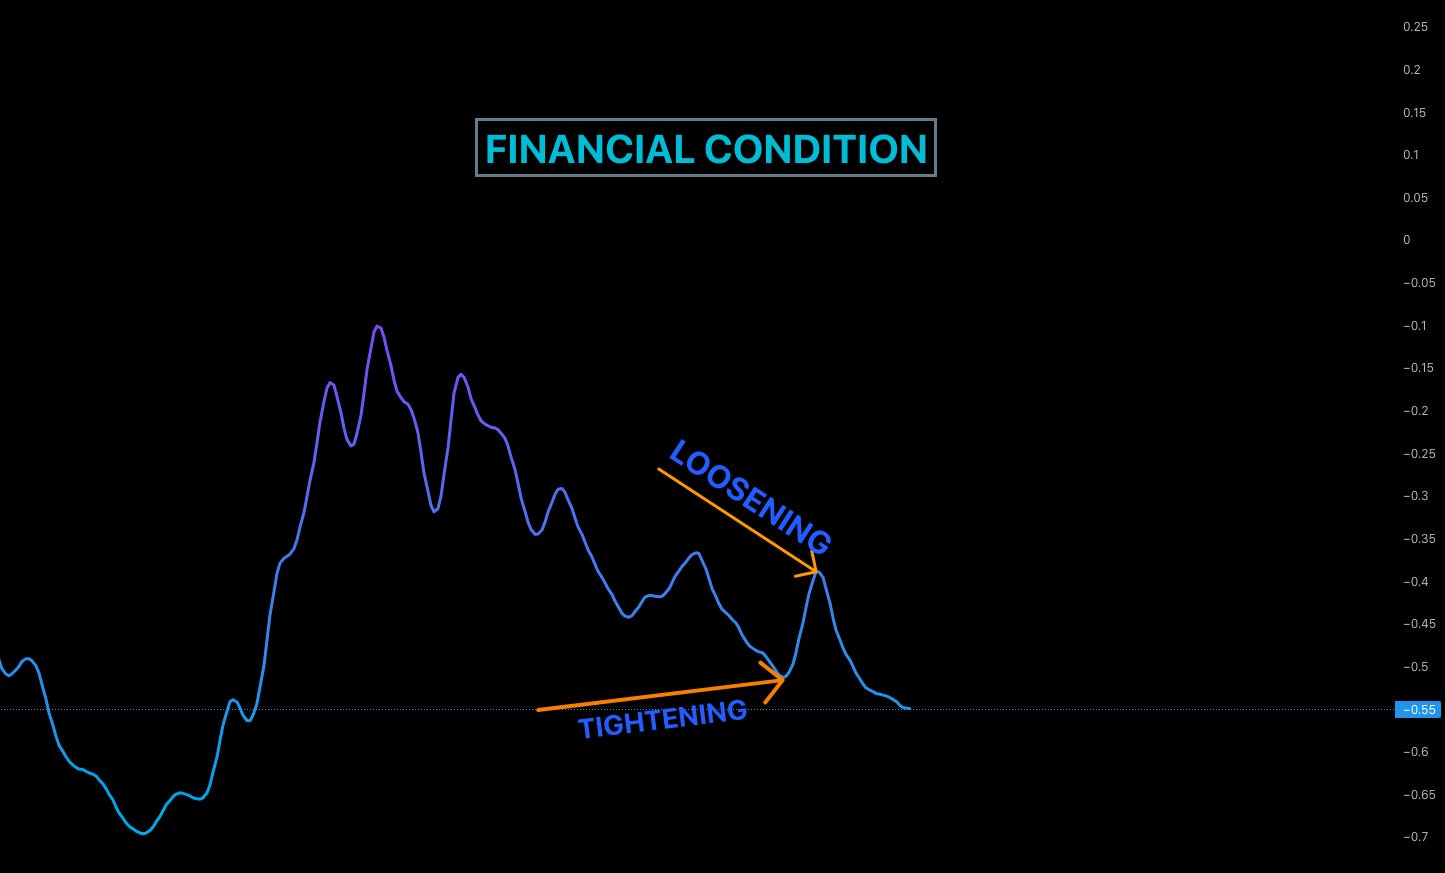
We assess risk using several indicators. The Financial Conditions Index (FCI) informs us how easy or difficult it is for institutions to borrow money.5
Lower FCI: Financial conditions are loose (good for crypto/risk assets).
Higher FCI: Financial conditions are tight (bad for risk assets).
This is a lagging indicator by a couple of weeks.
A more short-term tool is the real yield. The correlation between real yields, the S&P 500, and the dollar provides straightforward trade signals with maximum effectiveness in specific quadrants:
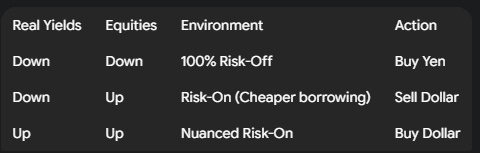
Currently, real yields have been stuck since September but clearly dropping since the start of October. Simultaneously, the S&P 500 has been rising. In this environment (Yields Down, Equities Up), the U.S. dollar should be dropping. However, it has been choppy.
This anomaly is baffling. “I think it is caused by that liquidity issue from the Bank Reserves I just mentioned, but it’s too difficult to tell.” This uncertainty means hesitation in engaging in big FX trades until the issue is resolved, as a clear runway is preferred. The next directional move for the dollar should be lower based on the correlations.
Additionally, the spread between government and corporate bond yields is converging, indicating a risk-on environment where the market is not worried about corporate defaults.
SPY/TLT and the Liquidity Steam Train
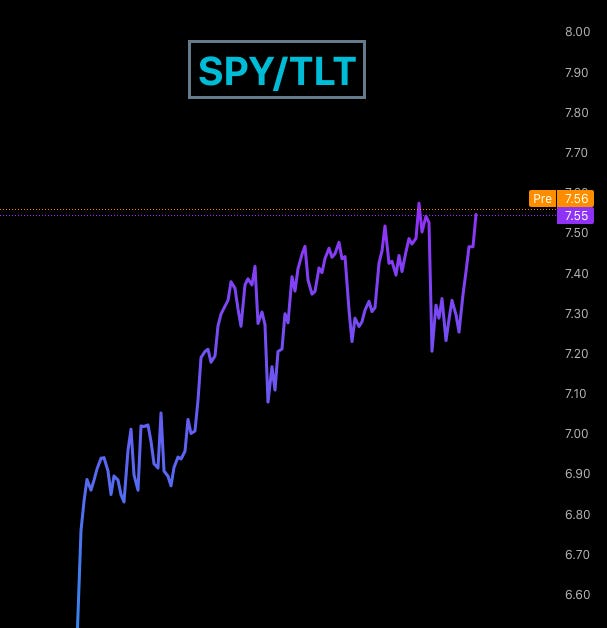
Liquidity is still fairly good in the market, beyond the Bank Reserves issue. The simplest gauge for this is the SPY/TLT chart, which shows whether money is flowing more toward equities (SPY) or bonds (TLT).
This chart is holding at literal all-time highs. “Look at this chart. There’s nothing to suggest there’s a liquidity crunch. When the crunch comes, we will all see it.” While many suggest a bubble is forming, it is crucial not to front-run this obvious momentum. “Realistically, once that move comes, it’s much easier to trade it rather than trying to front-run an obvious steam train here.”
Mastering the Six-Week Cycle Methodology
The Six-Week Cycle is a core methodology used to express sizing, levels, stops, and targets, automating the trading process and allowing for engagement with the market in a mechanical way. This is great for people who maybe don’t have a lot of time on their hands to trade but want to express specific trades in particular directions, or for those who want to build positions along a particular path.
The Philosophy: Mechanical Execution vs. Macro Direction
Finding the macro direction whether the market will go up or down should not always be a mechanical process. It requires analysis and understanding of the broader context. However, once the direction (bullish or bearish) is established, the execution entering and managing the trade should be purely mechanical, with as little input as necessary from the trader.
This is crucial because as price moves, emotions spike, and local volatility can shake traders out. “It will be a drain on your emotional resources, pulling you away from actually making decisions on trading direction or even researching a bit more.” The Six-Week Cycle addresses this by using the price range between every Federal Reserve meeting (approximately six weeks) as an anchor for trading levels.
Drawing the Range and Fibonacci Levels
The process involves identifying the high and low of the previous cycle (from one Fed meeting to the next). A modified Fibonacci tool is then drawn across this range. The levels used are: 0%, 25%, 50%, 75%, and 100%, along with projections.
Using Ethereum as an example: If the macro analysis suggests a bearish outlook, the trader looks to engage short from specific zones within the established range.
Short entry at the 50% level in anticipation of a breakout below.
Short entry at the 75% level in anticipation of a move lower.
This allows for layering in shorts to build bigger positions, rather than relying on a single entry, and helps mitigate the impact of fake-outs or local volatility.
The 90% Empirical Breakout Rule
The power of the Six-Week Cycle comes from a robust empirical observation based on years of research across thousands of charts in major markets, including crypto:
The market will, 90% of the time, eventually break out either above or below the established range.
Once that breakout happens, 90% of the time, it will not reach the other side of the range during the entirety of the next cycle.
“What do I mean by that? ... Let’s just say you were long here in this previous range. You were long in anticipation of a breakout. Once that breakout happens... you can be 90% sure—which is a massive figure—that the price will not trade below [the bottom of the previous range] for the entirety of the next cycle, until the next Fed meeting.”
Case Studies: Gold’s Massive Move and Altcoin Contractions
This methodology is highly effective, particularly when an asset is bubbling up and building toward a larger move. The Gold chart from the August cycle provides a perfect example.
In early August, the previous cycle established a clear range. Macro and liquidity research strongly indicated an upward breakout was likely. Instead of trying to find the perfect entry, the Six-Week Cycle levels were used to pile into positions systematically
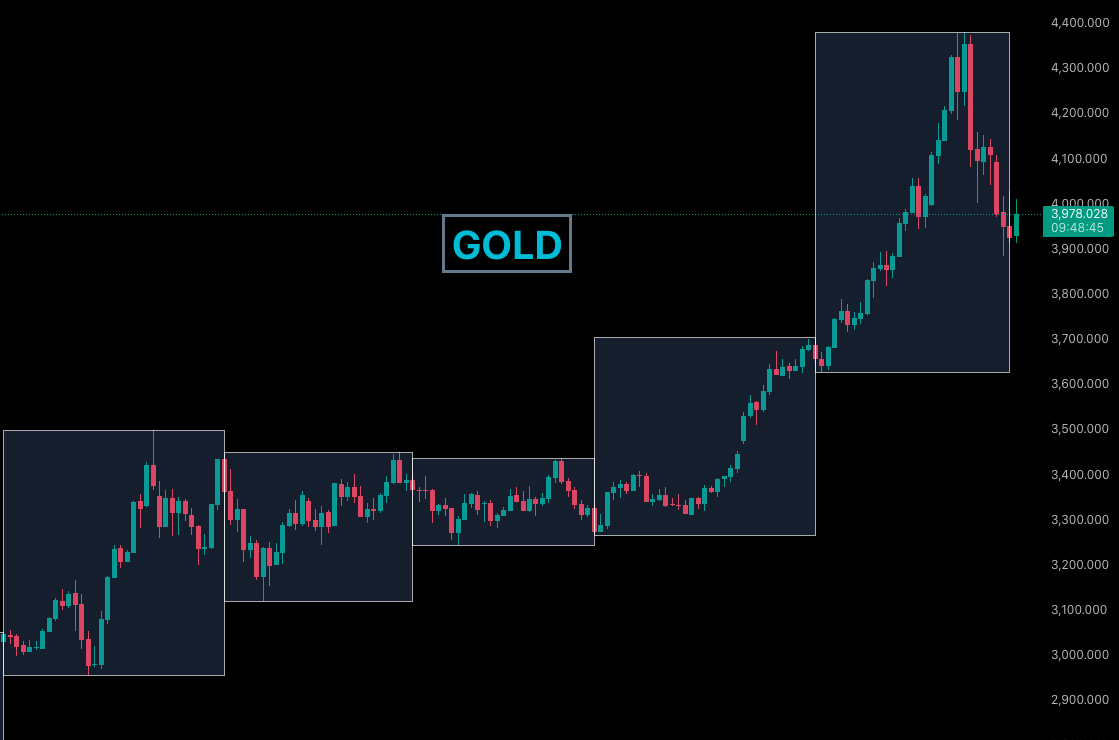
.
“I ended up piling into two or three different positions. One position went into profit, so I added another position and moved the stop loss up. Another position moved into profit, so I moved both stop losses up, and all of a sudden, we had this massive, massive move. It catapulted us up.”
This systematic layering allowed for capturing the significant upside, trailing the position mechanically rather than guessing the next entry or exit point.
The cycle also works well on altcoins. Looking at Pepe, a previous six-week cycle showed a contraction followed by a massive breakdown. The sweet spot for the strategy is often in an environment of contraction, as it strongly suggests an impending blowout move. Solana, in contrast, was more or less stuck in its zone during the previous cycle. Complete 6 week Fed cycle strategy.
Crypto Market Health and Altcoin Outlook
To assess the health of the crypto market, we look beyond price action and analyze dominance charts, which reveal liquidity rotations and market share dynamics.
Stablecoin Dominance: Identifying Discount Zones
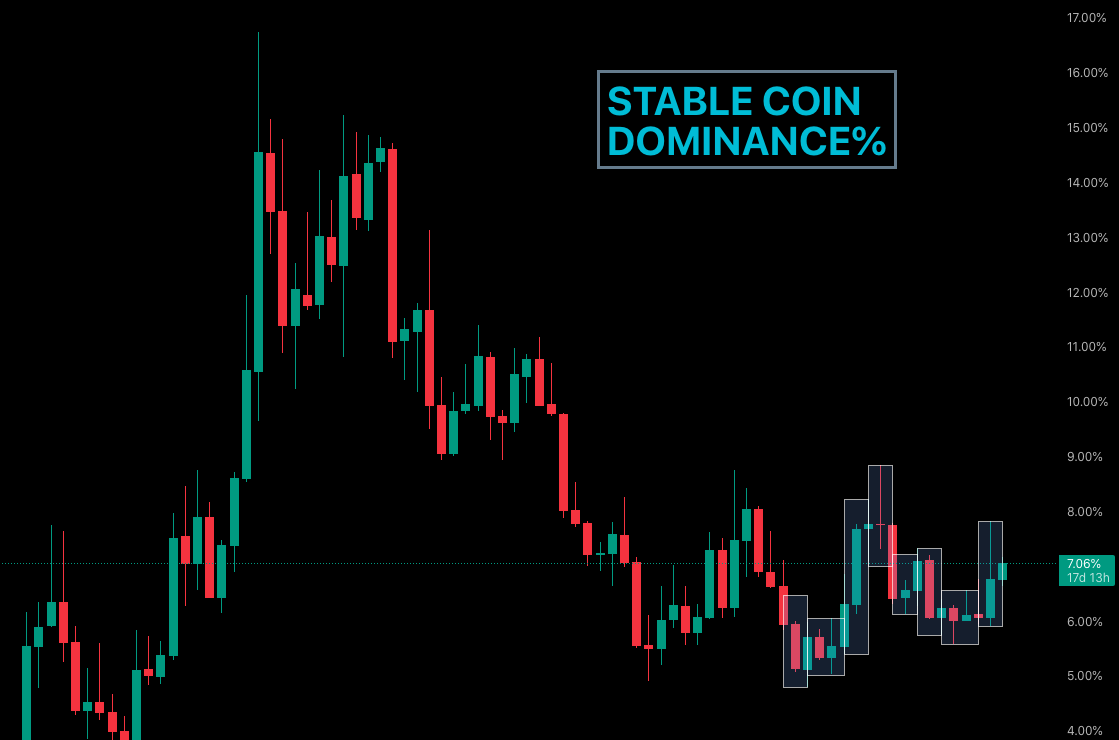
Stablecoin Dominance informs us how much of the crypto market share is held in stablecoinsessentially cash parked on the sidelines, un-invested or engaged in the market.
Looking at the weekly view, historical patterns emerge (in the short history of stablecoins):
Tops: Around 15%.
Support: Around the 5% level.
The recent move saw a bounce from the 5% level in December, followed by a dip that provided a long entry for alts around April. Currently, it has bounced again and is spiking up.
This chart is used to identify zones of value:
Discount Zone (High Dominance): The current area is considered a discount zone for altcoins. We should be buying alts here in anticipation that dominance goes back down (meaning money flows out of stables and into alts).
Premium Zone (Low Dominance): When dominance is back down near 5%, altcoins are likely stretched, and a sell-off can be expected.
The expectation is that Stablecoin Dominance will remain range-bound between 5% and 9%. A break above 9% would signal a huge issue for the entire crypto market.
The “Safety Net”: Stablecoin Plus Bitcoin Dominance
A less common but highly informative chart is Stablecoin Dominance plus Bitcoin Dominance. This shows how much market share is locked away in these “safer” assets versus altcoins.
Higher Chart: Worse for altcoins.
Lower Chart: Better for altcoins.
This chart exhibits a near-perfect inverse correlation with Ethereum, especially in the short term. “Every time you see those spikes, like the spike up here, it marked the bottom for Ethereum.” The current pattern looks like it wants to create a ceiling, suggesting Ethereum could start another leg up, though the timing remains uncertain until nearer the start of November.
A viewer, Trav, commented that “’BTC plus USDT [Dominance] is almost like the safety net for crypto.’ He is absolutely right.” The focus here is not on price levels but on market share rotations. Currently, liquidity is favoring stablecoins and Bitcoin, while “Altcoins aren’t getting a lot of love here.”
Ethereum’s Shifting Bottom: Conviction Drops Below 50%
The outlook on Ethereum has significantly shifted heading into the new Six-Week Cycle. On a technical level, it appeared that Ethereum had bottomed out at the $3,500 level after the recent crypto flash crash.
However, as we progress and understand the macro liquidity flows, the conviction has dramatically decreased. “My... conviction that this was the bottom has pretty much gone from 90% to less than 50%. I don’t think this is the bottom anymore.”
The expectation is now for another dip into those levels or a more bearish reaction. Liquidity is not hitting the crypto market the way it was supposed to. This aligns with analysis from last year suggesting a good bottom in altcoins around November or December. The recent bottom may have come too early, and another step lower is anticipated. Consequently, the stance on Ethereum is no longer bullish, and bearish moves might even be engaged across a lot of these altcoins as the new cycle starts today.
FX Deep AUDNZD shadow peg
AUD/NZD: The Unspoken Peg at 1.15
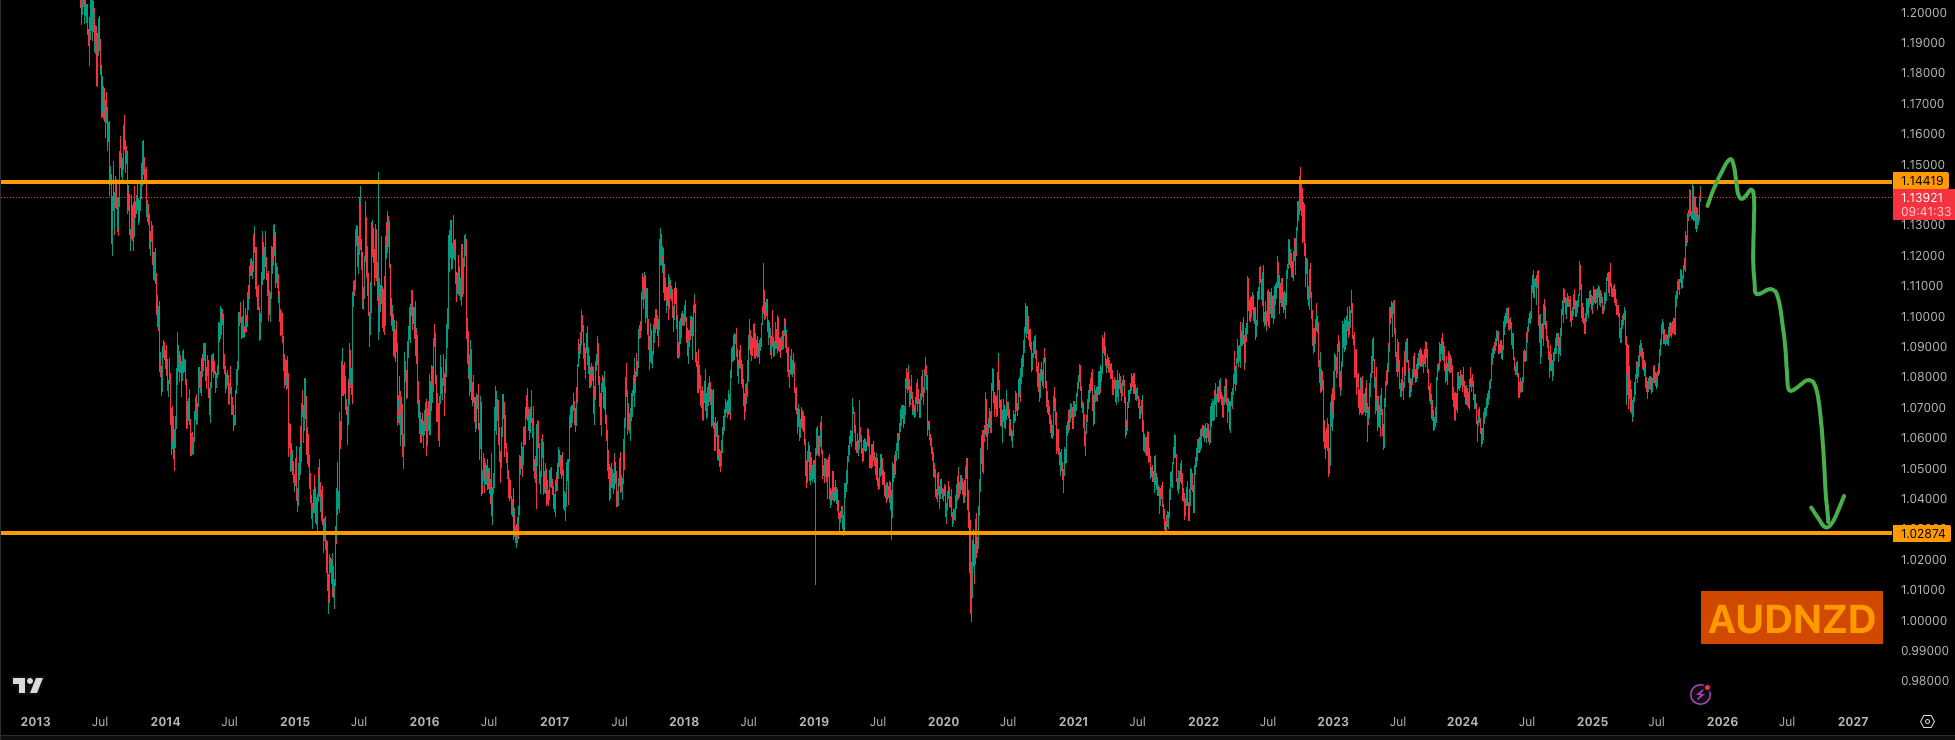
A very interesting long-term setup is developing on the cross pair AUD/NZD. This chart is entering levels where it has historically been repelled back down. Over the better part of a decade, the price action seems capped, suggesting an “unspoken peg” or “shadow peg” implemented by the central banks.
The reason for this peg is trade stability between Australia and New Zealand, which have significant trade volumes. New Zealand, a major exporter of dairy and meat products (particularly lamb and sheep), benefits from stable pricing and potentially a devalued currency to make its exports cheaper.6 Central banks operate at the margins—at the highs and the lows—to maintain this stability, which is why FX pairs often exhibit strong mean reversion.
AUD/NZD Trade Setup and CPI Impact
The expectation for AUD/NZD as it approaches the resistance zone involves two scenarios:
Primary Path: A stab above the 1.15 level, followed by a cascading move down.
Secondary Path: The market never reaches 1.15, meanders, and then comes down.
This is a longer-term timeframe trade. Recent data supports the move toward this resistance. Australian CPI data came in hotter than expected, making it difficult for the RBA (Reserve Bank of Australia) to cut rates.7 This strengthens the AUD in the short term, helping it rise toward the 1.15-1.16 levels where the short engagement is planned.
In response to a question about buying NZD over AUD given the weak NZD economy: “I don’t think the economy had anything to do with these moves. I think this is fully driven by the liquidity from these central banks.” The strategy relies on the historical pattern of intervention at these extremes, not meddling in the middle.
The Rare Earth Trade War: Australia as the Clear Winner
Recent strength in the Australian Dollar across the board (AUD/JPY, EUR/AUD, GBP/AUD) began precisely after China announced restrictions on rare earth mineral exports to the US.
The market reaction strongly suggests that Australia is viewed as the alternative supplier. “Australia has got massive, I’m telling you, unimaginable amounts of rare earth minerals... They can easily supply the US.” This geopolitical tension has positioned Australia as the clear winner in the rare earth trade war. The impact was immediate, with GBP/AUD going down 800 pips.
However, there are nuances. While Australia has the minerals, processing them is toxic and energy-intensive. It is unclear if Australia has developed the necessary refining capacity. Viewers from Australia (Sue and David Jackson) confirmed that refining infrastructure is lacking and noted political challenges. Despite this, the potential for billions in revenue means Australia could rapidly develop this capacity if needed. “Building a factory takes months... Australians move pretty quickly and pretty aggressively” when they want to get things done. The macro signal is clear: the market is buying AUD based on this potential.
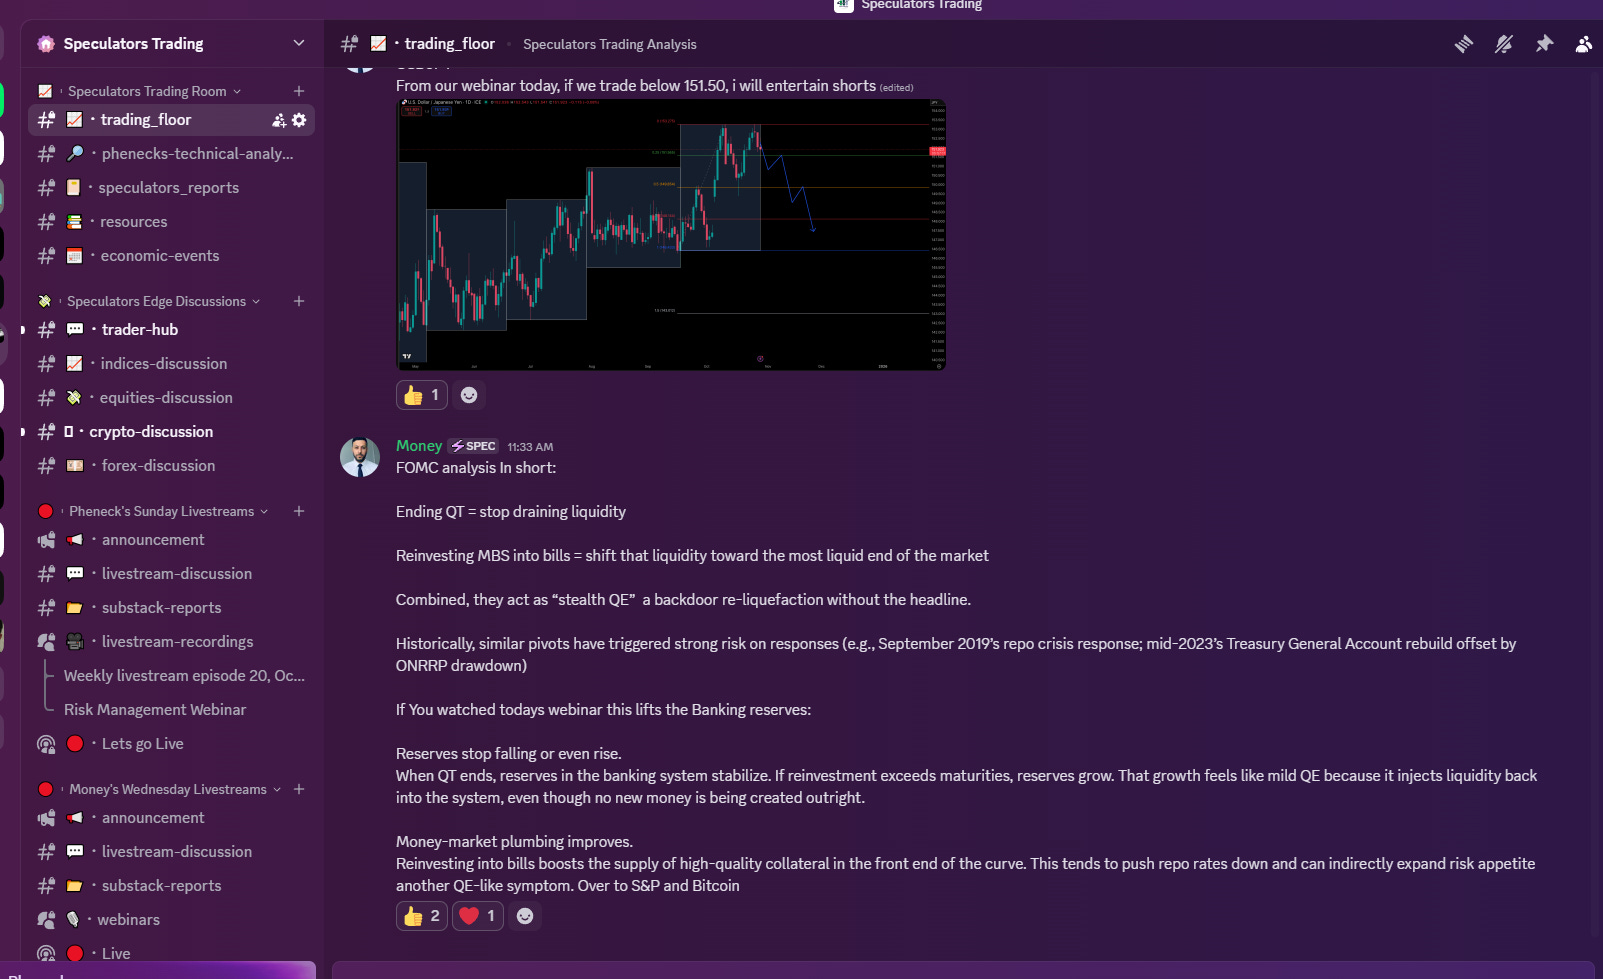
USD/JPY: The Massive Gap That Mathematically Must Close
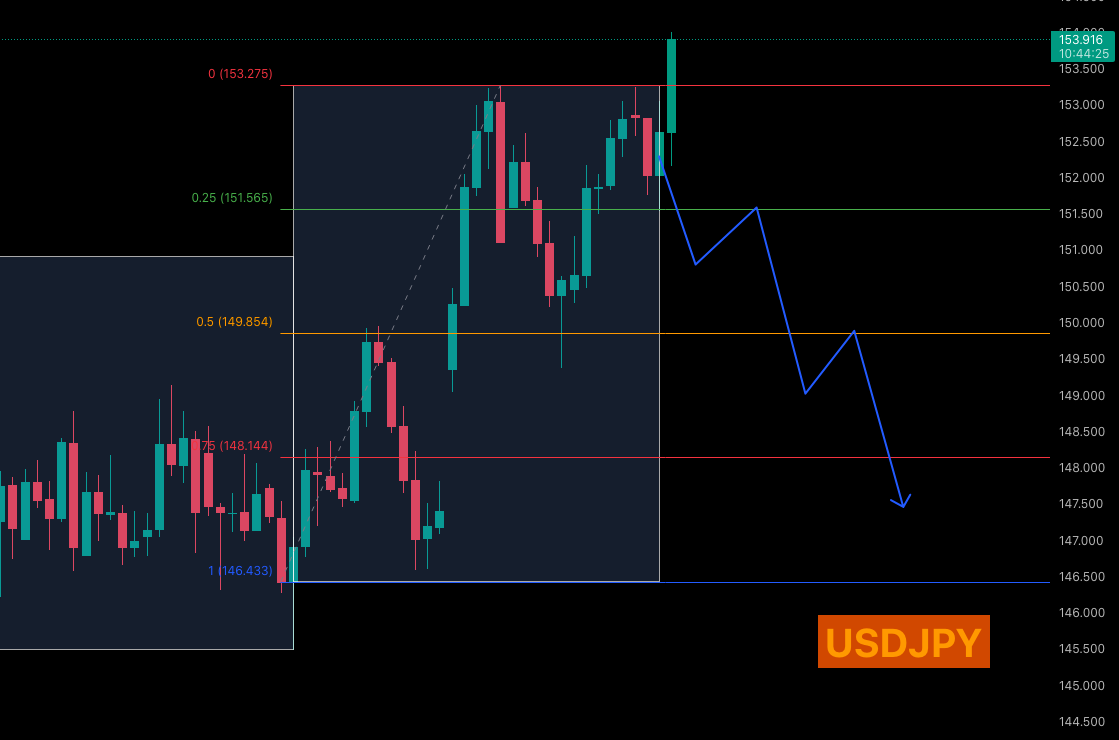
USD/JPY presents a critical situation involving a massive gap left open after Takaichi was in the running for prime minister in Japan. The gap is from 147.33 to 149.
In foreign exchange, gaps tend to close 95% of the time. This contrasts with equities, where gaps can remain open because the value is tied to the company’s fundamentals (balance sheet, market share). In FX, a gap represents an inefficiency that mathematically doesn’t make sense, as the pricing mechanism between countries doesn’t allow for a physical gap. “If you are living in Japan, you’ve got yen. Your prices didn’t really gap anywhere, did they? ... It’s a type of arbitrage.” Gaps in FX always close.
Two Scenarios for the JPY Gap Closure
The closing of this gap will happen through one of two major macro events, and identifying which one is crucial for trading the broader market:
Massive Dollar Dump: The Fed starts a massive liquidity injection or QE. The dollar gets devalued, closing the gap. In this scenario, EUR/USD, GBP/USD, and AUD/USD would all go up.
Massive Risk-Off Event: A major risk event (e.g., trade deal collapse) causes crypto and equities to get hurt. The Yen surges massively as a safe haven, causing USD/JPY to drop and close the gap. In this scenario, EUR/USD could also go down.
Traders should not front-run this move, as it exposes them to undue risk. The setup requires waiting for one of these catalysts to materialize. The Bank of Japan meeting tomorrow may also provide indications.
USD/JPY Six-Week Cycle Short Setup
On a probabilistic level, it is highly likely this gap is about to close. The strategy using the new Six-Week Cycle is to wait for confirmation of one of the two scenarios and then engage short methodically:
Wait for a dip below the 25% level (around 151.50).
Engage further on a dip around the 150 level.
Target the open gap below 149 down to 147.33.
This setup must be coordinated with the overall risk environment due to the inverse correlation between USD/JPY and EUR/USD, unless a contagion effect (risk-off) drives all flows into the Yen.
Equities, Commodities, and Indices Outlook
The outlook for indices remains bullish, driven by strong liquidity, but current positioning at all-time highs suggests caution for entering new long-term positions.
German DAX at ATHs: A Worrying Divergence with SAP
The German DAX is currently sitting at all-time highs.8 A key component driving the DAX is the German equity SAP.9 Recently, SAP has not performed as expected and is lagging the DAX’s rally.
This divergence is worrying. If SAP does not pick back up, the DAX will have a very tough time maintaining these all-time highs.
The Hidden Economic War: EUR/USD Impact on German Exports
The German economy is slowing down, significantly impacted by a higher EUR/USD. The German economy is export-oriented (cars, machinery).10 When the Euro appreciates, it makes German exports less competitive.
*”Underneath the surface, and this is not talked about, Biden has started a war... on Europe. He started letting the dollar depreciate [when he took office].” * Every 100-200 pip increase in EUR/USD per quarter decreases the German economic surplus by over a billion Euros. Coupled with tariffs, the German economy is getting gutted due to these pricing pressures. Unless EUR/USD comes back down, companies like SAP will continue to struggle.
DAX Six-Week Cycle Setup
In the previous cycle, the long trade on the DAX was highly successful. However, the new Six-Week Cycle does not inspire the same confidence. The DAX is expected to be choppy, favoring short-term scalpers and day traders for the time being.
From a position perspective, interest in buying the DAX will return once the U.S. equity situation is resolved after the QRA. The strategy for the next cycle, once the timing is ripe, involves layering longs on dips:
Buy a dip toward the 50% level (23,650).
Target a new all-time high towards the 25,000 level.
S&P 500 and NASDAQ: Bullish but Overextended
The S&P 500 and NASDAQ continue to be bullish, entering the Federal Reserve meeting at all-time highs.11 However, they are trading right at the top of their Six-Week Cycle levels.
This positioning does not allow for effective position building. “Our position building strategy works really well once you’re actually at levels when nobody wants to buy it... When it’s at levels where it’s at all-time highs, everybody wants it... That means the entry is just terrible.”
For position trades, we await lower levels. Discount levels for engagement on the NASDAQ would be 25,000 or 24,500. For now, the best approach is through intraday trades and the inside bar trades that Fennec shares.
Gold Takes a Backseat
The stance on Gold is currently neutral. The top created around 4,400 is proving to be a difficult level to punch through. This resistance is likely due to China pulling back from buying. The high coincided with the shift in market dynamics following China’s trade war announcement (Gold down, AUD up, S&P 500 bottomed).
From a macro perspective, the best trade (long from 3,400) has already occurred. While that position remains open and well in the money, there is no interest in buying or selling at current levels.
Oil’s Resilience and the Next Leg Higher
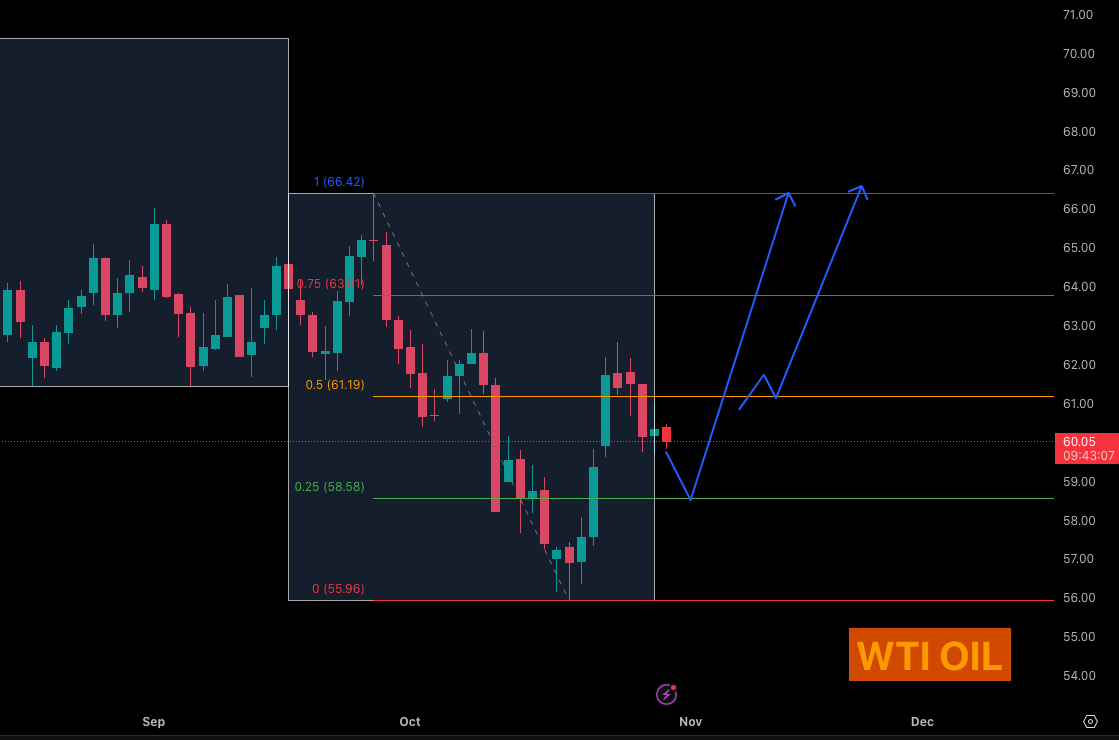
The outlook for oil going forward is higher. It is building resilience and setting up well within the Six-Week Cycle. While the global economy may not be in a full upswing yet, this is often the best time to long commodities—before the confirmation is priced in.
Oil is currently trading at $60.45. The Six-Week Cycle setup is as follows:
Primary Entry: Buy a dip towards $58.50. Stop loss underneath $56.
Secondary Entry: If the dip doesn’t occur, entertain a higher entry around $61.
Target: A breakout towards $66.
This move higher in oil bizarrely implies that inflation will pick up down the line, which will be an issue for the Fed later.
Community Updates and The Elite Squad
The Speculators Trading Discord community continues to evolve, refining its structure to provide maximum value to traders of all styles and experience levels.
The Speculators Trading Philosophy
The core philosophy of the community is straightforward: “To make as much money as possible for our members as we can over time.” This is measured by the improvement in members’ PNL, alongside skill development and learning. The goal is to support members’ trading journeys through shared analysis, levels, and psychological insights.
Navigating the Discord Structure
The Discord structure is designed to cater to different needs:
Webinar Access: Concise access to Money Wednesday and Sunday live streams, reports, and recordings for those who need compressed information.
Welcome Channels: Rules, ethics, philosophy, and a ticketing system for technical or membership support.
Speculator’s Trading Rooms:
Trading Floor: Focus on macro perspectives and trading psychology.
Technical Analysis: Charts, liquidity levels, and trade setups (where Fennec posts quite a lot).
Resources: Essential materials explaining core methodologies like the Six-Week Cycle and London fix.
Discussions:
Traders’ Hub: A safe space for general discussion, sharing wins, and community interaction (even cooking).
Asset-Specific Channels: Dedicated spaces for Indices, Equities, Crypto, and Forex, allowing members to share posts and get second opinions from experienced traders (from beginners to 20-year veterans).
Introducing The Elite Squad
A new initiative, The Elite Squad, has been introduced to recognize community members who have been exceptionally consistent, driven, and “too good to ignore.” These members have earned an ascension and their own space to share their specialized techniques without dilution.
Travis (Australia): Specializes in altcoin rotations, providing valuable content and upcoming live streams in his dedicated room.
Momentum Raf: Sharing valuable content and insights derived from his trading growth.
This initiative encourages sharing and teaching, recognizing that “the more you share and the more you teach, the more you end up learning yourself as well and the more you end up getting better.”
For members who are busy, the Substack summaries provide a quick way (five minutes of reading) to stay up to speed with the market analysis and trades without needing constant engagement.
Key Takeaways and Outlook
As we navigate this critical juncture, defined by the FOMC meeting today and the upcoming QRA on November 3rd, the market landscape is complex. The Federal Reserve is committed to an easing path, supported by stable inflation (2.28% break-even) and weak commodities. However, the draining of Bank Reserves presents a significant near-term risk, tightening commercial liquidity and potentially leading to a market “jolt” before the Fed intervenes.
The Six-Week Cycle remains the essential tool for mechanical execution, providing clear levels for engagement once the macro direction is established. High-probability setups are emerging in FX, notably the short opportunity on AUD/NZD at the 1.15 “peg” and the imperative closure of the USD/JPY gap at 147.33, which will signal the next major macro trend (dollar devaluation or risk-off).
Caution is warranted in the crypto space, as the conviction on Ethereum’s $3,500 bottom has dropped below 50%, suggesting another leg lower for altcoins. Equities (S&P 500, NASDAQ, DAX) remain in a bullish “steam train,” but are overextended at all-time highs, making current levels poor entries for position trades. We await dips, potentially catalyzed by the QRA, to build long positions.
As we head into November, watch closely for the QRA’s impact on liquidity and the resolution of the USD/JPY gap. These factors will dictate the strength and sustainability of any year-end rally.
What’s your take on these setups? Are you preparing for a liquidity injection or a risk-off event? Share in the commentslet’s discuss strategies. Subscribe for more market breakdowns!
Disclaimer: This isn’t financial advice – just market musings from the charts. Always do your own research.
If you enjoyed this deep dive, please share it with fellow traders!
Trade Strong
Miad