

Liquidity Tsunami Incoming: Navigating Rate Cuts, Q4 Seasonality, and Explosive Setups in Gold, DAX, and Tech

📝 Executive Summary
In our latest addition of navigating the financial markets, we dissect the recent Non-Farm Payroll (NFP) data and its profound implications for liquidity, rate cuts, and the trajectory of risk-on assets heading into Q4 2025. The recent September NFP data revealed a mere 22,000 jobs added, significantly missing the 75,000 expectation. While this signals potential trouble for the real economy, it is crucial to understand a fundamental fallacy: Markets are not the real economy. The financial economy runs parallel but operates under different rules, primarily driven by liquidity.
While the NFP report is "horrible data" for the economy, it actually caused a bullish push on risk-on assets at the time of NFP release, because it solidifies the expectation that the Federal Reserve will cut rates in the upcoming September meeting.
This analysis focuses on the massive influx of liquidity poised to hit the markets. Building on the previous stimulus the "big beautiful bill" inflating the debt by another $5 to $6 trillion we now anticipate further stimulation from the Fed. Every interest rate cut acts as a direct injection into the financial markets, fueling rallies in risk-on assets. We are maintaining a staunchly bullish outlook based on this liquidity premise. Historically, while rate cuts might cause brief tumultuous periods such as the October 2018 reverse market repo crash (a 20% drop) the subsequent liquidity support (rates dropping from 3% to zero) fueled a rally that lasted for 428 days. The focus must remain on this long tailwind of liquidity, dismissing noise about recessions that have failed to materialize despite narratives around tariffs or geopolitical conflicts.
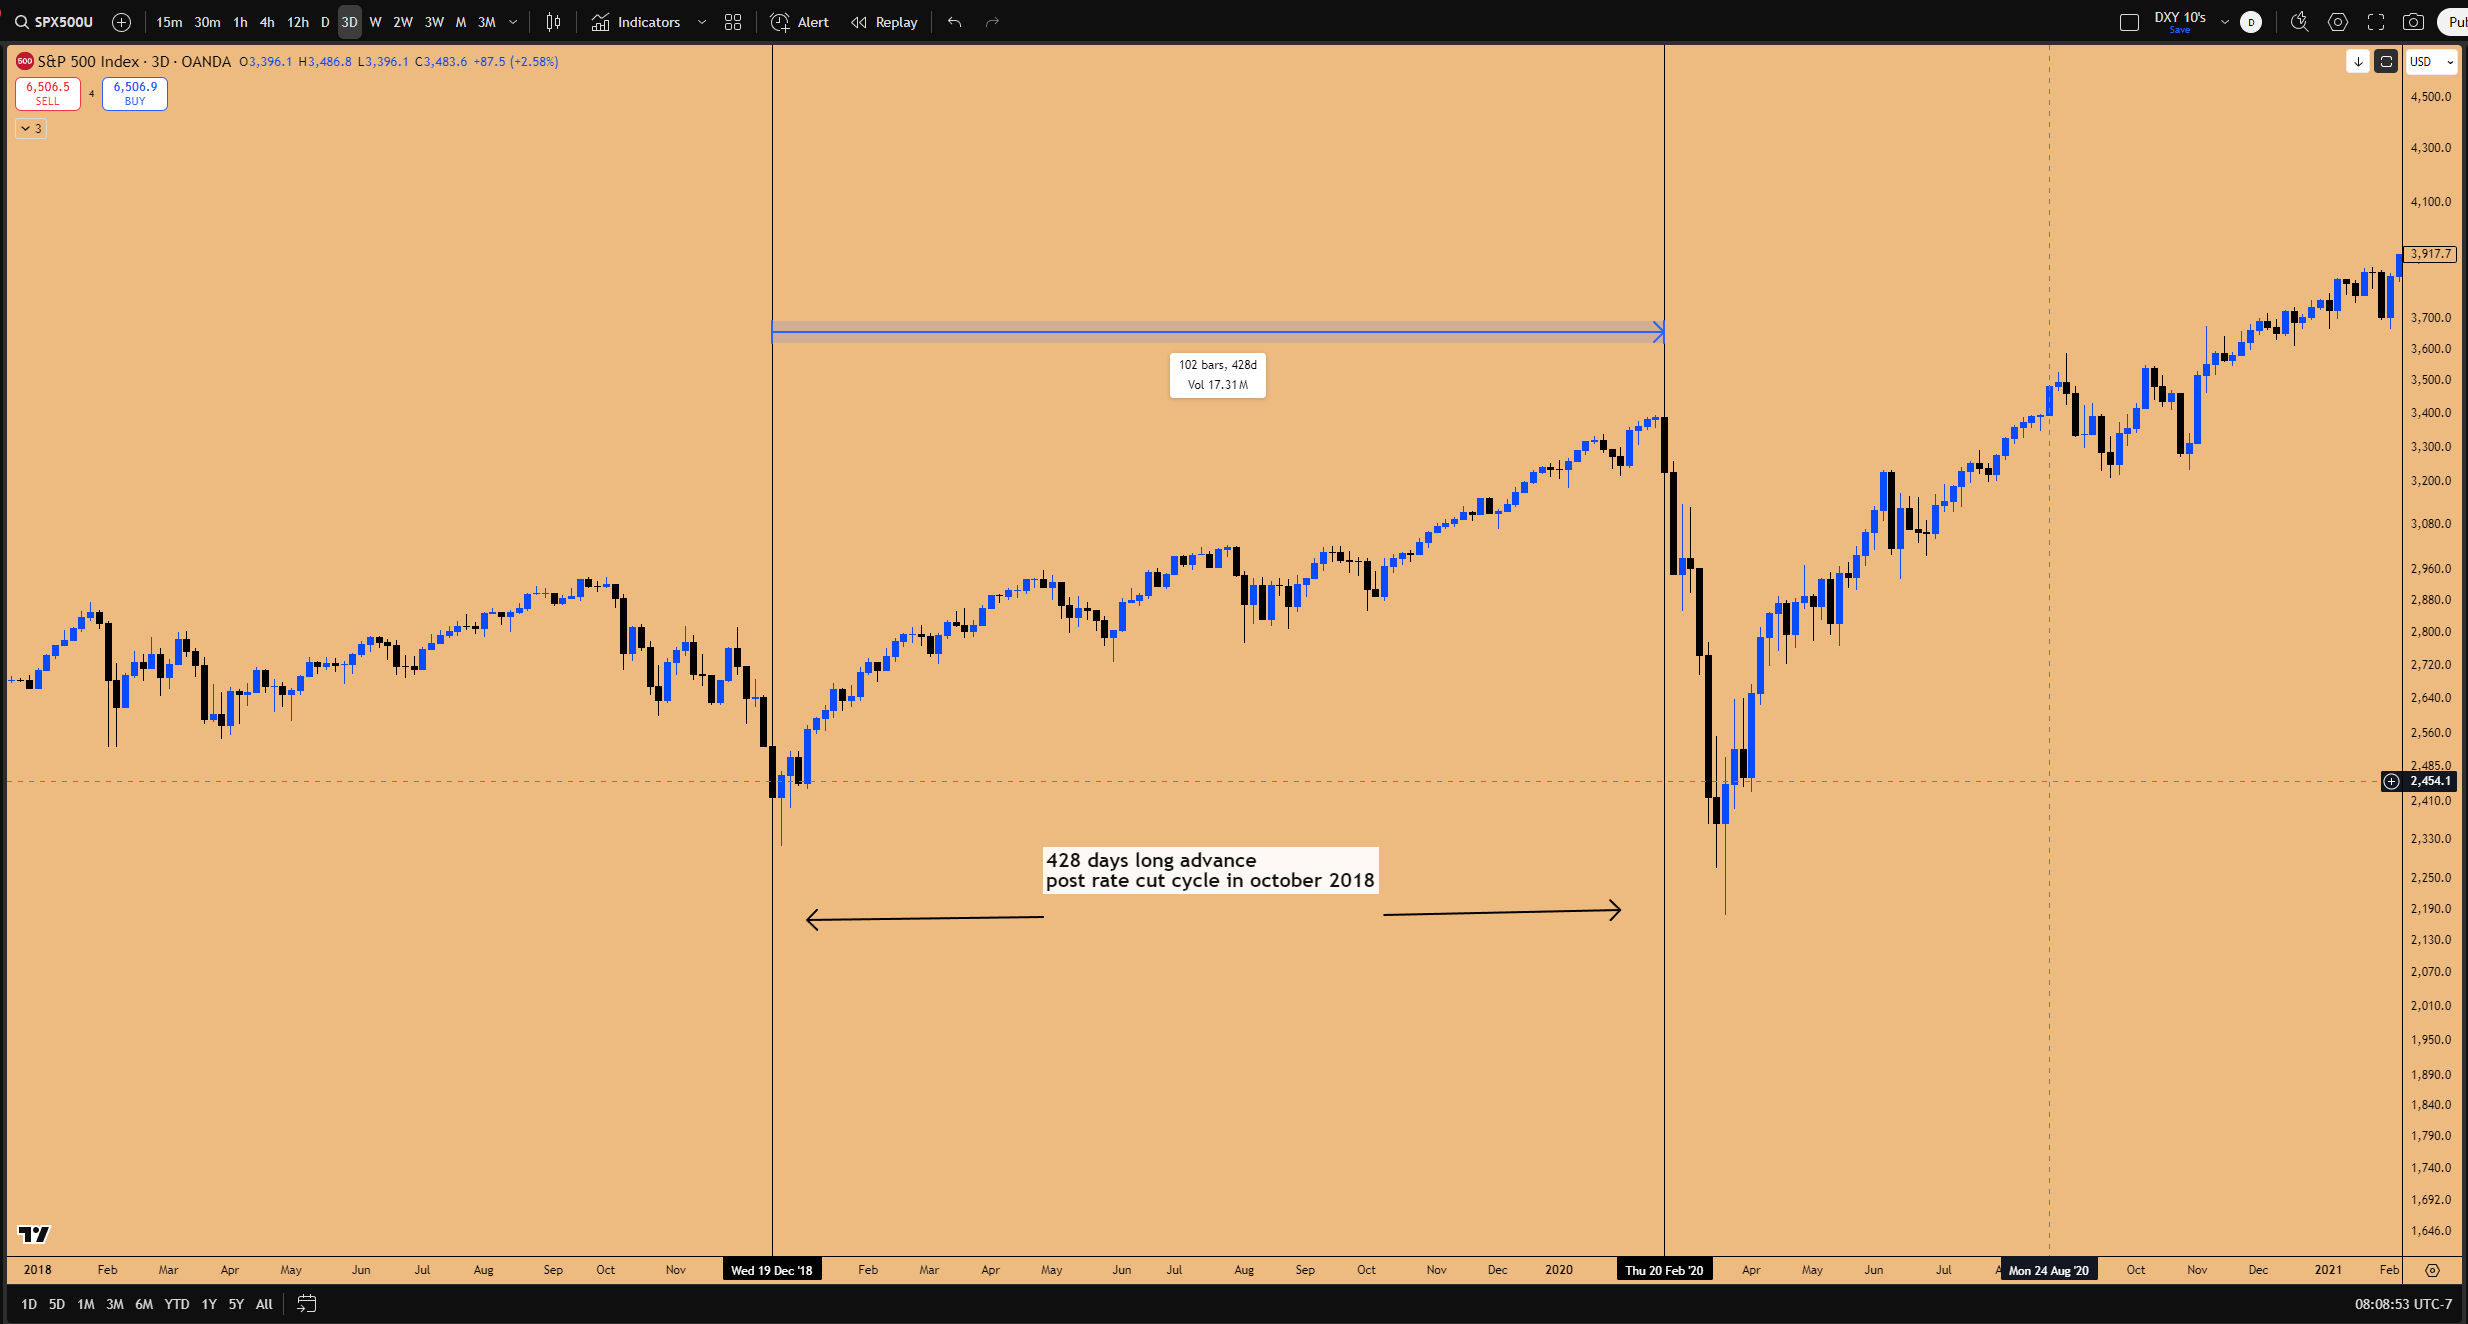
Figure 1: 2019-2020 rally post rate cut cycle of 2018.
Furthermore, we are entering a seasonally strong period. October, November, and December are historically the strongest consumer spending months due to US consumers preparing for the holiday season festivities. Seasonality charts indicate that markets generally move higher post-September, driven by robust consumer spending that directly benefits the Magnificent 7 companies (Apple, Amazon, Google, NFLX, MSFT etc.), which in turn lifts the heavily weighted NASDAQ index.
Technically, several explosive setups are emerging. Gold is undergoing a historic breakout from a rare double inside two-month candle, a pattern that historically yields 18-20% returns. This puts a $4,000 target in play. The German DAX is presenting perhaps the highest probability trade setup, forming a potential triple inside three-week candle within a massive consolidation. Driven by its correlation with SAP (the Microsoft of Germany), which is now hitting a major support zone, the DAX is poised for a 10-15% breakout, targeting 26,000. In US equities, Microsoft (MSFT) is flashing a textbook inside monthly candle failure. Utilizing cross-market correlation with Oracle (ORCL) and understanding its symbiotic relationship with the NASDAQ, this setup offers a high-conviction swing long opportunity targeting new all-time highs, with options plays potentially yielding 100-300% returns if the setup were to play out.
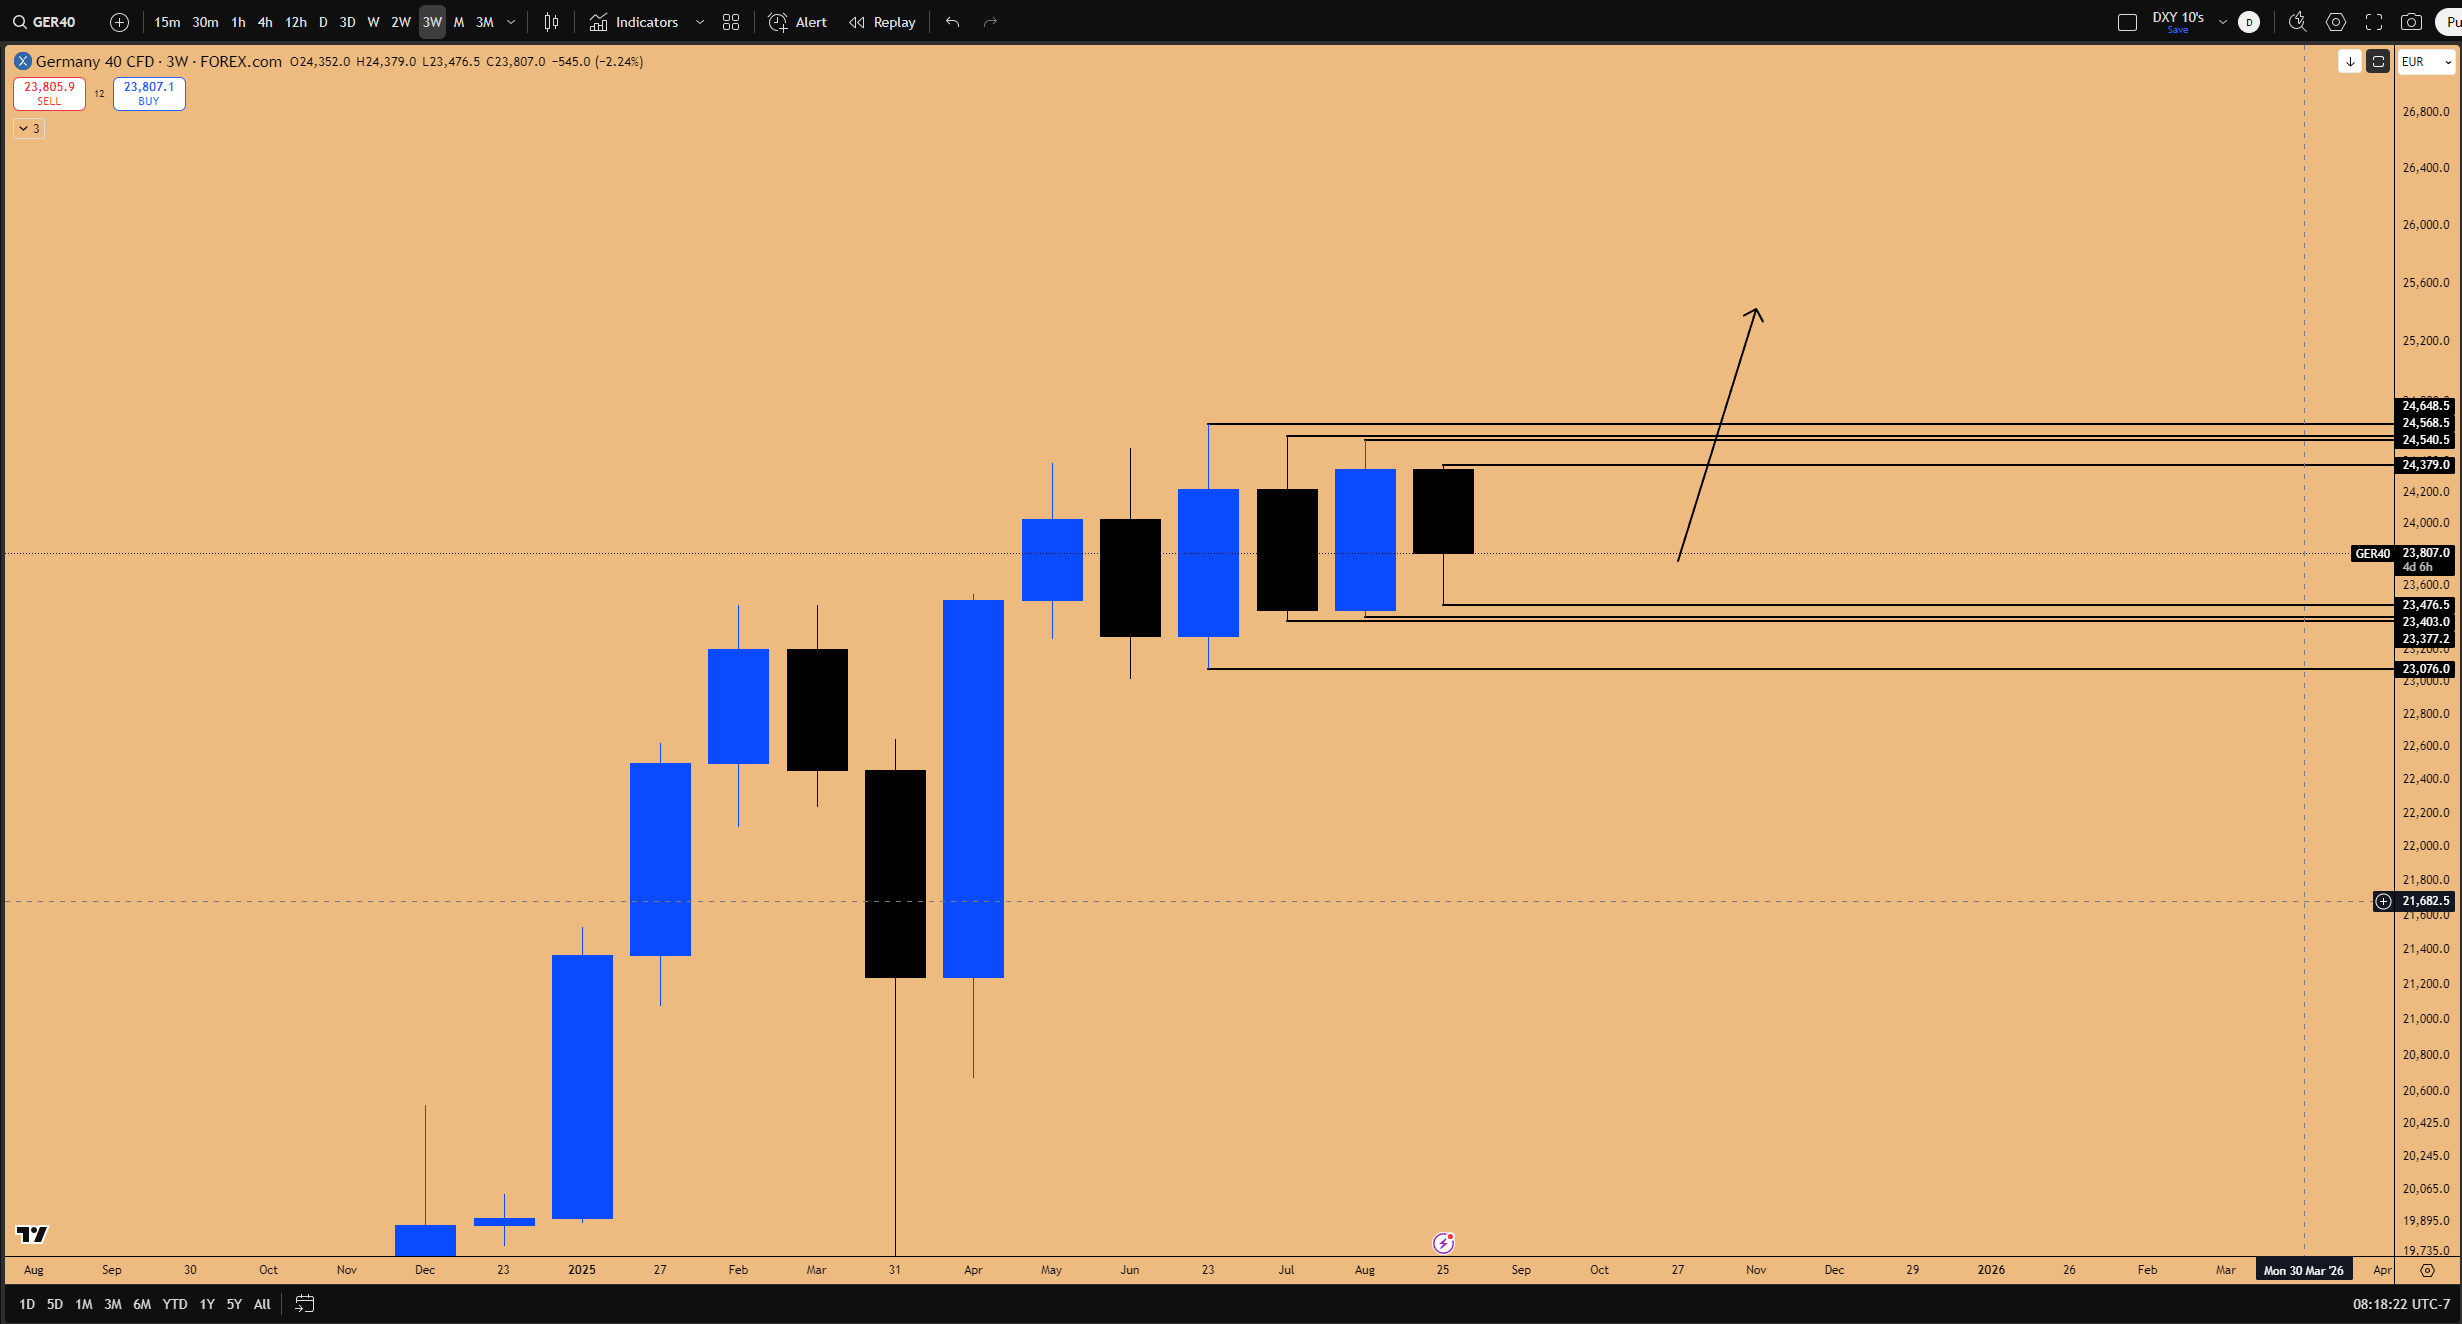
Figure 2: Triple Inside 3-week candle pattern on DAX
In the cryptocurrency space, the outlook is more cautious in the short term. Bitcoin (BTC) is showing an inside monthly candle failure pattern but lacks follow-through. While a short-term bounce to fill the IBIT open gap at 66.25 is anticipated, the overall structure remains corrective until a market structure shift back to bullish structure occurs. Ethereum (ETH) is forming a critical inside three-week candle, taking precedence over weekly patterns. Key long opportunities exist at the untested 4,138 SR level (CME charts) and a deeper pullback toward 3,782.5, with a long-term target of $10,000 by 2026.
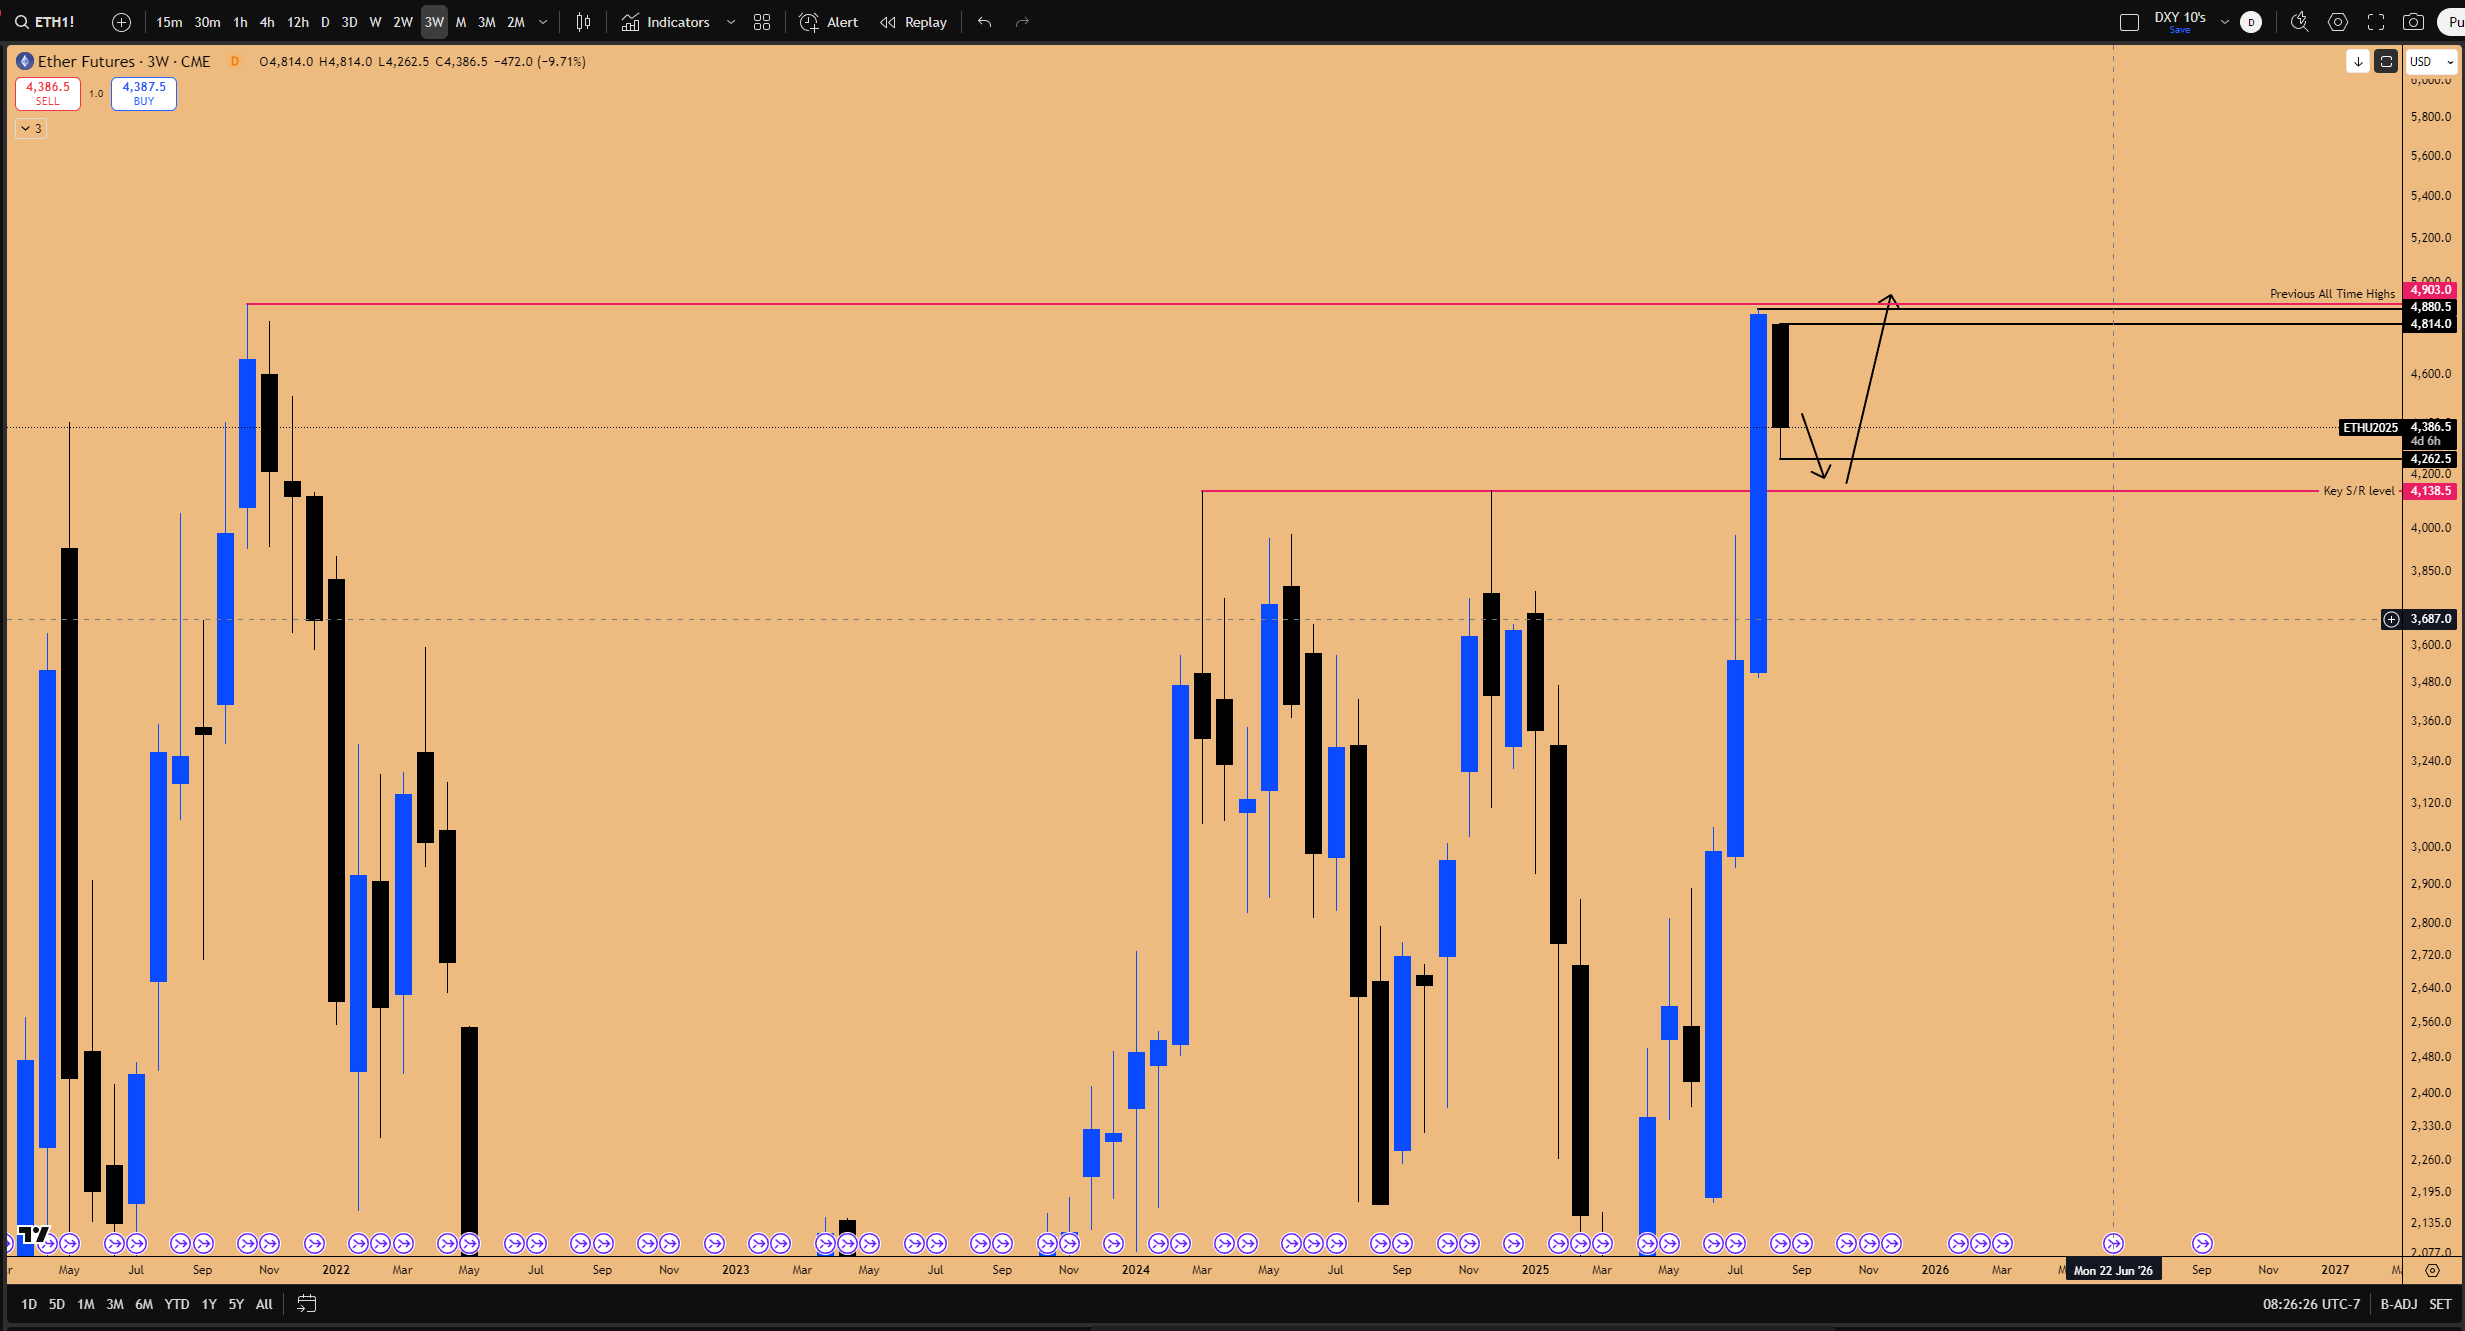
Figure 3: Inside 3-week candle pattern in play for ETHUSD CME futures
As we approach the end of Q3, the market environment is expected to become "absurdly stupid" due to liquidity going "bonkers." Positioning for Q4, which is anticipated to be one of the best investment periods, requires dry powder and strategic entry points, which will be detailed in the upcoming Quarterly Outlook Report on September 30th.
Key Takeaways:
Liquidity is King: Bad economic data (like the 22k NFP print) is bullish for markets as it guarantees Fed rate cuts and increased stimulus.
Historical Precedence: The 2018 rate cut cycle led to a 398-day rally despite an initial 20% shock.
Q4 Seasonality: October through December are seasonally strong due to robust US consumer holiday spending, benefiting the Magnificent 7 and the NASDAQ.
Explosive Setups: High-conviction long setups are identified in Gold (targeting $4,000), German DAX (targeting 26,000), and Microsoft (targeting new ATHs via inside monthly failure).
Crypto Caution: BTC remains sideways with key support at 107,000; ETH is forming a critical 3-week pattern with key entries at 4,138 or 3,782.5.


🌐 The Liquidity Paradigm: NFP, Rate Cuts, and Debunking Recession Fears
The market's reaction to the recent Non-Farm Payroll (NFP) report highlights a critical distinction that every trader must understand: the financial markets and the real economy are two different things. While they run parallel, the drivers for asset prices often diverge significantly from the health of the underlying economy. “If you have not figured this out on what has driven the markets in past five or six years, then you are new to trading/investing. This will be an eye opener for you.”
The NFP Data and Market Reaction
The September NFP data was objectively poor, showing only 22,000 jobs added, vastly underperforming the expectation of 75,000. This has led to concerns about entering a recession because the NFP report was poor for August, and September. The immediate sentiment might suggest this is bad for the economy and therefore bad for the markets. This is a fallacy. If you observed the market reaction when the NFP data came out, there was a bullish push on risk-on assets, even though the data was horrible for the real economy.
The reason for this counterintuitive push is that the “horrible data” solidifies the fact that the US Federal Reserve will be forced to cut rates in the upcoming September meeting (next week). Rate cuts, by themselves, are stimulatory in nature. The markets were celebrating the impending influx of more liquidity and more stimulus required to support the economy.
The Incoming Liquidity Tsunami
This expectation of new liquidity builds upon the substantial stimulus already present in the system. We previously discussed the anticipation of a "big beautiful bill" which would inflate the debt by another $5 to $6 trillion. When that much money is added to the economy, it flows through the financial markets and is used as leverage to pump risk-on assets a phenomenon witnessed over the past four or five months.
Now, not only do we have that existing liquidity, but we anticipate even more from the Fed. Using the weak economic data as justification, the Fed will cut interest rates, and every cut is a stimulation injection into the financial markets. This dynamic is the foundation of the current bullish outlook for risk-on assets. More liquidity means higher prices; this has been the entire base case for the year since the market bottomed.
Historical Context: Lessons from the 2018 Rate Cut Cycle
There is a common misunderstanding that rate cuts historically lead to tumultuous periods for markets. While initial shocks can occur, the long-term impact is overwhelmingly bullish.
Consider the environment when rate cuts began in October 2018. The initial rate cut caused the reverse market repo crash, where the market collapsed by 20%. This forced the Fed to cut even more aggressively, eventually dropping interest rates from 3% all the way to zero.
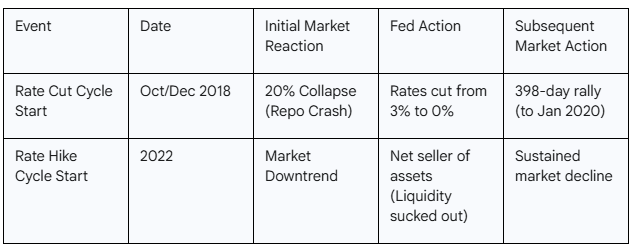
While many market participants focus on that initial 20% collapse and become fearful, they fail to recognize the subsequent outcome. The massive liquidity pumped into the system caused the markets to rally for another 428 days, incurring 38% return on S&P500 during that period. When the rate cut cycle starts, there is a long tailwind of liquidity support. Whether the rally begins immediately or from 10% lower, the duration basis shows that from the start of the cuts in December 2018 until January 2020, the markets were going up for over a year.
Conversely, when the rate hike cycle started in 2022, the markets trended down because the Fed was the net seller of assets (eg. Mortgage-backed securities), sucking liquidity out of the system. This demonstrates how the financial system is wired: it does not matter how bad the economy might look if there is more liquidity coming into the system.
Cautioning Against Recession Narratives
Throughout the recent past, many narratives have predicted recessions based on various triggers: tariffs, World War III, the Ukraine-Russia conflict. None of these have transpired. It is crucial to caution against these narratives. Anyone who made claims of an impending recession based on these factors and was proven wrong should be recognized as noise. These fear or doom narratives often aim to get you to sell your assets and do not help in navigating the financial markets.
Even now, with the economy looking weak, these narratives often neglect the other side of the equation: the liquidity pumps which will be opened to send risk-on assets higher in order to support the economy. It is your job to evaluate the entire information landscape, focusing on the overriding power of liquidity flows.
🍁 Q4 Seasonal Tailwinds and the Power of the US Consumer
While the economic data suggests weakness, we must look forward to the upcoming months. October, November, and December are, economically speaking, the strongest consumer spending months of the year in the US due to the holiday season.
The Seasonal Push: Historical Performance
Seasonally speaking, the markets generally perform well past September. Looking at the seasonal charts dating back to 2012, the trend from October onwards is generally positive, with 2018 being an outlier. The past three years indicate we are entering an environment that may be supportive all the way to the year-end.
2023 Example: While 2023 was an outlier where the market was grappling with interest rate hikes, the US Treasury stepped in. Yellen increased the Treasury issuance and started supporting the markets, causing a massive rally going into October, November, and December.
2019 and 2021: In these years, September generally turned out to be a correction period. However, once September was over, an inflection point occurred in October, and the markets started going higher, ending the year on a strong note.
2020 (Pandemic and Election Year): This was the year of the pandemic, with massive liquidity pumped into the market. The correction started in September and lasted until October, coinciding with the presidential election month. Come November, the market started picking up and closed the year strongly.
The underlying reason these months October through January/February perform well is the strength of consumer spending. People travel, prepare for holidays (Thanksgiving, Christmas), and engage in massive spending events like Black Friday. A key lesson learned over time is: Do not bet against the US consumer.
Impact on the Magnificent 7 and NASDAQ
When this holiday spending spree occurs, the money flows directly to the major players in the market. Consumers purchase from Amazon; they go to Apple to buy new iPhones; they purchase items from Meta (like Meta glasses); and they use more services from Google.
Most of the Magnificent 7 companies Apple, Google, Microsoft, Amazon, Meta, Tesla, Netflix perform exceptionally well in the last four months of the year because of this consumer spending. As we have discussed previously, these companies are the most heavily weighted in the NASDAQ index. This dynamic is one of the primary reasons why the NASDAQ index performs so well during this period.
🇺🇸 US Equities Outlook: Preparing for the "Blowoff Top"
As we transition into the next phase of the market, armed with the information about the impending rate cut cycle, things are expected to get “absurdly stupid.” Most market behaviors will stop making sense due to one overriding factor: liquidity will go bonkers. This is what blowoff top scenarios look like.
We can expect an environment similar to the current breakout in Gold where it seems to go up every day to materialize in US equities as well. While perhaps not this month, starting from October through November, and extending into January and February, the environment will likely be incredibly bullish.
Quarterly Outlook Preview and Past Successes
A comprehensive session detailing the Q4 2025 outlook will be hosted on September 30th. This Quarterly Outlook Report will provide a 10,000-foot view on which asset classes are best to position into from a portfolio perspective. Checkout our Q3 Quarterly outlook report on how we positioned for this quarter ahead of time.
The last Quarterly Outlook successfully identified key positioning for the current quarter in the NASDAQ. We discussed how to position long right out of the gate when the quarterly open (down candle) was printed, using triggers like inside 12-hour candle failure on NAS100 index.
One notable success highlighted in the previous report was Joby Aviation. We identified that the consolidation was primed for a breakout just prior to the event. Once it moved, it went berserk on the new quarterly candle, delivering a 150% return. Furthermore, the target provided was the yearly R5 pivot. The rally terminated exactly at the yearly R5 pivot, tapping it right on the tick, and has since declined by 40%. Hitting the R5 pivot is often an automatic trigger to enter short after a parabolic move.
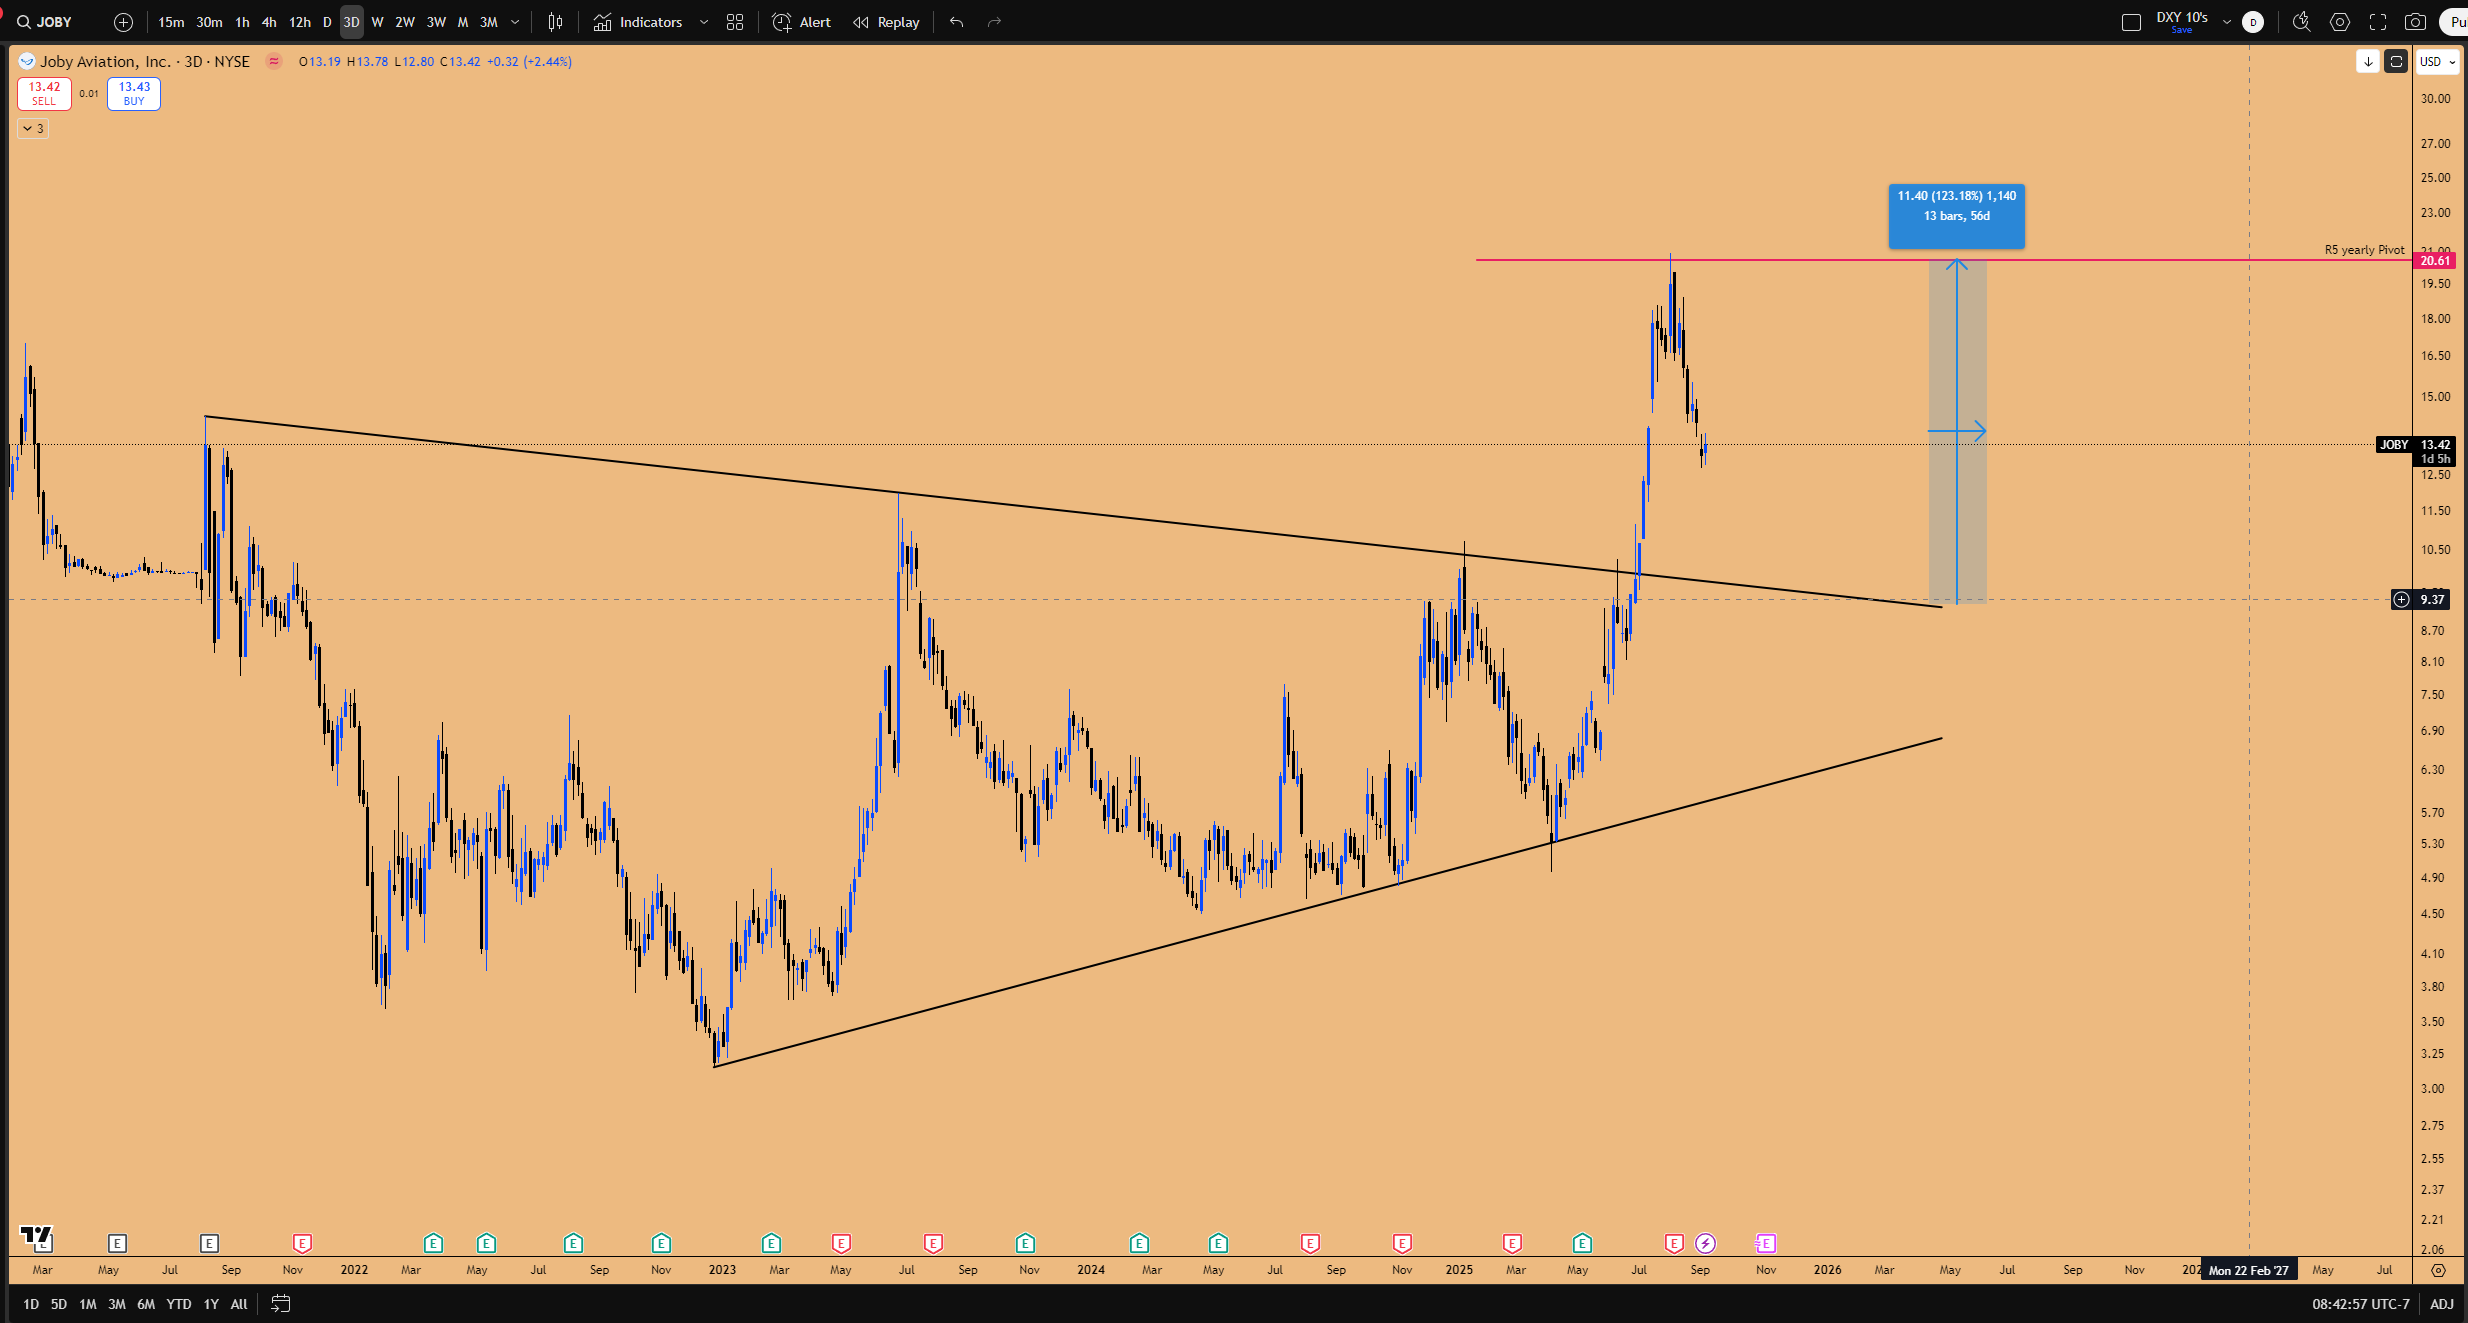
Figure 4: Joby Aviation breakout from macro consolidation
The upcoming report will focus on similar swing opportunities—not day trading—providing a holistic viewpoint on how money will flow from one asset to another over the next three months.
💻 Microsoft and the Software Sector: Analyzing the Inside Monthly Failure
Microsoft (MSFT) is presenting a textbook pattern that offers a significant swing long opportunity, underpinned by its strong correlation with the broader index and cross-market analysis with other software leaders.
The Inside Monthly and 3-Week Candle Patterns
Microsoft has formed a critical inside monthly candle. The ranges in play are:
Inside monthly candle lows: 498.51 and 488.70 (currently being hit).
Inside monthly candle highs: 538 and 555 (not yet taken out).
Furthermore, it is also an inside 3-week candle. The inside 3-week candle’s lows were at 500 and 502. These were taken out last week via a spike down on the daily chart.
Microsoft is the leader the alpha in the software sector. If Microsoft is undergoing a correction, other software companies will suffer as well. However, we also know that Microsoft is a primary leader for the NASDAQ to go higher.
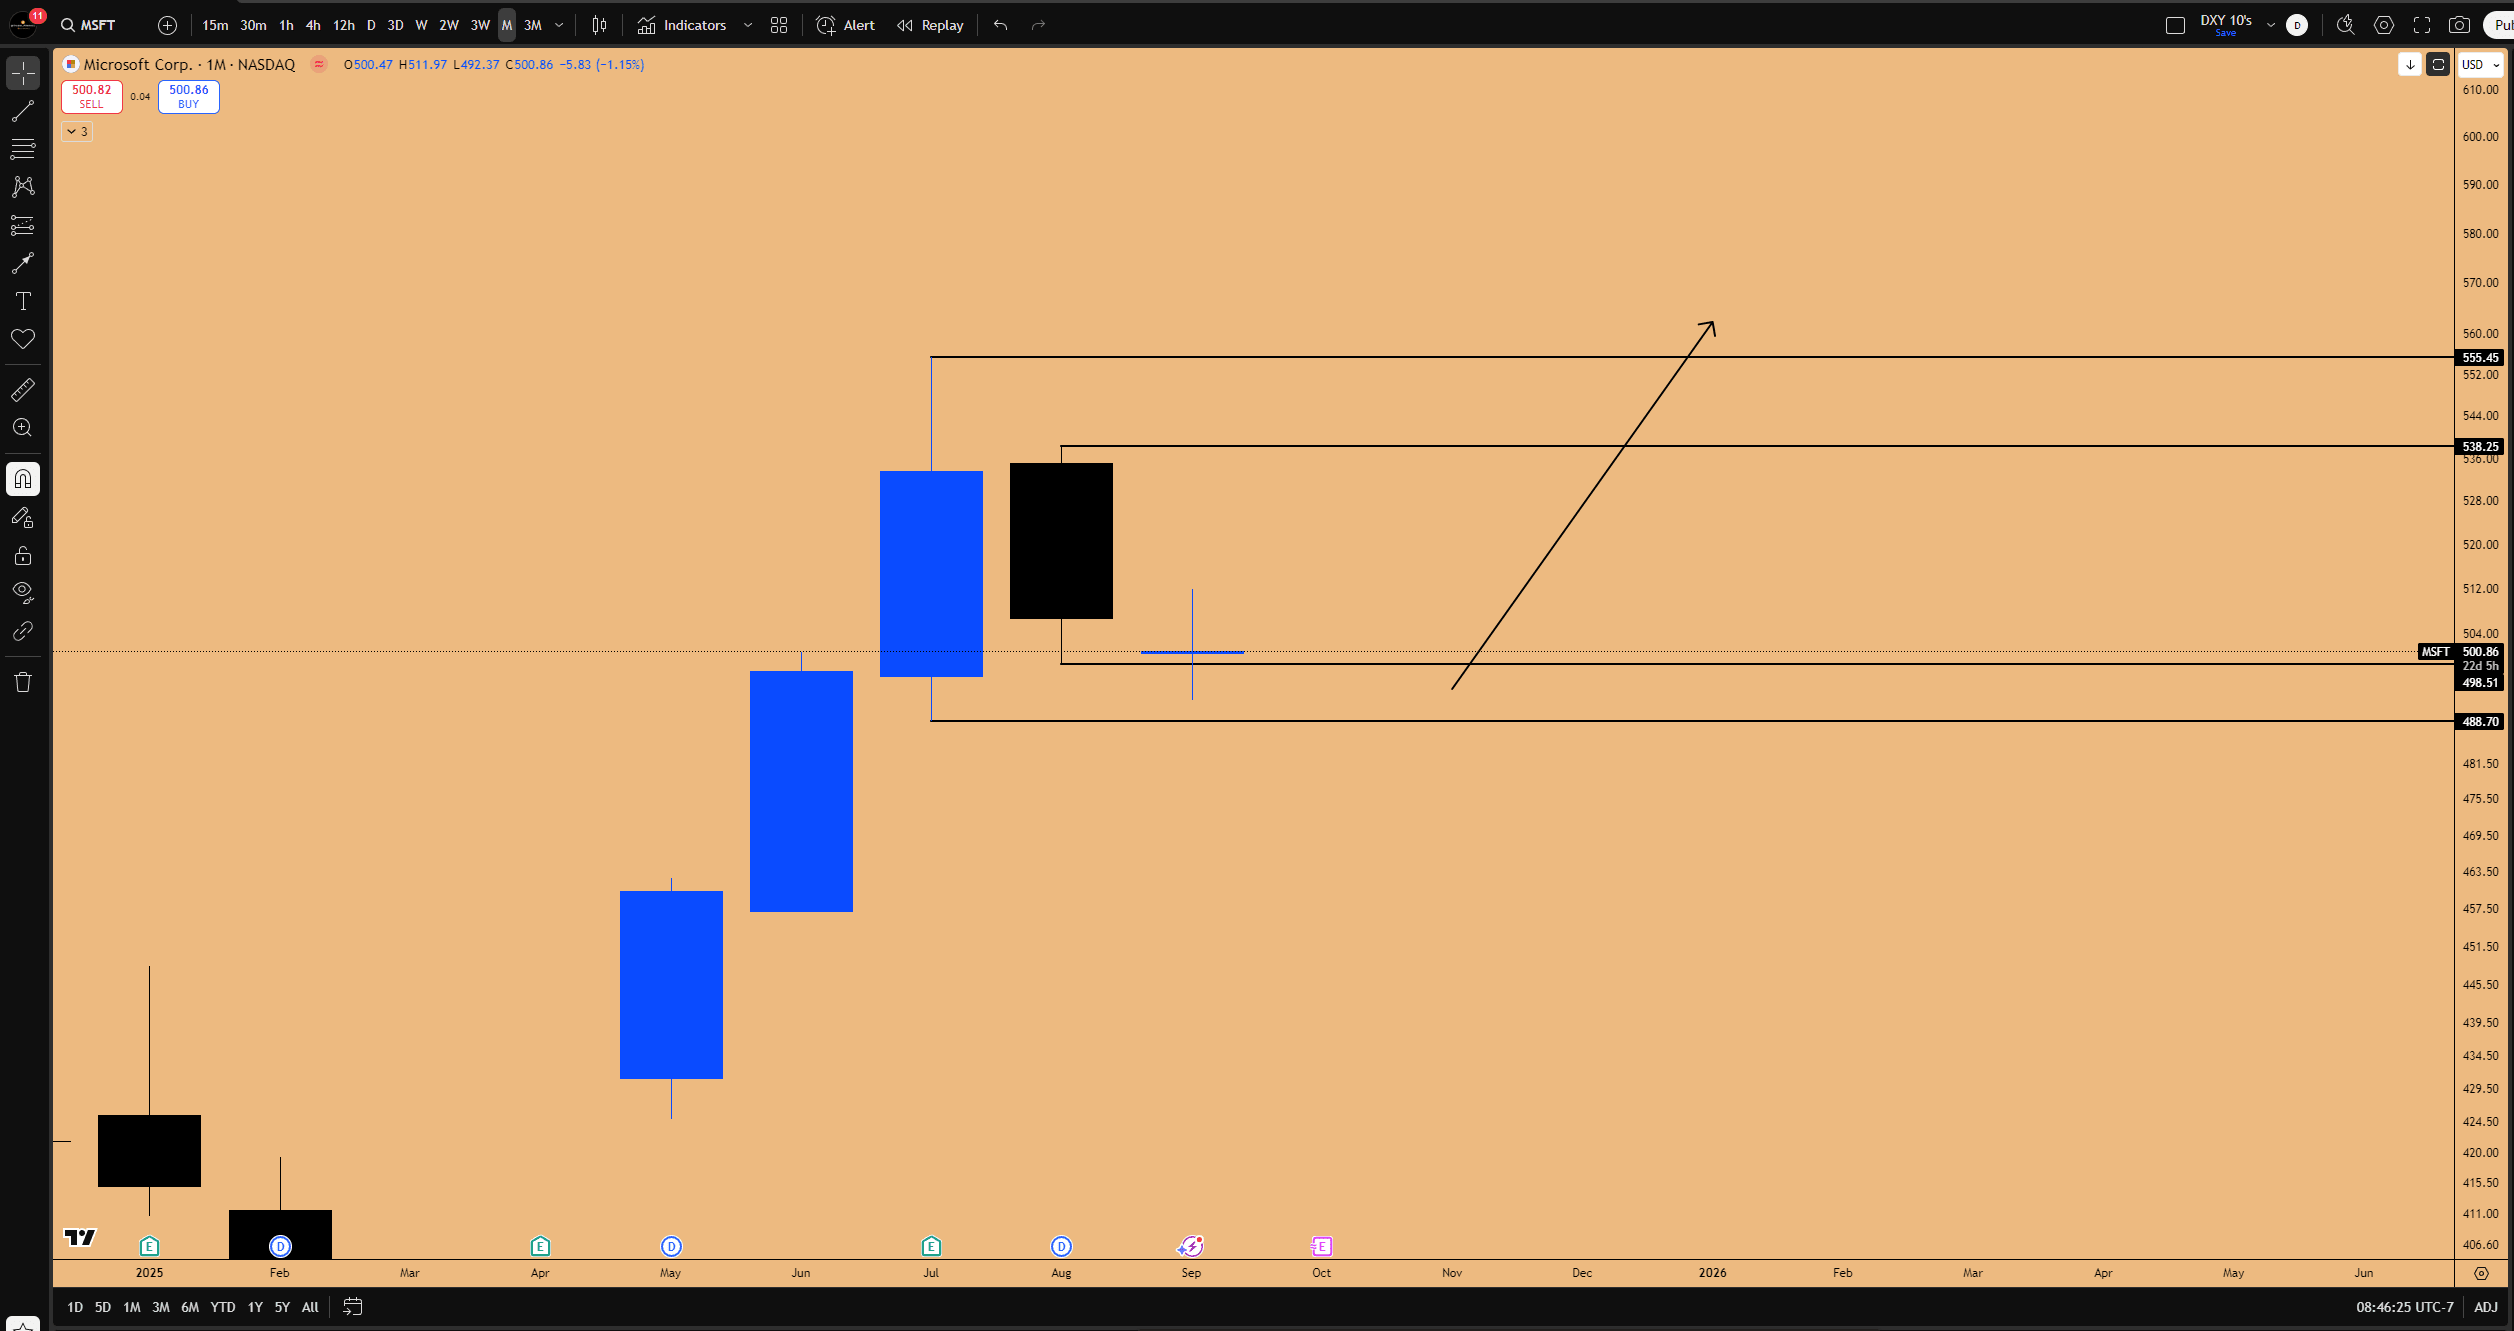
Figure 5: Inside Monthly Candle Failure pattern being triggered in MSFT
NASDAQ Correlation and Liquidity Rotation
If we anticipate the NASDAQ index will undergo a push in the next quarter, supported by the bullish quarterly candle structure, this will provide strong headwinds for Microsoft to go higher. This suggests that the current pattern in Microsoft will close as an inside monthly candle failure, targeting upside price action to take out the 555 swing high in the next month or two.
This conviction led to doubling down on the swing long position, opening LEAP option calls for February 2026 and April 2026 expiration and 550$ strike. This provides enough time to cover the entire Q4 and half of Q1 2026, allowing the quarterly structure to solidify.
Microsoft and NASDAQ move in sync. Historically, anytime a major bottom or top gets printed in the NASDAQ index, it is because Microsoft has printed it. Currently, Microsoft is undergoing a pullback, but NASDAQ is punching higher. This divergence is due to liquidity rotation into other companies, such as Apple. Since the top in Microsoft on July 20th, Apple has been outperforming while Microsoft underperforms. This dynamic will change; they rotate between each other, allowing the NASDAQ to keep going higher regardless.
➡️⬅️ Cross-Market Correlation: Microsoft and Oracle (ORCL)
A crucial insight comes from comparing Microsoft with Oracle (ORCL). Oracle, like Microsoft (with its Azure network), has pivoted into AI and cloud computing, significantly increasing its revenue. Their price action is nearly identical. Microsoft is a $3.7 trillion company, while Oracle’s market capitalization is $677 billion, but they move in unison, sometimes leading or lagging each other.
Lagging Example: In June 2025, Microsoft was sitting at all-time highs while Oracle was lagging. This presented an opportunity to capture the catch-up move in Oracle.
Currently, the same inside 3-week candle pattern is present in both. However, Oracle is providing a live preview of how the pattern might play out. On the weekly chart, Oracle closed as a failure (triggering long), while Microsoft did not. Oracle is signaling it wants to go higher to tag the all-time highs. A similar pattern in September 2021 led to a massive pump in Oracle, and Microsoft followed shortly after.
Figure 6: Inside 3-week Candle Failure pattern in play for ORCL
This framework suggests that if one asset in the sector begins to move, the money will flow into the other correlated asset soon.
The Earnings Catalyst: Oracle has earnings on September 9th (Tuesday). If Oracle reports strong earnings and pumps, creating an “Inside 3-week candle failure” and making a new high, Microsoft will register that directive in its algorithm. Microsoft’s earnings are on October 28th. It can take its time, but it will follow Oracle to the all-time high.
Why the Correlation? This behavior is a function of passive investment flows into ETFs like QQQ. When investments flow into QQQ (via 401ks, hedge funds, Asset Management funds such as BlackRock, Fidelity, Vanguard and sovereign wealth funds etc.), when the fund purchases QQQ ETF, they are essentially forced to purchase the underlying companies based on weightage towards QQQ ETF. Microsoft holds a 13% weight (the second largest), and Oracle holds a 3% weight. This passive investing ensures they are extremely correlated with the index and each other.
🇩🇪 The German DAX: A High-Probability Consolidation Breakout
The German DAX is currently presenting one of the highest probability trade setups across all monitored assets. It is developing a rare chart pattern within a massive consolidation, signaling an impending significant move.
The Rare Double/Triple Inside 3-Week Candle
On the 3-week chart, the DAX is printing a double inside 3-week candle. This is the same rare consolidation pattern observed in Gold on the two-month chart. If the German DAX remains sideways for the next five days, this will close as a triple inside 3-week candle.
This pattern indicates massive consolidation. On the monthly chart, the DAX has been going sideways since May 2025. Like any other stock index, the German DAX is meant to go higher. If the US stock market is expected to rise in the next three months, the German DAX will follow. The setup in the DAX is arguably more lucrative than US indices precisely because of this prolonged consolidation. This is not a topping pattern or a reversal; it is energy building for a breakout.
Macroeconomic Driver: The SAP Correlation
The reason the German DAX is currently stagnant is due to one company: SAP. SAP is the Microsoft of the German DAX; it is responsible for carrying the index. A close analysis reveals a direct correlation: the September 2022 low in SAP corresponds to the DAX low; the push in SAP corresponds to the push in the DAX; the correction from July 2023 to October 2023 in SAP was reflected in the DAX as well.
The DAX is not moving because SAP is undergoing a correction. However, this correction appears to be nearing its end.
SAP Technical Analysis:
SAP is now sitting at a very strong support zone that has never been tapped this is a zone to blindly long.
It created an inside weekly candle and is tapping a bullish order block, closing as an inside weekly candle failure (closed above the low of the inside weekly candle lows).
On the daily chart, the pullback has served to fill an open gap on earnings from April 2025.
With the gap mostly filled and testing weekly support, SAP is likely ready to start rallying again.
On the quarterly chart, SAP has had seven consecutive bullish quarters. It is normal to have one down quarter before resuming the uptrend established since September 2022.
As SAP's pullback concludes, the pullback in the DAX should also end.
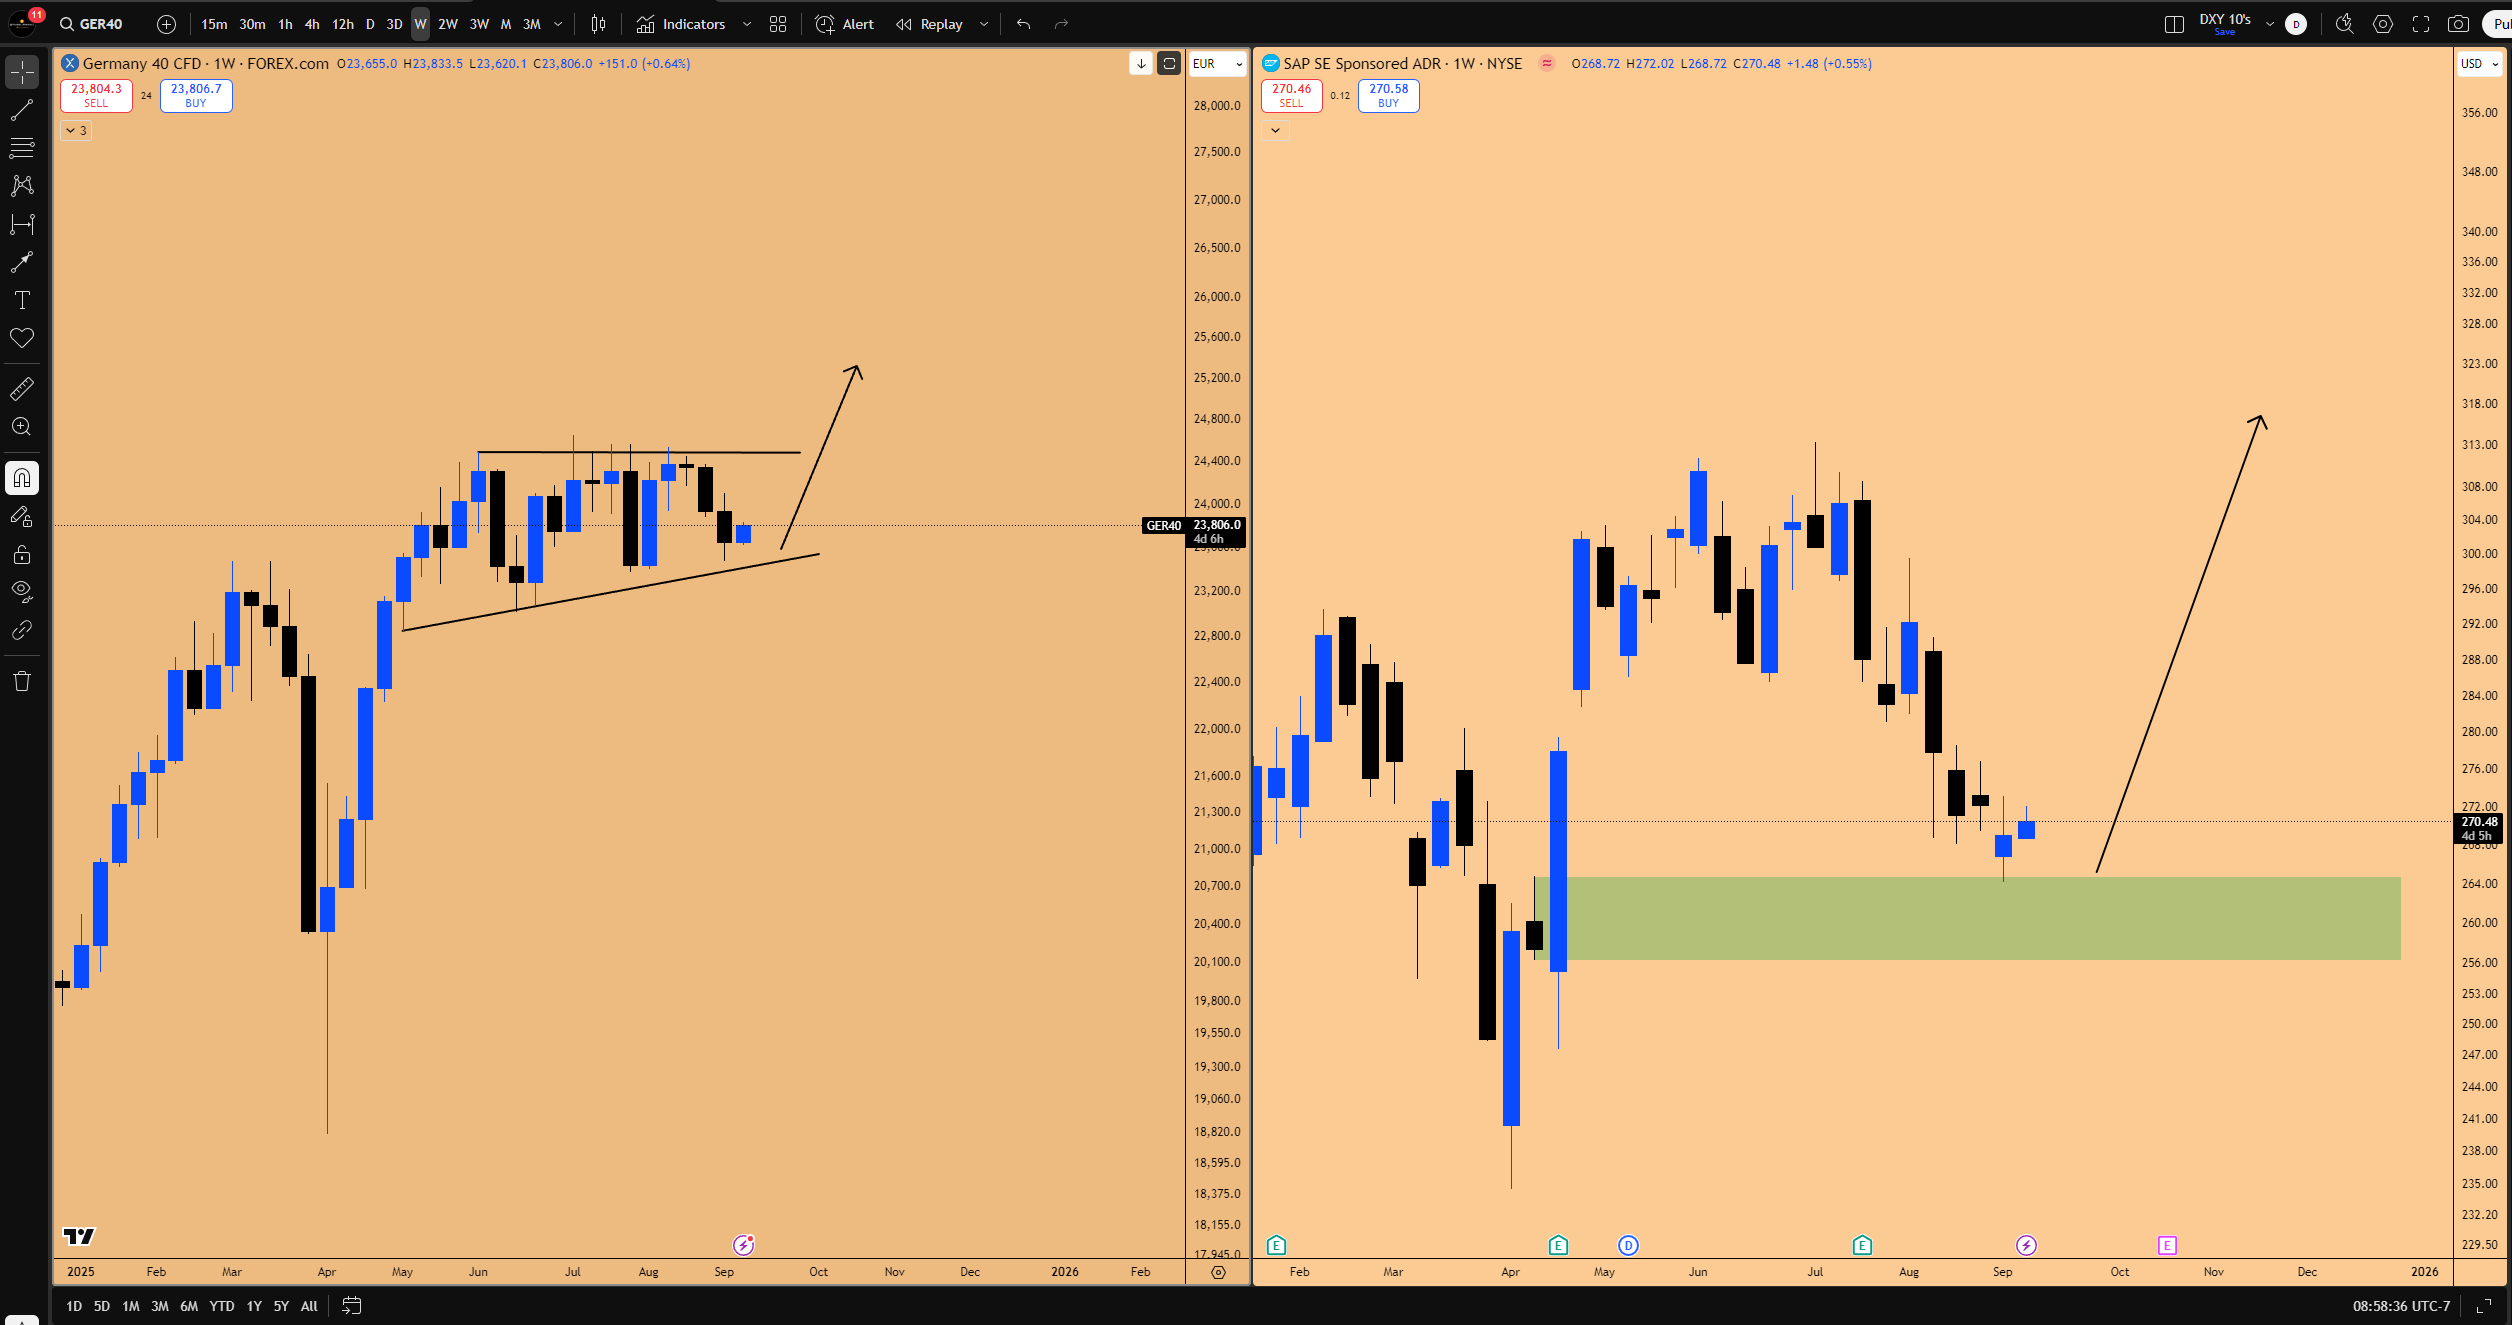
Figure 7: DAX consolidating while SAP undergoes a pullback. SAP rallying from support will cause DAX to breakout
DAX Technical Setup and Market Structure
The pattern in play for the DAX is an extremely bullish ascending triangle on the weekly chart.
It is important to understand the market structure of the DAX, which is heavily controlled. Since the bottom, the market has maintained a series of higher lows. However, the recent price action made a lower high. This means the most recent low (23,377) is not confirmed as a higher low yet; it is just low-hanging fruit. The main higher low is the one responsible for the push to the new all-time high. Therefore, the real support zone is lower.
If the market comes down and takes out the recent low, it does not cause a market structure shift.
Trade Setup 1: The Sweep
If we undergo a pullback and the recent low gets taken out, this presents a high risk-reward long opportunity. This is a low resistance liquidity run—a way of taking out stop losses without undercutting the market structure.
Entry: 23,377 (at the swing low if taken out)
Stop Loss: Below 23,000
Target: 24,648
Risk-Reward Ratio: 4.01
Trade Setup 2: Layered Entry Strategy
A layered approach is recommended when the DAX opens on Monday.
If DAX starts to drop and takes out the immediate lows, take the first long position at 23,475 (75 points higher than the swing low).
If the swing low itself gets taken out, take a second long position.
Use a combined stop loss right below the major low (below 23,000).
This strategy accounts for the possibility that the swing low holds, maintaining the bullish structure of higher lows and setting up for a breakout.
Swing Trade Outlook and Targets
This consolidation has been ongoing for a long time. The eventual breakout will not finish at the all-time highs; it will go further up, similar to Gold. Research on Gold suggests that when such long-term inside candles break, they yield a 10-15% rally. This same research applies to the DAX as a trending asset.
This is a swing trade position to hold into the year-end and potentially into Q1 2026 (January/February), supported by the risk-on environment, rate cuts, and seasonality.
Target: A 10% return puts the DAX at around 26,000.
Risk: The stop-out level is about 2.5% downside.
Swing Risk-Reward: 10-15% upside versus 2.5% downside (Approx. 3.57 RR targeting 10%).
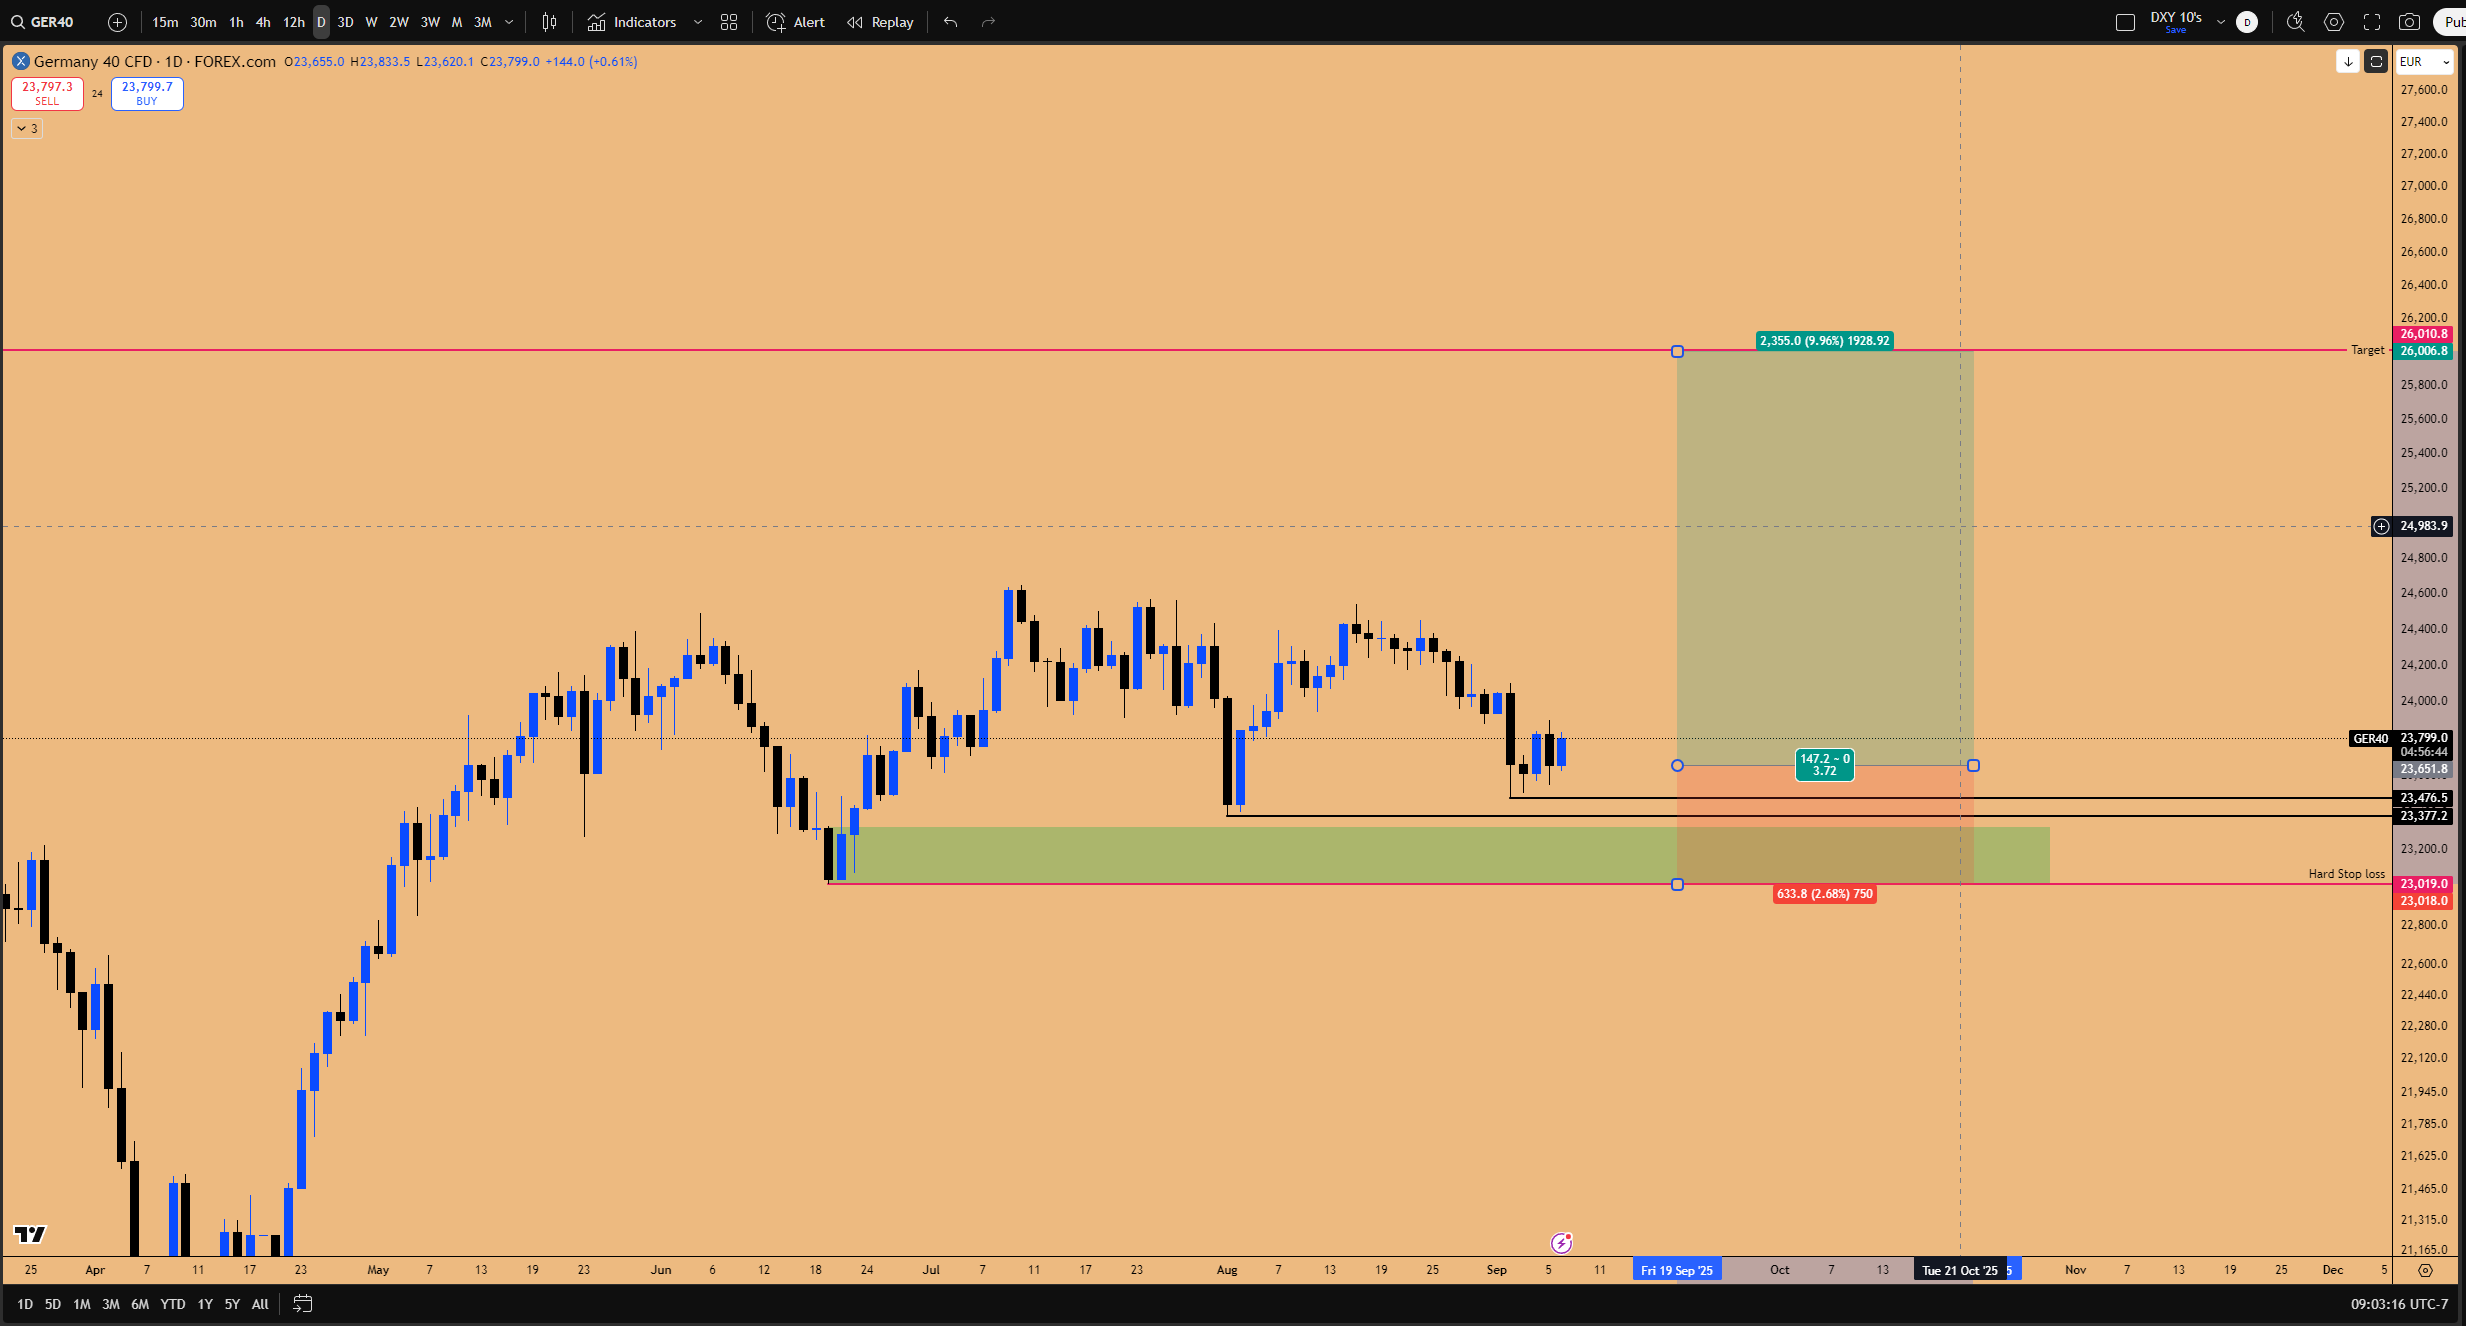
Figure 8: DAX Long trade setup
👑 Gold's Historic Breakout: Targeting $4,000 on the Double Inside Two-Month Candle
Gold is currently on the radar due to a historic breakout from a rare pattern that signals significant upside potential.
The Double Inside Two-Month Candle
On the two-month chart, Gold presented a double inside two-month candle. This pattern is rare, forming perhaps once a decade. The breakout is now in progress, confirmed by the weekly candle breakout with volume.
Historical Precedents and Measured Moves
We studied previous instances of this pattern to understand the potential trajectory.
Downside Examples:
September 2013: The last time this pattern formed was 12 years ago. The dominant trend was down, and the pattern led to a 20% decline in Gold over the next two years. The market did not recover and take out the high for six years (until March 2019).
Previous Instance: Another double inside two-month candle breakdown resulted in a 30% decline in the next six months.
These patterns carry out breakouts or breakdowns in the direction of the dominant trend.
Upside Examples:
Pre-2007 Meltup: This pattern formed just prior to the 2007 meltup, a period characterized by massive spending and currency devaluation, reflecting the sentiment that the party would never end. Gold captured massive gains following this breakout. The breakout candle provided an 18% return.
May 1986: Another historical double inside two-month candle breakout yielded an 18% return.
Research analyzing these breakouts indicates that the two-month candle which breaks out almost always renders an 18% to 20% return in total.
Current Breakout Trajectory and Targets
We are still in the very early phases of this breakout. We have only had one weekly candle printed, rendering a 4% return so far. There are still one month and 25 days left for this two-month candle to close.
By definition of this pattern breakout, it should render at least a 15% to 18% return.
Target: Even taking the lowest side of the target (15%), this projects Gold to about $4,000.
Is it going to get there in a straight line? Unlikely. So far, it has behaved like it wants to, but some sideways consolidation is anticipated before it catches up and goes higher again.
September vs. October Outlook: The September monthly candle size is already substantial, just one week in. It would not be surprising if Gold goes sideways for the remainder of September. However, the next monthly candle opening in October is where the big chunk of the move is expected. October also marks the opening of a new quarterly candle, where significant expansion is anticipated.
₿ Cryptocurrency Analysis: Navigating Bitcoin's Stagnation and Ethereum's 3-Week Setup
The cryptocurrency market, while correlated with risk-on assets, is currently presenting a mixed picture, requiring caution and specific setups for engagement.
Ethereum (ETH): The Critical Inside 3-Week Candle
In Ethereum, the inside weekly candle is currently taking out the lip, potentially looking like a failure. However, significant upside is not expected in the meantime, partly because Bitcoin does not seem ready to move higher.
The focus should shift to the 3-week chart. The 3-week candle closes in the coming week. If Ethereum does not go higher, it will confirm an inside 3-week candle. This pattern takes much higher precedence than the inside weekly candle.
Key Levels and Timing:
Untested SR Level: The SR level at 4,095 remains a key long target. If the inside 3-week candle forms and the next candle comes down to test 4,095, that would be a position to take.
Quarterly Candle Consideration: The current quarterly candle on Ethereum is extremely strong. Expecting further upside this quarter (23 days remaining) is "borderline absurd," with no historical precedence supporting such expansion. Positioning is better suited for the next quarterly candle in October.
Strong Support Zone: The area between $3,355 and $3,940 is a very strong support zone. An area to enter a spot long position for the next six months is between 3,744 and 3,940.
Long-Term Outlook:
Ethereum is breaking out of a massive triangle consolidation. A pullback into the support zone would be a retest of the trend line resistance turned support. Based on this breakout, a run-up to $10,000 going into 2026 is anticipated. The 4,100 area has been tested five times (May 2021, Nov 2021, Mar 2024, Nov 2024, and now) and should break aggressively to new all-time highs.
CME Futures Analysis:
The previous all-time high was not printed on the CME futures chart. This is what the algorithm recognizes. The inside 3-week candle is also forming on the CME charts.
CME SR Level: The SR level at 4,138 is untested. A first-time test here is a blind long.
Deeper Pullback Trade Setup:
The weekly bullish order block can be refined on the daily chart. If the market undergoes a sizable pullback deeper into the weekly support zone, the 3,782 SR level coupled with the daily bullish block offers an incredible long opportunity.
Entry: 3,782.5
Stop Loss: Below 3,558
Target: $4,900 (all-time high mark).
🏁 Key Takeaways and Outlook
The overarching theme driving the markets is the anticipation of a massive liquidity injection. The weak NFP data virtually guarantees Fed rate cuts starting this month, which act as direct stimulus for financial markets. Despite concerns about the real economy, the historical precedent, exemplified by the 398-day rally following the 2018 rate cuts, supports a bullish outlook for risk-on assets.
We are also entering the strongest seasonal period (Q4), driven by robust US consumer spending, which directly benefits the Magnificent 7 and the NASDAQ index. This confluence of liquidity and seasonality is expected to create an incredibly bullish environment, potentially leading to "blowoff top" scenarios from October into early 2026.
The highest conviction setups are currently found outside the US indices themselves. The German DAX is poised for a 10-15% breakout from a rare triple inside three-week consolidation, targeting 26,000, driven by the expected recovery in SAP. Gold is undergoing a historic breakout from a double inside two-month candle, targeting $4,000 based on historical measured moves of 18-20%. Microsoft presents a compelling swing long opportunity via an inside monthly candle failure, supported by cross-market analysis with Oracle and its correlation with the NASDAQ, offering potential options returns exceeding 100-300%.
While the broader equity markets prepare for expansion, the cryptocurrency market requires patience. Bitcoin remains range-bound with critical support at $107,000, while Ethereum's trajectory hinges on the close of its inside three-week candle, with key long entries identified at $4,138 or $3,782.5.
As we head toward the end of September, focus remains on preserving dry powder for strategic deployment in Q4. The upcoming Quarterly Outlook Report on September 30th will detail the comprehensive strategy for navigating what is expected to be one of the best periods for investment.
What's your take on these setups? Are you preparing for the Q4 liquidity wave? Share in the comments let's discuss strategies. Subscribe for more market breakdowns!
Disclaimer: This isn't financial advice – just market musings from the charts. Always do your own research.
If you enjoyed this deep dive, please share it with fellow traders!